INDICATOR DIAGRAM
P -T curve
P - V curve
V - T curve
Q -T curve
The correct Answer is:B
Step by step video, text & image solution for INDICATOR DIAGRAM by Physics experts to help you in doubts & scoring excellent marks in Class 12 exams.
Updated on:21/07/2023Topper's Solved these Questions
- THERMODYNAMICSBOOK - AAKASH INSTITUTECHAPTER - THERMODYNAMICSEXERCISE - ASSIGNMENT (SECTION -A) (Objective Type Questions)
39 Videos
- THERMODYNAMICSBOOK - AAKASH INSTITUTECHAPTER - THERMODYNAMICSEXERCISE - ASSIGNMENT (SECTION -B) (Objective Type Questions)
23 Videos
- THERMODYNAMICSBOOK - AAKASH INSTITUTECHAPTER - THERMODYNAMICSEXERCISE - TRY YOURSELF
12 Videos
- THERMAL PROPERTIES OF MATTERBOOK - AAKASH INSTITUTECHAPTER - THERMAL PROPERTIES OF MATTEREXERCISE - Assignment (Section-J) Akash Challengers Questions
7 Videos
- UNITS AND MEASUREMENTSBOOK - AAKASH INSTITUTECHAPTER - UNITS AND MEASUREMENTSEXERCISE - ASSIGNMENT (SECTION - D)
15 Videos
Similar Questions
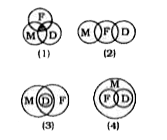
Among the members of the club, some are lady doctors. Indicate which diagram does not imply this statement. (Note: M = Members: F - Female and D = Doctors).
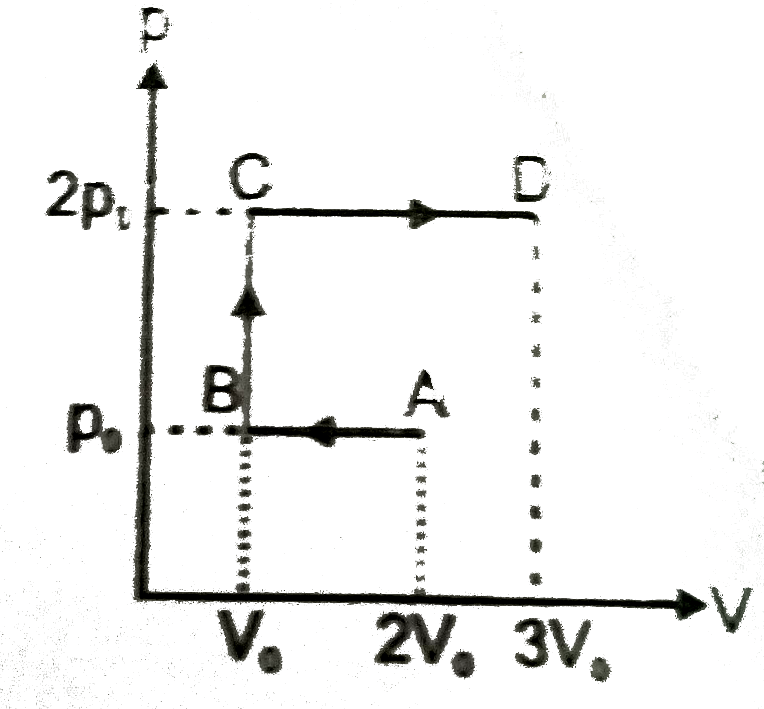
View SolutionP−V indicator diagram for a given sample of monoatomic idela gas is shown in figure. If the average molar specific heat capacity of the system for the process ABCD is xR4 than find value of x:(R is a uniersal gas constant)
View Solution
Knowledge Check
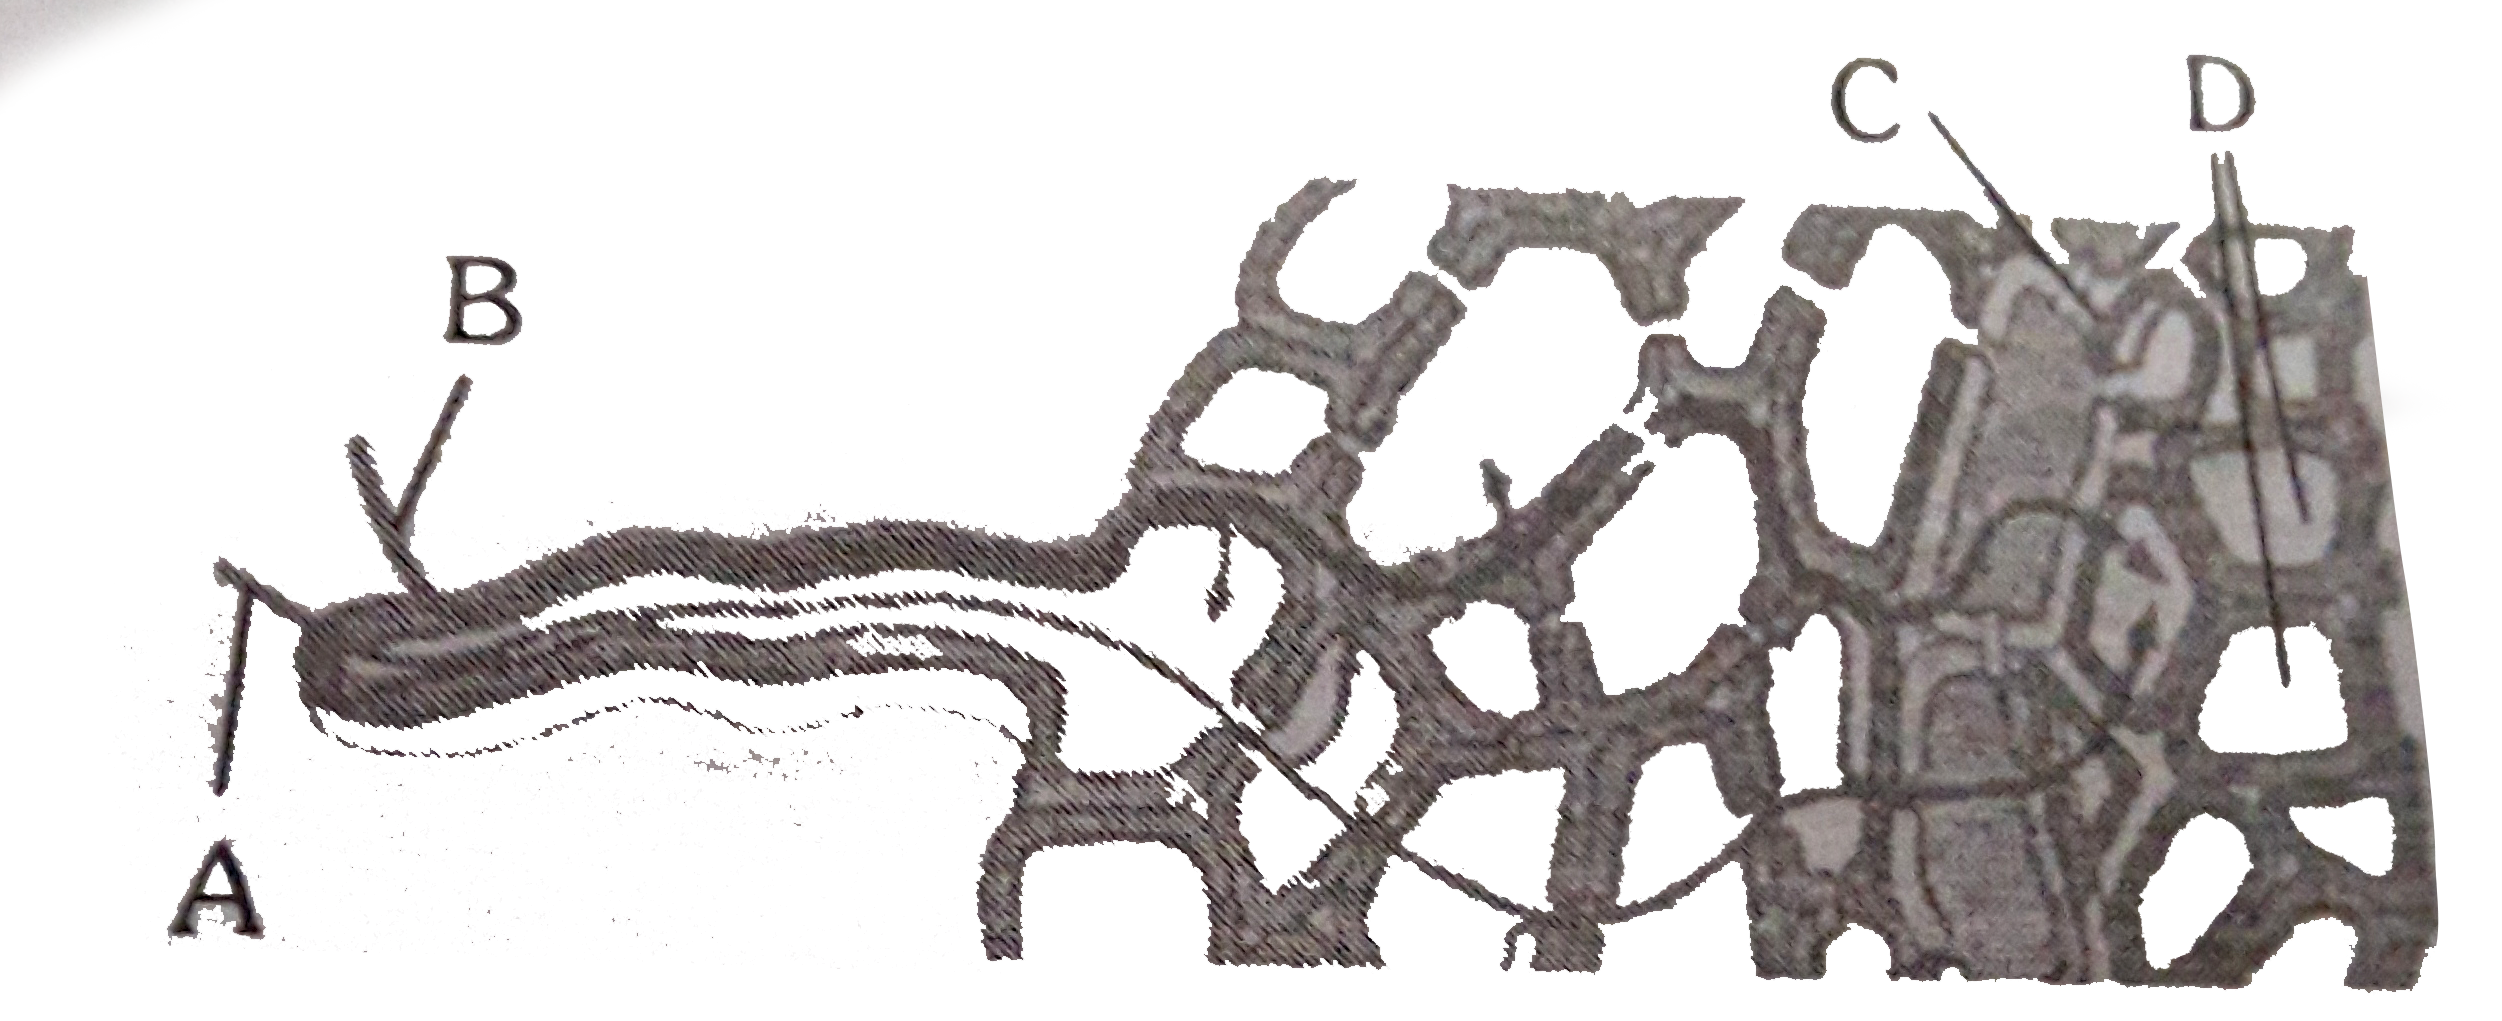
The following diagram indicates the development of root nodule in soyabean.

Identify A to D respectively.AA-Rhizobial bacteria, B - Cortex cell, C- Outer cortex, D-Infection threadBA-Rhizobial bacteria, B- Cortex cell, C - Inner cortex, D-Infection threadCA-Rhizobial bacteria, B- Endodermal cell, C- Inner Endodermis, D - Infection threadDA-Nitrosomonas bacteria, B-Cortex cell, C- Inner cortex, D-Infection threadThe figure shows an energy level diagram for the hydrogen atom. Several transition are marked as I, II, III, …………. The diagram is only indicative and not to scale.
 AThe transition in which a Balmer series photon absorbed is VIBThe wavelength of the radiation involved in transition II is 486 nmCIV transition will occur when a hydrogen atom is irradiated with radiation of wavelength 103nmDIV transition will emit the longest wavelength line in the visible portion of the hydrogen spectrum
The diagram indicates routes of transport of water and minerals from the soil through the root. Identify letters A to D.
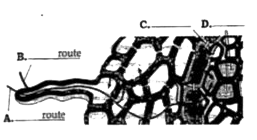 AA-Symplastic, B-Apoplastic, C-Casparian strip, D-Xy. vesselsBA-Apoplastic, B-Symplastic, C-Casparian strip, D-Xy. vesselsCA-Symplastic, B-A-poplastic, C-Cellulosic strip, D-Ph. vesselsDA-Apoplastic, B-Symplastic, C- Cellulosic strip, D-Xy. vessels
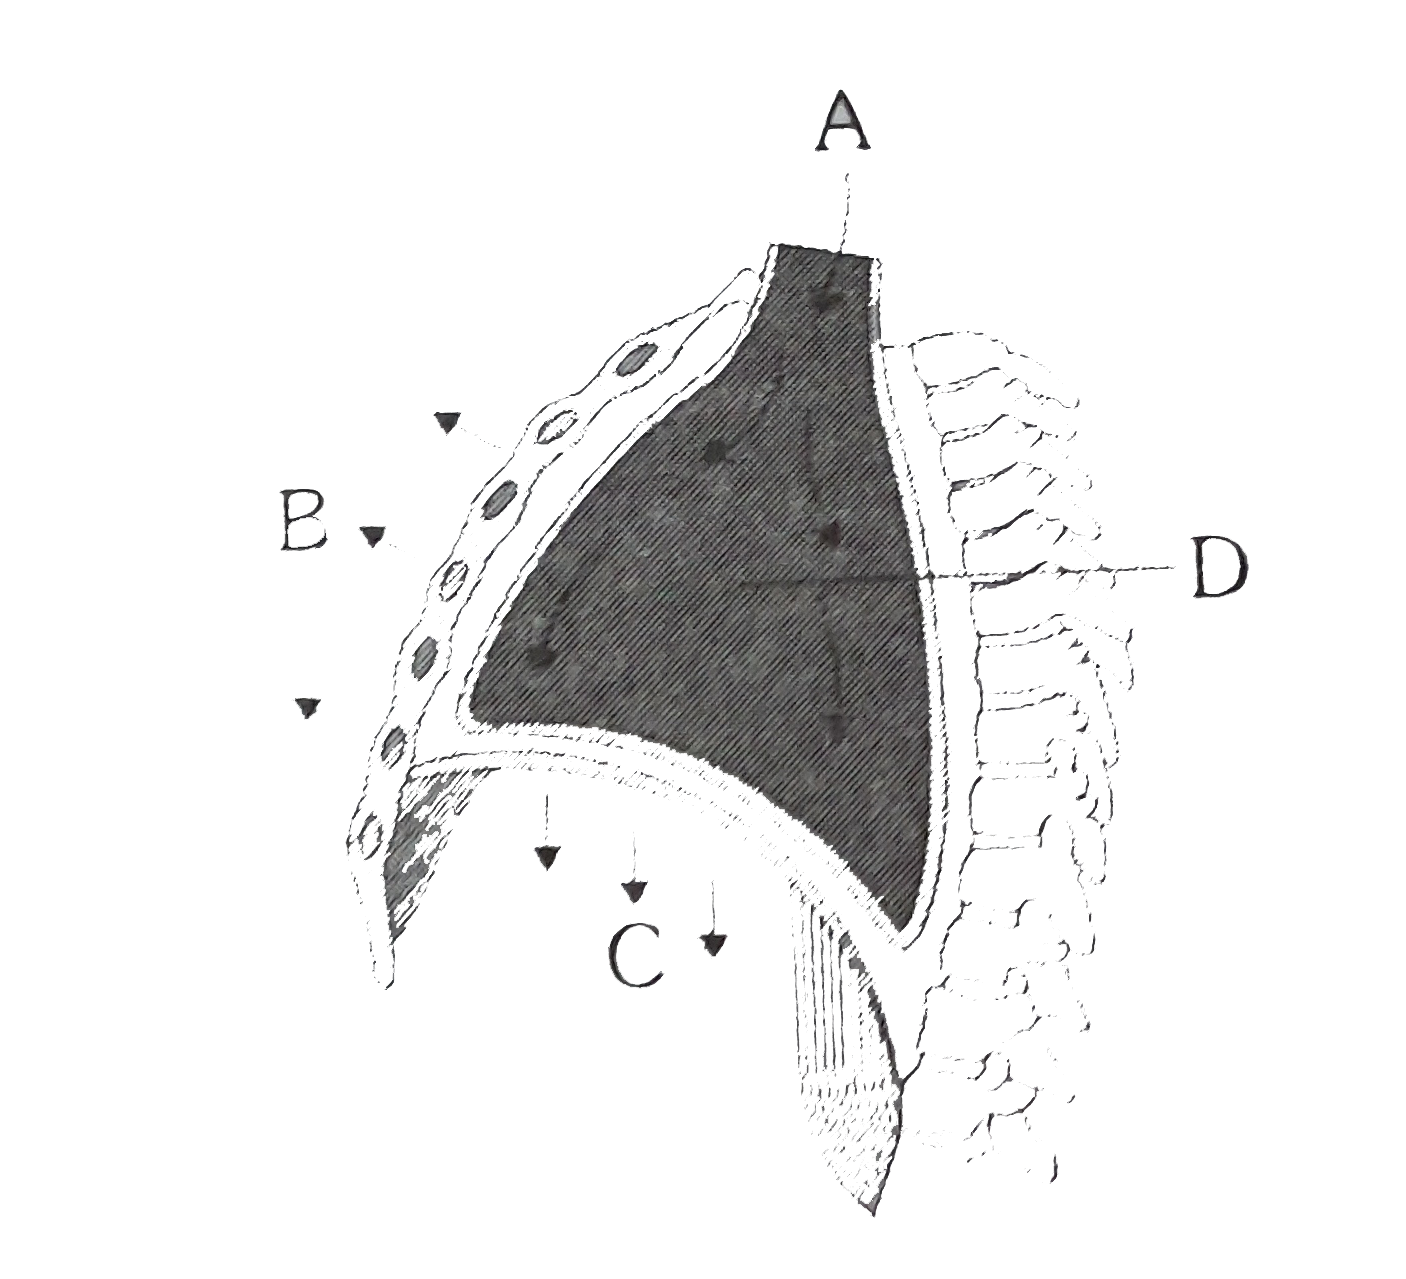
Following diagram indicates the mechanism of breathing. Identify all the parts A, B, C and D correctly
View SolutionThe given diagram indicates routes of transport of water and minerals from the soil through the root. Identify letters A, B, C and D
View SolutionAmong the members of the club, some are lady doctors. Indicate which diagram does not imply this statement. (Note : M = Members, F = Female and D = Doctors).
View SolutionWhich type of crystal defect is indicated by the diagram given below ?
Na+Cl−Na+Cl−Na+Cl−
Cl−Cl−Na+Na+
Na+Cl−Cl−Na+Cl−
Cl−Na+Cl−Na+Na+
View SolutionWhich type of crystal defect is indicated by the diagram given below ?
Na+Cl−Na+Cl−Na+Cl−
Cl−Cl−Na+Na+
Na+Cl−Cl−Na+Cl−
Cl−Na+Cl−Na+Na+
View Solution
