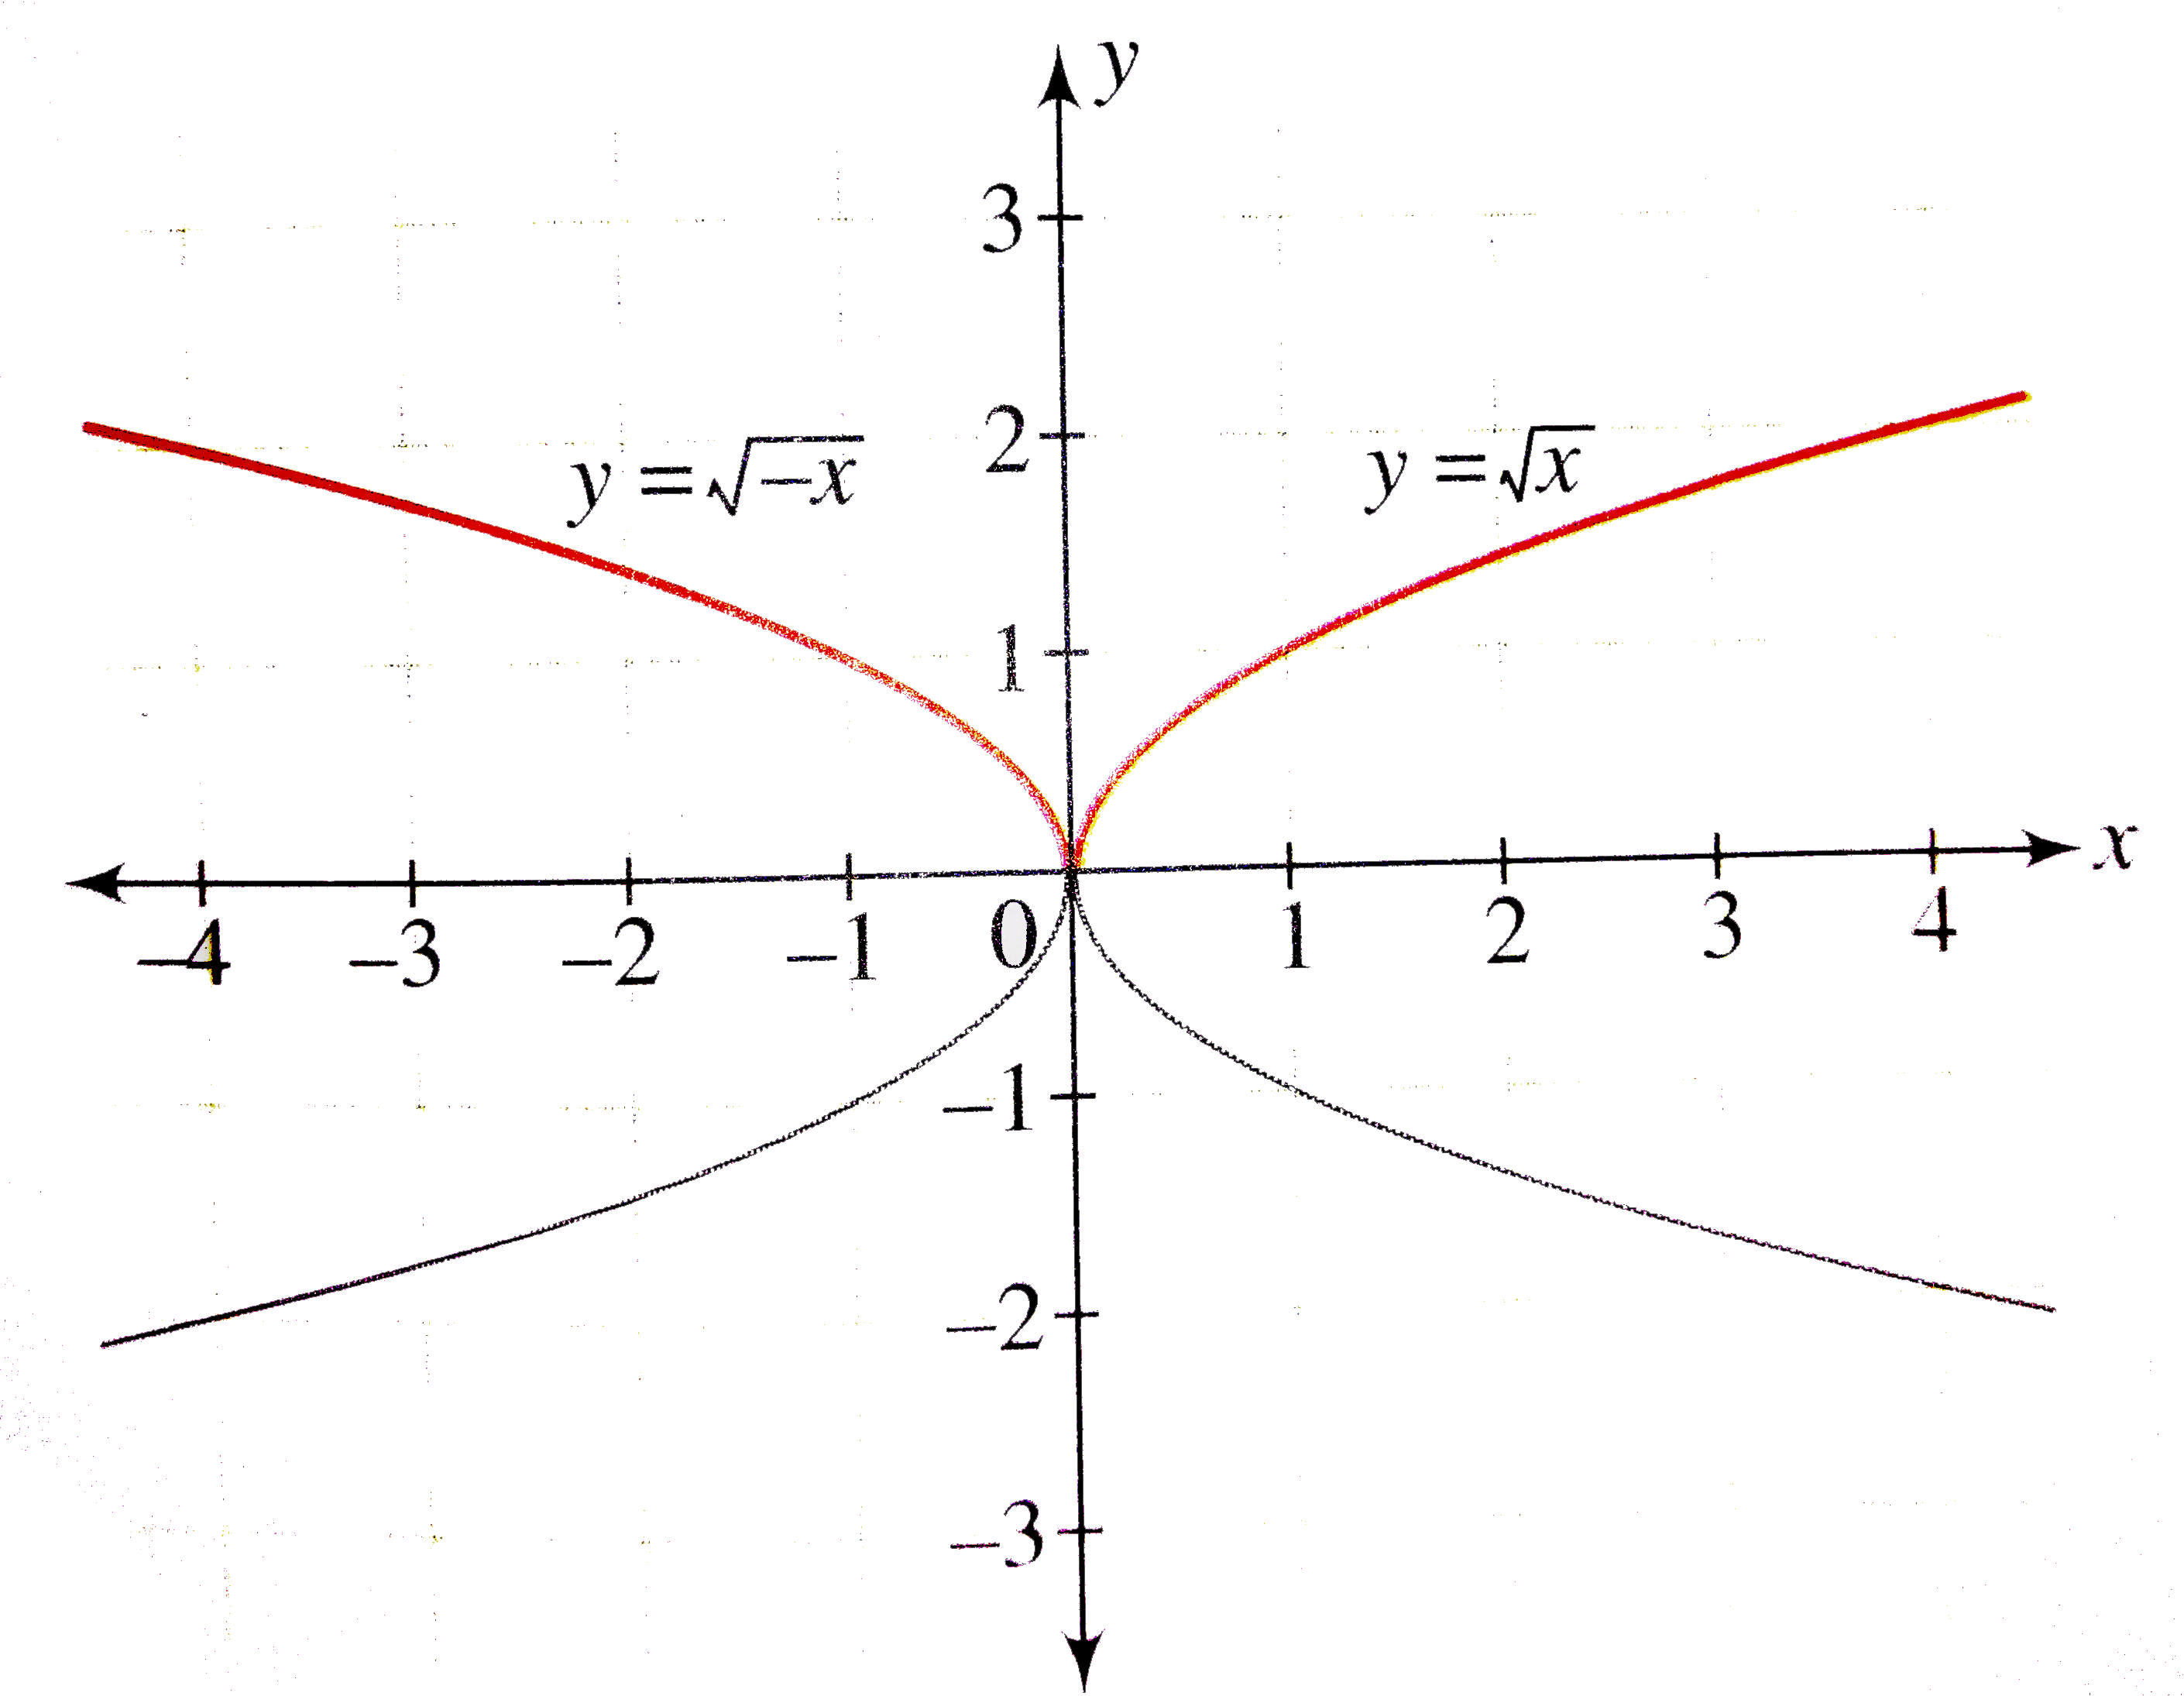
Draw the graph of y=|x|1/2 from −1≤x≤1.
Video Solution
Text Solution
We have y=f(x)=|x|1/2,−1≤x≤1
={√−x,x<0√x,x≥0
⇒ y2=−x if −1≤x≤0andy2=x if 0≤x≤1
[Here y should be taken always +ve, as by definition, y is a+ve square root.]
Clearly, y2=−x represents the upper half of the left-handed parabola (upper half as y is +ve) and y2,=x represents the upper half of the right-handed parabola.
Thus, the graph of y=f(x) is as follows.

|
Updated on:21/07/2023
Topper's Solved these Questions
- BOOK - CENGAGECHAPTER - GRAPHS OF ELEMENTARY FUNCTIONS EXERCISE - Exercise34videos
GRAPHS OF ELEMENTARY FUNCTIONS
- BOOK - CENGAGECHAPTER - GRAPHS OF POLYNOMIAL AND RATIONAL FUNCTIONSEXERCISE - Exercise13videos
GRAPHS OF POLYNOMIAL AND RATIONAL FUNCTIONS
- BOOK - CENGAGECHAPTER - GRAPHS OF TRIGONOMETRIC FUNCTIONSEXERCISE - Exercise22videos
GRAPHS OF TRIGONOMETRIC FUNCTIONS
Similar Questions
Knowledge Check
- Question 1 - Select One
The area between the curves y=x2andy=x1/3,−1≤x≤1 is
A12B2C34D32
Draw the graph of y=sinx and y=cosx,0≤x≤2π
View SolutionDraw the graph of y={2x,x2−2x≤01+3.5x−x2x2−2x>0
View SolutionDraw the graph of the function f(x)=x−∣∣x−x2∣∣,−1≤x≤1 and find the points of non-differentiability.
View SolutionDraw the graph of the inequation x+y≤0.
View SolutionDraw the graph of the function f(x)=x−∣∣x−x2∣∣,−1≤x≤1 and discuss the continuity or discontinuity of f in the interval −1≤x≤1
View SolutionDraw the graph of f(x)={x3,x2<1x,x2≤1
View SolutionDraw the graph of the function: f(x)=⎧⎪⎨⎪⎩x if x≤0x2 if 0<x≤2x if x>2
View Solution

