In the adjoining figure, seg
 Solution in Tamil
Step by step video & image solution for In the adjoining figure, seg BD bot "side" AC, C-D-A. "Prove that" : AB^(2) = BC^(2) + AC^(2) - BC.AC by Maths experts to help you in doubts & scoring excellent marks in Class 10 exams.
Updated on:21/07/2023Topper's Solved these Questions
- PYTHAGORAS THEOREMBOOK - CHETAN PUBLICATIONCHAPTER - PYTHAGORAS THEOREMEXERCISE - ASSIGNMENT -2
8 Videos
- PYTHAGORAS THEOREMBOOK - CHETAN PUBLICATIONCHAPTER - PYTHAGORAS THEOREMEXERCISE - ASSIGNMENT -3
1 Videos
- PYTHAGORAS THEOREMBOOK - CHETAN PUBLICATIONCHAPTER - PYTHAGORAS THEOREMEXERCISE - Additional MCQ.s
10 Videos
- MODEL ACTIVITY SHEET BOOK - CHETAN PUBLICATIONCHAPTER - MODEL ACTIVITY SHEET EXERCISE - QUESTION
29 Videos
- QUADRATIC EQUATIONSBOOK - CHETAN PUBLICATIONCHAPTER - QUADRATIC EQUATIONSEXERCISE - ASSIGNMENT
12 Videos
Similar Questions
Solve the following sub questions:
Is 28,21 and 35 a pythagorean triplet?
View SolutionSolve the following sub questions :
State and prove 'Pythagoras theorem'
View SolutionIn ΔRST,∠s=90∘,RT=12m,ST=8 m then RS=
View SolutionWhat is the ratio of 1mm 1cm ?
View SolutionIf α and β are the roots of quadratic equation 2x2+4x+3=0, then the value of α+β=
View SolutionHow many lines of symmetry does the above figure have ?
View Solution
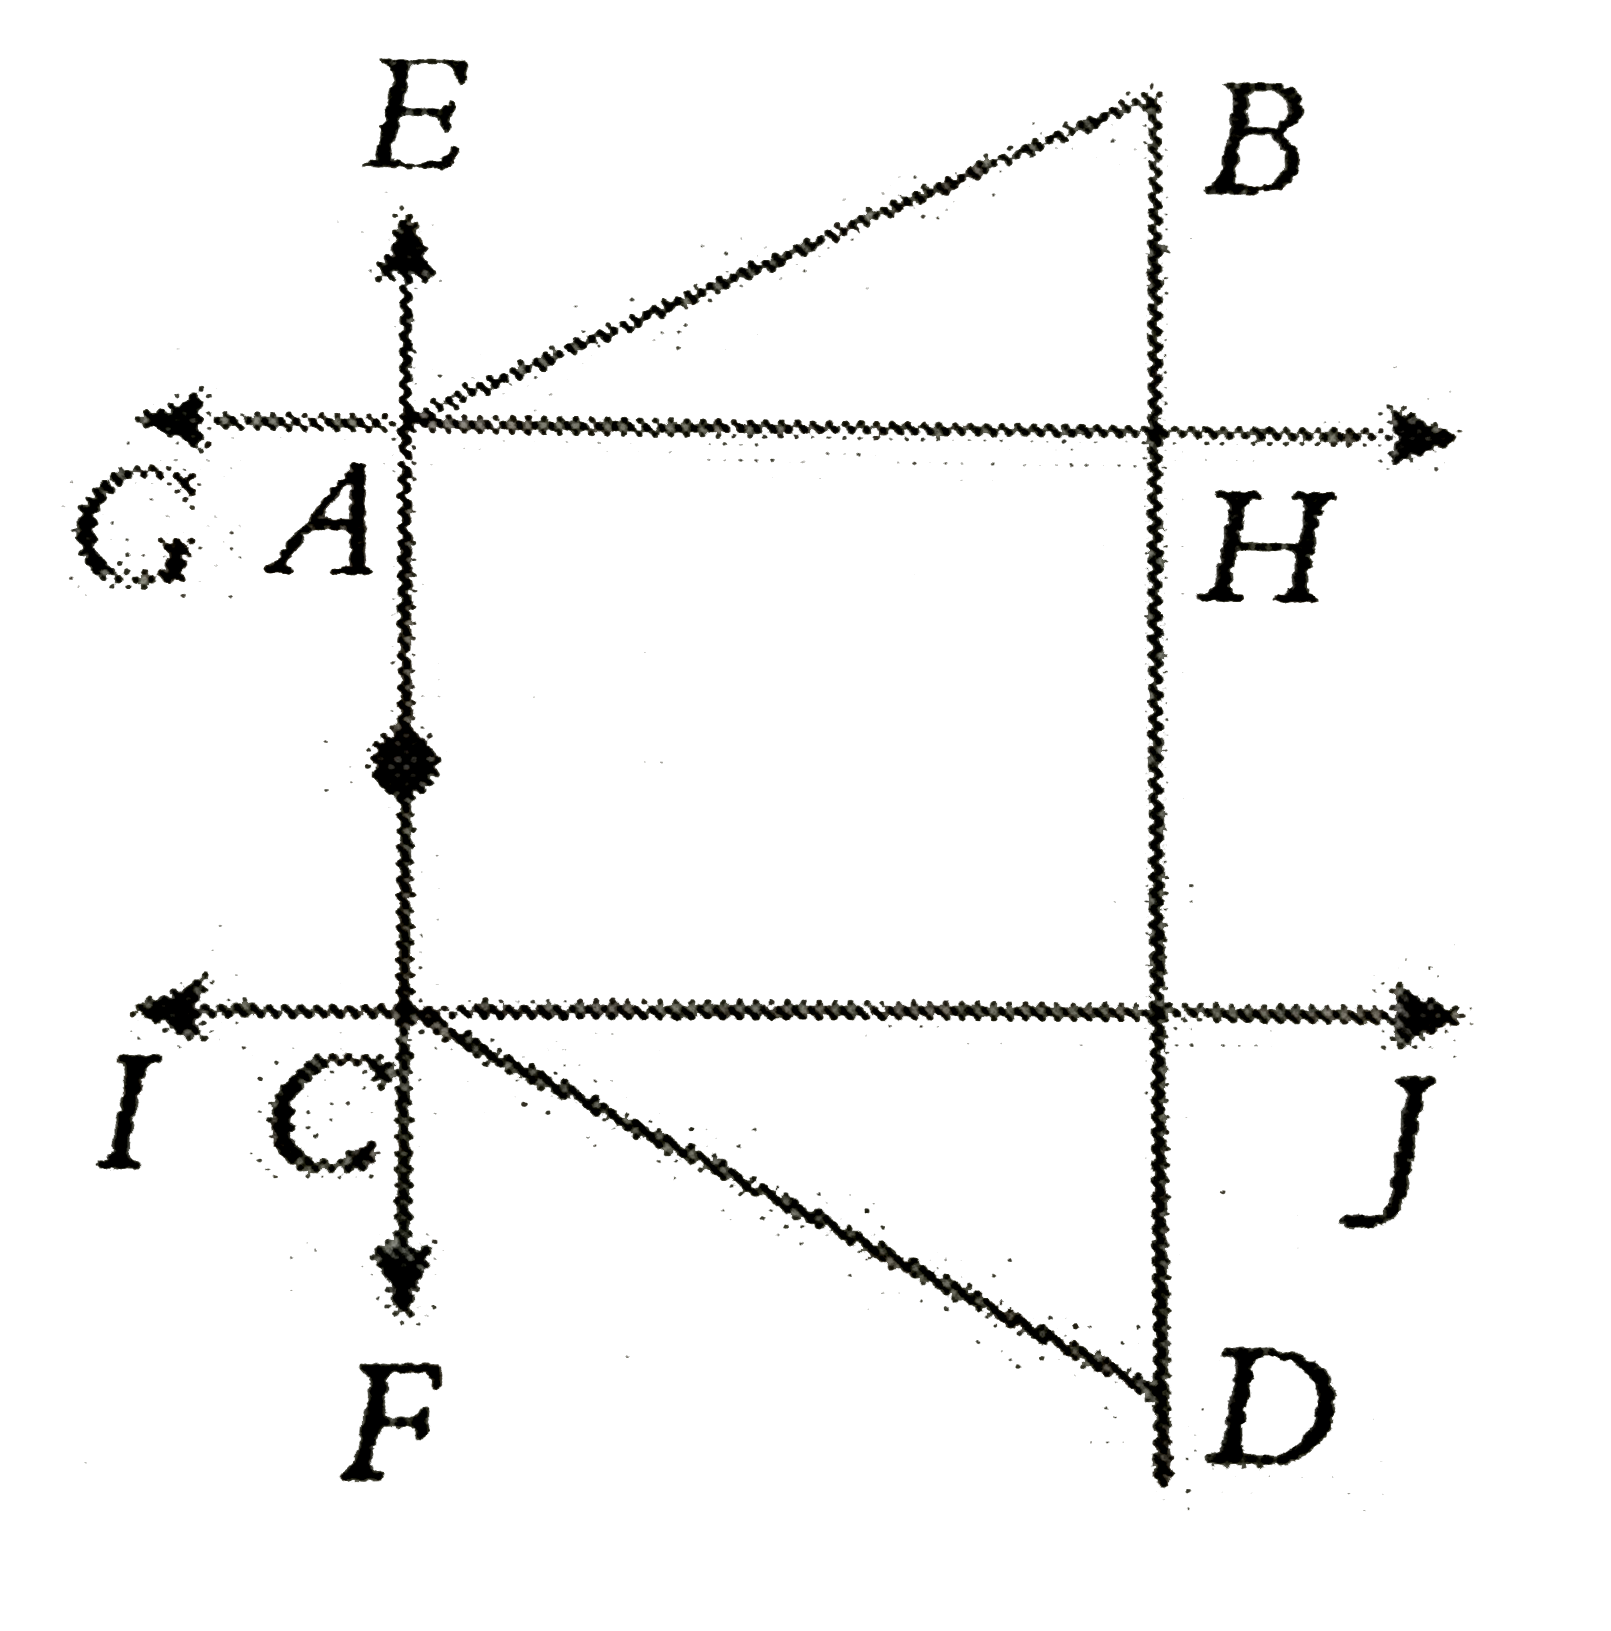
In the above figure, GH∣∣IJ and AC∣∣BD,AB and CD are bisectors of ∠EAH and ∠FCJ respectively. Find the ∠ABD+∠BDC, if ∠BAC=3∠BDC.
View SolutionDetermine the point of symmetry of a regular hexagon.
View SolutionDtermine the images of the following figure about the given line :
View SolutionIn the figure above (not to scale), ¯¯¯¯¯¯AB⊥¯¯¯¯¯¯CDandAD is the bisector of ∠BAE.AB=3cm and AC=5cm. Find CD.
View SolutionMatch the following Column A to Column B

View SolutionMatch the following Column A to Column B

View SolutionMatch the following Column A to Column B

View SolutionThe inequation represented by the graph given below is :
View SolutionThe inequation that best describes the graph given below is _________
View SolutionThe inequation that best describes the following graph is _________
View Solution
