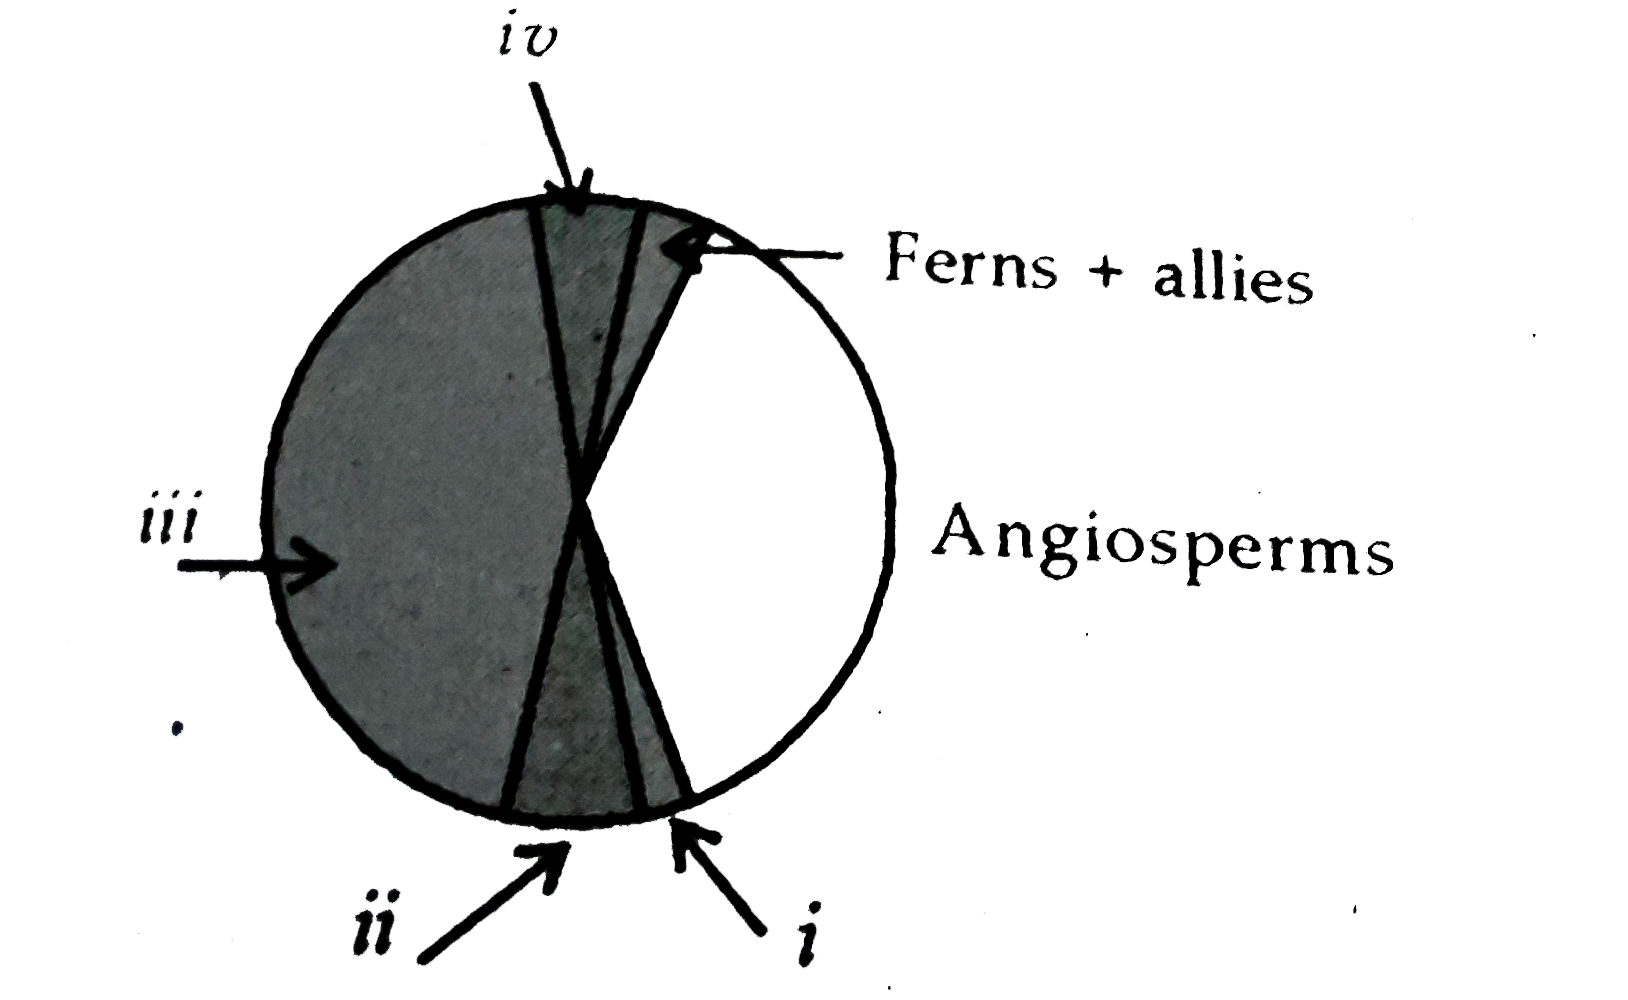
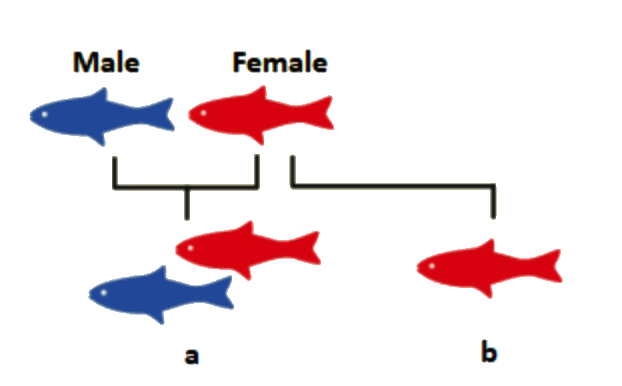
Observe the pie chart given below showing biodiversity and identify 'a' and 'b'
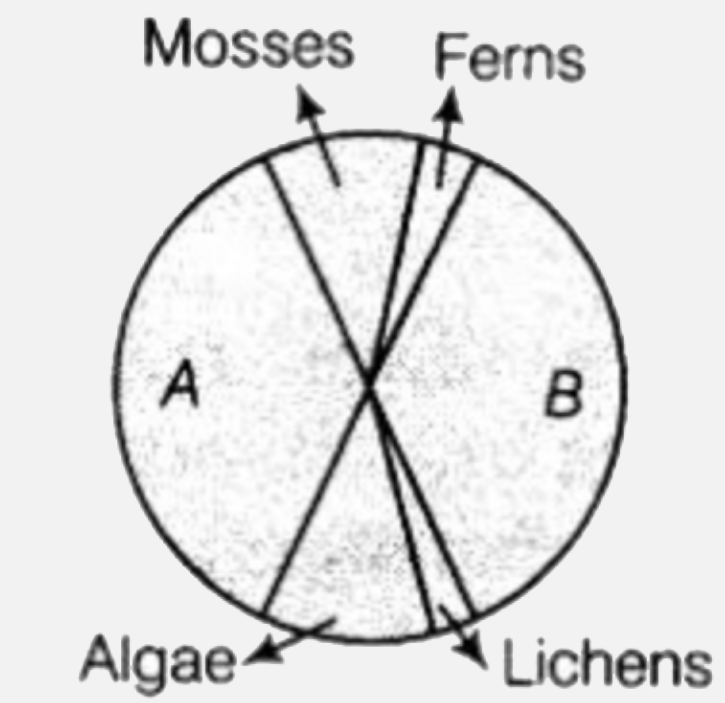
a = Bryophytes
b = Gymnosperms
a = Fungi
b = Gymnosperms
a = Pteridophytes
b = Angiosperms
a = Fungi
b = Angiosperms
The correct Answer is:D
Step by step video & image solution for Observe the pie chart given below showing biodiversity and identify 'a' and 'b' by Biology experts to help you in doubts & scoring excellent marks in Class 12 exams.
Updated on:21/07/2023Topper's Solved these Questions
Similar Questions
Knowledge Check
Observe the given pie chart representing biodiversity of different vertebrates. Choose the correct option for (A-C) A B C
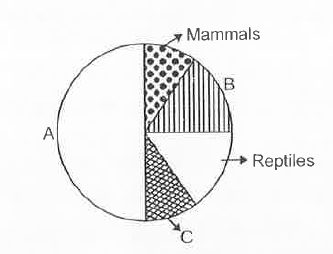 Afishes Birds amphibiansBfishes molluscs amphibiansCinsects Birds fishesDinsect crustaceans molluscs
The following pie chart shows th export of automobiles of India to the 10 countries given below in 2014. The 10 countries imported 47.8% of the total export of India. Observe the chart given below and answer the following question :
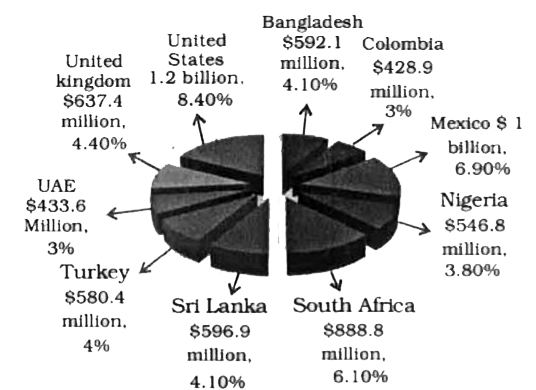
What is the average of imports of the countries UAE, Bangladesh, and Sri Lanka?A580.5 millionB618.6 millionC473.7 millionD540.8 millionThe following pie chart shows th export of automobiles of India to the 10 countries given below in 2014. The 10 countries imported 47.8% of the total export of India. Observe the chart given below and answer the following question :
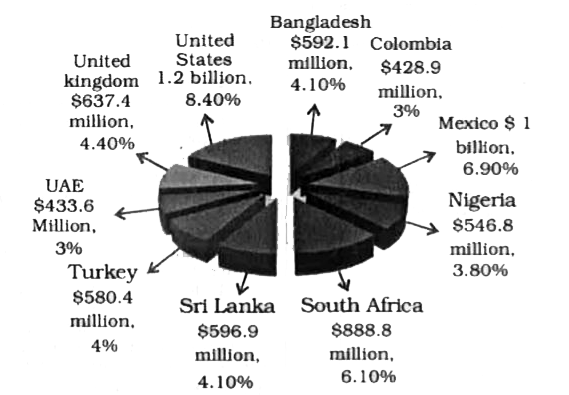
What is the corresponding angle to the exports for Turkey?A14.4∘B15.2∘C12.5∘D17.7∘
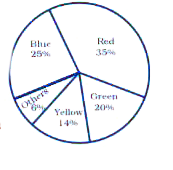
Students of a class voted for their favourite colour and a pie chart was prepared based on the data collected.
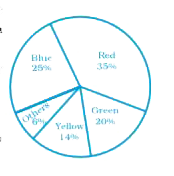
Observe the pie chart given below and answer questions based on it.
Which of the following is a reasonable conclusion for the given data?
View SolutionObserve the pie chart given below and answer questions based on it.
Which colour received 15 of the votes?
View SolutionThis question is to be answered on the basis of the pie chart given below showing how a person's monthly salary is distributed over different expanse heads
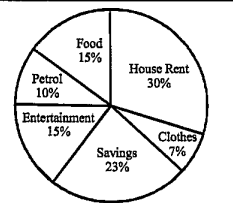
The angle made at the centre of the pie chart by the sector representing the expanse on petrol is
View SolutionThe following pie chart shows the export of automobiles of India to the 10 countries given below in 2014. The 10 countries imported 47.8% of the total export of India. Observe the chart given below and answer the following question:
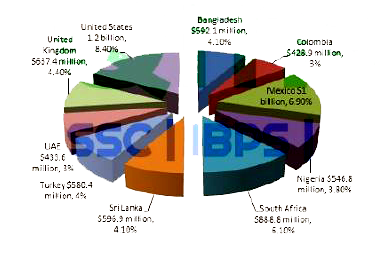
What is the average of imports of the countries UAE, Bangladesh, and Sri Lanka?
View SolutionThe following pie chart shows the export of automobiles of India to the 10 countries given below in 2014. The 10 countries imported 47.8% of the total export of India. Observe the chart given below and answer the following question:
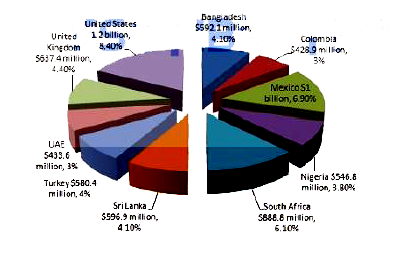
What is the total export value of automobiles?
View Solution

