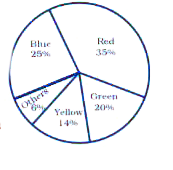
Students of a class voted for their favourite colour and a pie chart was prepared based on the data collected.
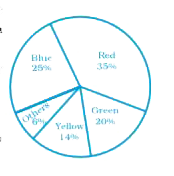
Observe the pie chart given below and answer questions based on it.
Which of the following is a reasonable conclusion for the given data?
120 th student voted for blue colour
Green is the least popular colour
The number of students who voted for red colour is two times the number of students who voted for yellow colour
Number of students liking together yellow and green colour is approximately the same as those for red colour.
Step by step video & image solution for Students of a class voted for their favourite colour and a pie chart was prepared based on the data collected. Observe the pie chart given below and answer questions based on it. Which of the following is a reasonable conclusion for the given data? by Maths experts to help you in doubts & scoring excellent marks in Class 8 exams.
Updated on:21/07/2023Topper's Solved these Questions
- DATA HANDLINGBOOK - NCERT EXEMPLARCHAPTER - DATA HANDLINGEXERCISE - EXERCISE (Fill in the blanks )
23 Videos
- DATA HANDLINGBOOK - NCERT EXEMPLARCHAPTER - DATA HANDLINGEXERCISE - EXERCISE (True or False)
23 Videos
- DATA HANDLINGBOOK - NCERT EXEMPLARCHAPTER - DATA HANDLINGEXERCISE - THINK AND DISCUSS
2 Videos
- COMPARING QUANTITIESBOOK - NCERT EXEMPLARCHAPTER - COMPARING QUANTITIESEXERCISE - Think and Discuss
2 Videos
- DIRECT AND INVERSE PROPORTIONS BOOK - NCERT EXEMPLARCHAPTER - DIRECT AND INVERSE PROPORTIONS EXERCISE - THINK AND DISCUSS
2 Videos
Similar Questions
Knowledge Check
The following pie-chart shows the percentage distribution of the expenditure incurred in publishing a book. Study the pie-chart and answer the questions based on it.
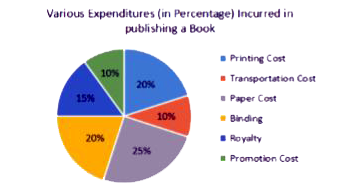
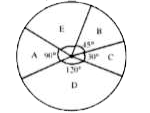
Royalty on the book is less than the paper cost by :A0.25B0.3C0.5D0.4The pie chart, given here, represents the number of valid votes obtained by four students who contested election for school leadership. The total number of valid votes polled was 720.
Observe the chart and answer the questions based on it.
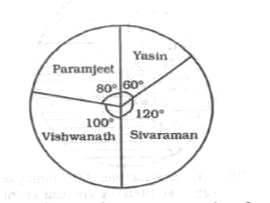
What was the minimum number of votes obtained by any candidate ?A100B110C120D130The pie chart, given here, represents the number of valid votes obtained by four students who contested election for school leadership. The total number of valid votes polled was 720.
Observe the chart and answer the questions based on it.
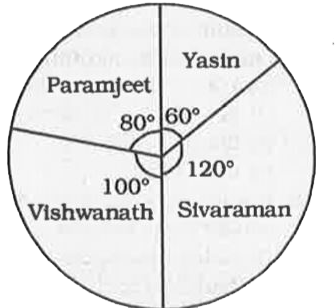
What was the minimum number of votes obtained by any candidate?A100B110C120D130
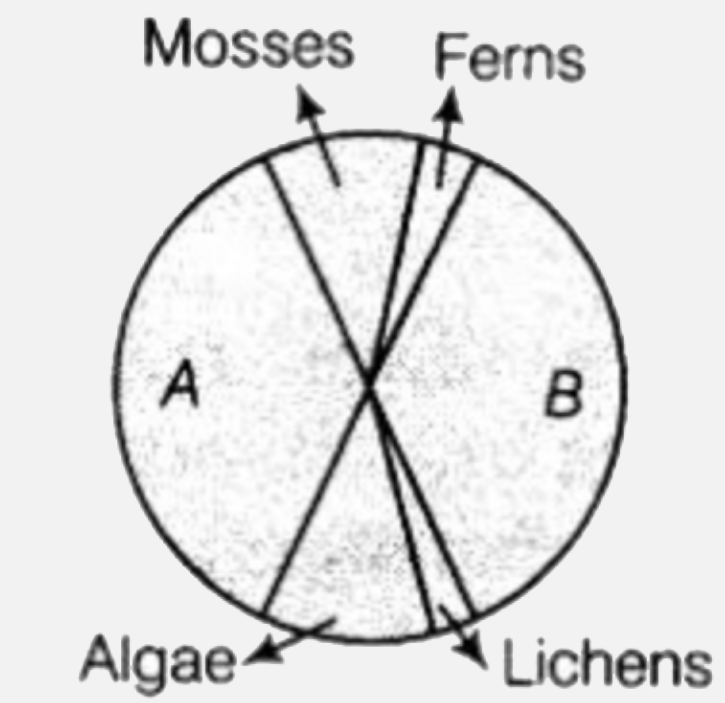
Observe the pie chart given below showing biodiversity and identify 'a' and 'b'
View SolutionThe pie chart, given here, represents the number of valid votes obtained by four students who contested election for school leadership. The total number of valid votes polled was 720.
Observe the chart and answer the questions based on it.
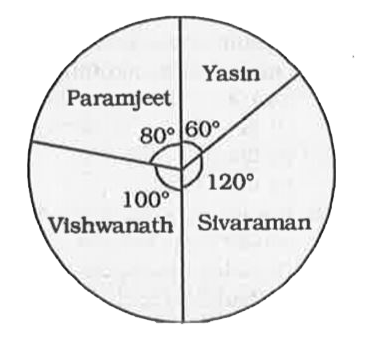
By how many votes did the winner defeat his nearest rival ?
View SolutionThe pie chart, given here, represents the number of valid votes obtained by four students who contested election for school leadership. The total number of valid votes polled was 720.
Observe the chart and answer the questions based on it.
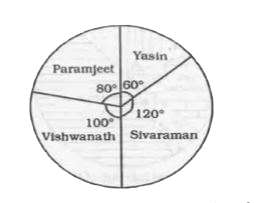
By how many votes did the winner defeat his nearest rival ?
View SolutionThe given pie chart shows the marks obtained in an examination by a student (in degree). Observe the pie chart and answer the question that follows.
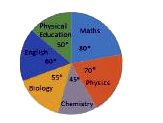
If the total marks are 720, then the marks obtained in Mathematics are:
View SolutionThis is a pie-chart for the data on A, B, O, AB blood groups of 150 donors. Observe the pie-chart and answer the questions.
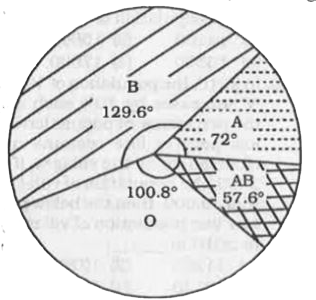
The number of donor having blood group 'O' is :
View Solution

