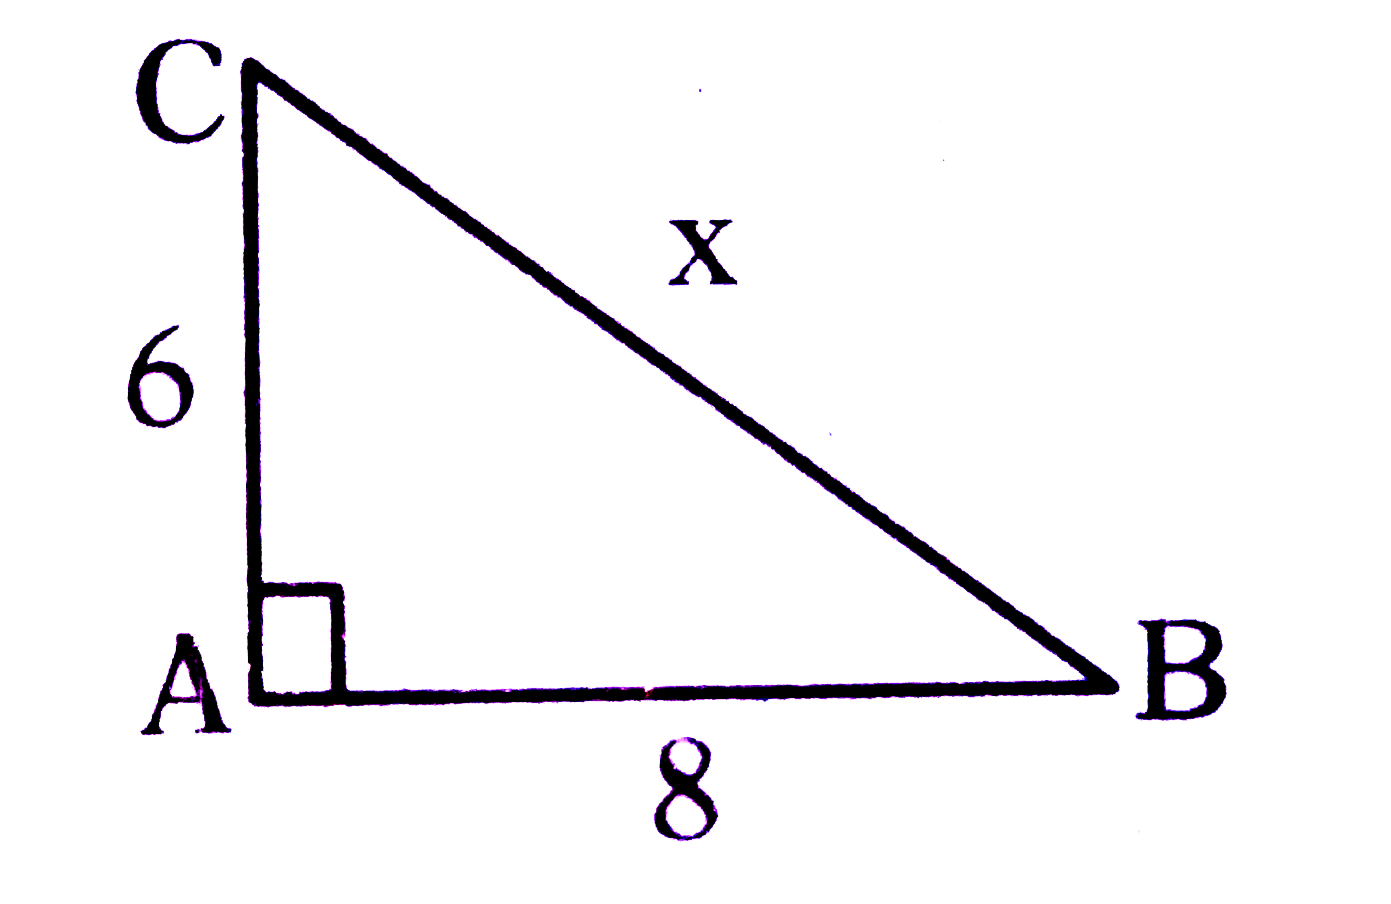
From the figure, x=…
 Solution in Telugu
7
3
10
none
The correct Answer is:C
Step by step video, text & image solution for From the figure, x=… by Maths experts to help you in doubts & scoring excellent marks in Class 10 exams.
Updated on:21/07/2023Topper's Solved these Questions
- QUADRATIC EQUATIONSBook:VGS PUBLICATION-BRILLIANTChapter:QUADRATIC EQUATIONSExercise:EXERCISE
Explore 270 Videos
- QUADRATIC EQUATIONSBook:VGS PUBLICATION-BRILLIANTChapter:QUADRATIC EQUATIONSExercise:OBSERVATION BITS TO SOLVE VARIOUS BITS GIVEN IN THE PUBLIC EXAMINATION
Explore 30 Videos
- PROGRESSIONS (MULTIPLE CHOICE QUESTION)Book:VGS PUBLICATION-BRILLIANTChapter:PROGRESSIONS (MULTIPLE CHOICE QUESTION)Exercise:PROGRESSIONS (MULTIPLE CHOICE QUESTION)
Explore 20 Videos
- QUADRATIC EQUATIONS (MULTIPLE CHOICE QUESTION)Book:VGS PUBLICATION-BRILLIANTChapter:QUADRATIC EQUATIONS (MULTIPLE CHOICE QUESTION)Exercise:QUADRATIC EQUATIONS (MULTIPLE CHOICE QUESTION)
Explore 20 Videos
Similar Questions
Check whether the following equations are quadratic or not.
x2−6x−4=0
View SolutionThe general form of a quadratic equation in variable x is……
View SolutionA circle with area A, is contained in the interior of a larger with area A1+A2. IF the radius of the larger circle is 3 units and A1,A2 and (A1+A2) are in A.P., then find the radius of smaller circle…..
View Solution2x2+3x−1=0 is a quadratic equation the roots are α,β then α2+β2=……….
View SolutionHow many lines of symmetry does the above figure have ?
View SolutionDetermine the point of symmetry of a regular hexagon.
View SolutionDtermine the images of the following figure about the given line :
View SolutionMatch the following Column A to Column B

View SolutionMatch the following Column A to Column B

View SolutionMatch the following Column A to Column B

View SolutionFind the area of the figure given below.

View SolutionThe area of the shaded part in the figure given below is ______.

View SolutionThe inequation represented by the graph given below is :
View SolutionThe inequation that best describes the graph given below is _________
View SolutionThe inequation that best describes the following graph is _________
View SolutionWhich inequations represent the shaded region in the given figure
View Solution