The acceleration-time graph of a particle starting from rest is given in. Draw the corresponding velocity-time graph and hence find out the displacement in 6s.

Text Solution
In the intervals (0 →1), (2→3), and (4→5) seconds, acceleration is zero, i.e., velocity = constant. Again in the intervals (1→2), (3→4), and (5→6) seconds the velocity increases uniformly and rises to 1 m/s, 2m/s and 3m/s respectively, because the uniform acceleration in each interval is 1 m/s2.

∴ The velocity-time graph of the motion is ABCDEF Displacement is 6s = area under ABCDEF
= area of 6 unit squares + area of 3 triangles
=6×(1×1)+3×(12×1×1)=7.5 m
|
Topper's Solved these Questions
- ONE - DIMENSIONAL MOTION BOOK - CHHAYA PUBLICATIONCHAPTER - ONE - DIMENSIONAL MOTION EXERCISE - Section Related Questions
17 Videos
- ONE - DIMENSIONAL MOTION BOOK - CHHAYA PUBLICATIONCHAPTER - ONE - DIMENSIONAL MOTION EXERCISE - HIGHER ORDER THINKING SKILL (HOTS) QUESTIONS
35 Videos
- NEWTONIAN GRAVITATION AND PLANETARY MOTIONBOOK - CHHAYA PUBLICATIONCHAPTER - NEWTONIAN GRAVITATION AND PLANETARY MOTIONEXERCISE - CBSE SCANNER
19 Videos
- QUESTION PAPERS OF NEET -2017BOOK - CHHAYA PUBLICATIONCHAPTER - QUESTION PAPERS OF NEET -2017EXERCISE - QUESTION
32 Videos
Similar Questions
Knowledge Check
The graph of displacement v/s time is given below. Its corresponding velocity-time graph will be :
 A
A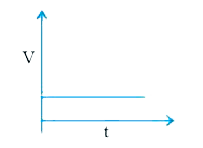 B
B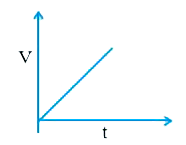 C
C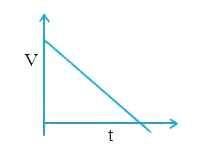 D
D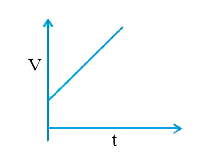
Accleration vs time graph of a particle starting from rest is given. Find the displacement of particle in first 2 seconds.
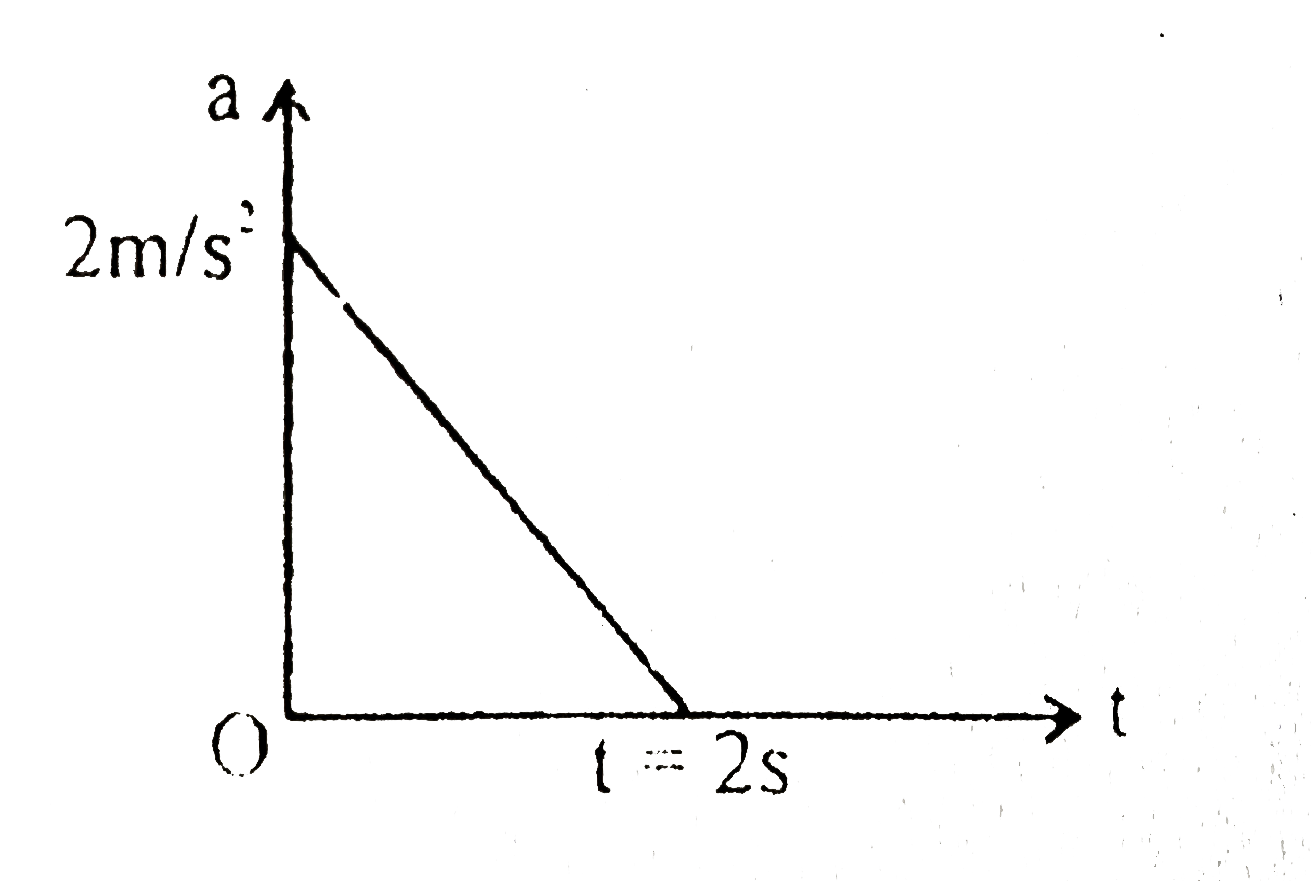 A38B83C43D316
Figure shows the acceleration-time graphs of a particle. Which of the following represents the corresponding velocity -time graph?
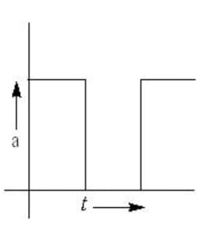 A
A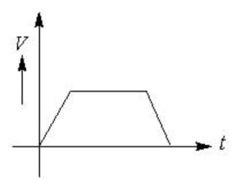 B
B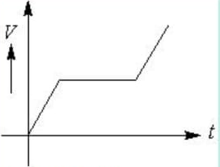 C
C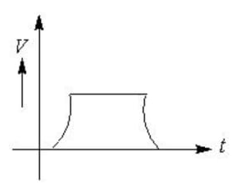 D
D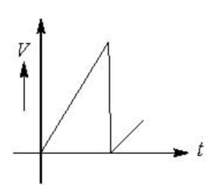
2.The velocity-time (v-t) graph for a particle in straight line motion is given below the corresponding acceleration time graph will be?
View SolutionThe displacement time graph of a particle executing S.H.M as shown in the figure.
 The corresponding force-time graph of the partical will be
View SolutionThe graph of displacement versus time is shown. Its corresponding velocity-time graph will be.
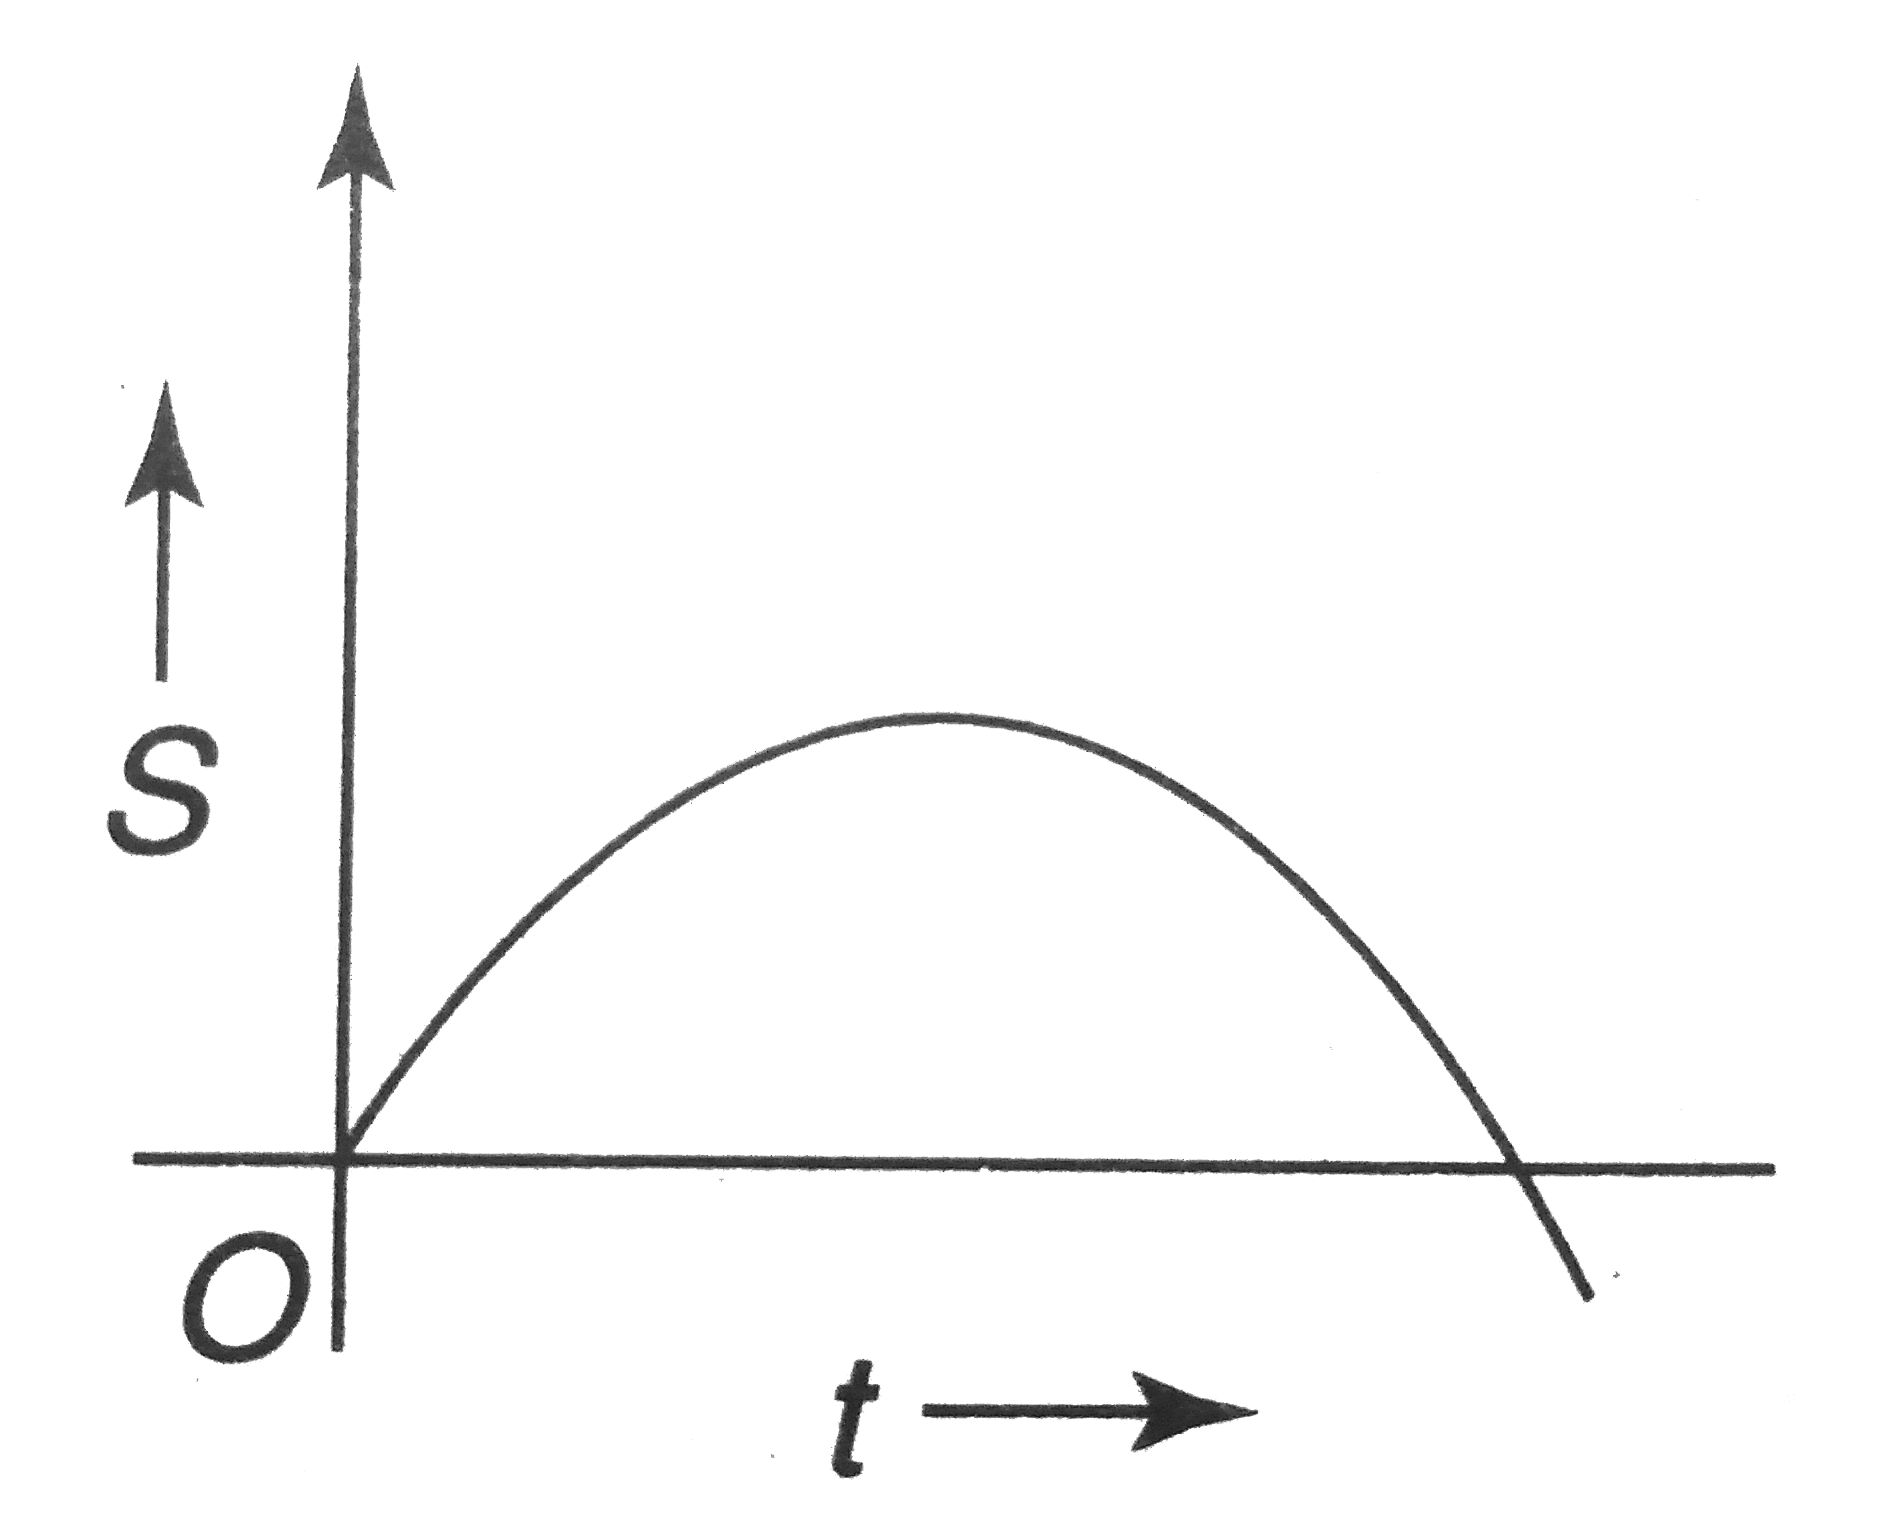
View SolutionDisplacement-time graph of a particle executing SHM is as shown
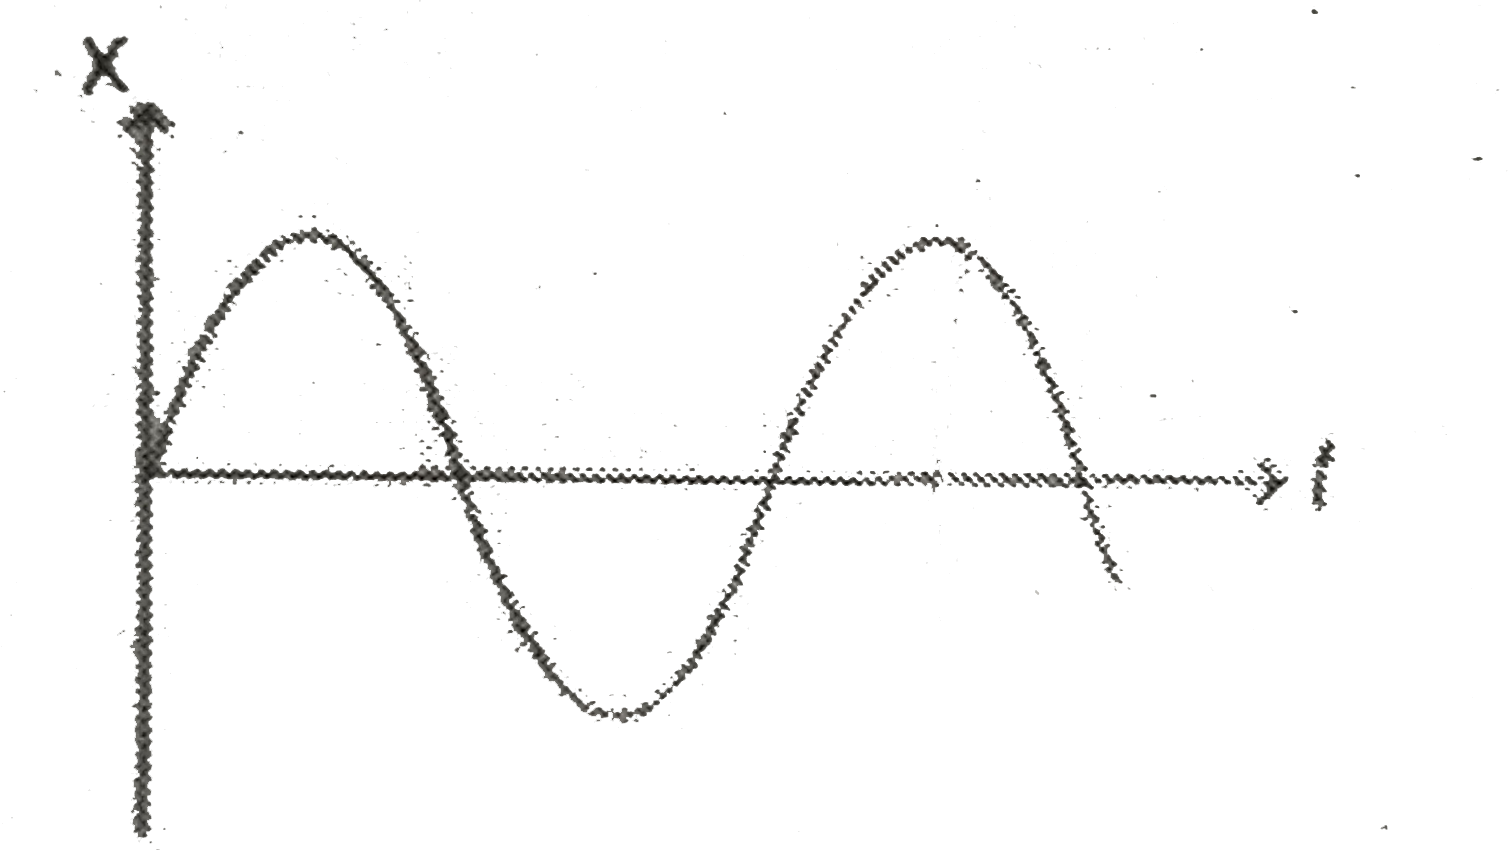
The corresponding force-time graph of the particle can be
View SolutionThe displacement time graph of a particle executing S.H.M. is as shown in the figure
The corresponding force-time graph of the particle is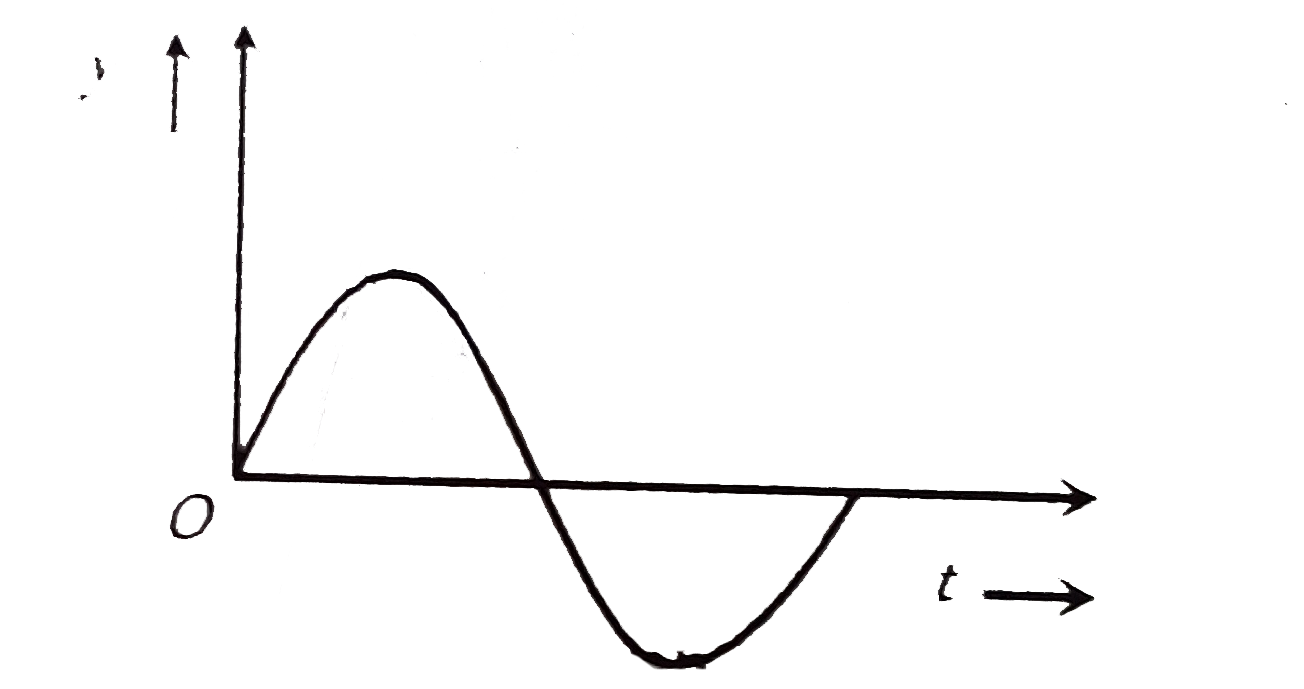
View Solution
