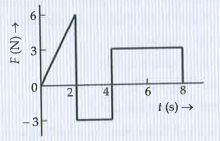
The force F acting on a particle of mass m is indicated by the force-time graph shown below. The change in momentum of the particle over the time interval from zero to 8 s is

24 N.s
20 N.s
12 N.s
6 N.s
F = ma = mdvdt
∴ P=∫mdv=∫Fdt
So, momentum is the total area of the force-time graph.
Therefore, change in momentum,
ΔP=(12×6×2)−(3×2)+(3×4)
= (6 - 6 + 12) = 12N.s
The option C is correct.
Topper's Solved these Questions
- NEWTON'S LAWS OF MOTIONBOOK - CHHAYA PUBLICATIONCHAPTER - NEWTON'S LAWS OF MOTIONEXERCISE - EXAMINATION ARCHIVE WITH SOLUTIONS (NEET)
3 Videos
- NEWTON'S LAWS OF MOTIONBOOK - CHHAYA PUBLICATIONCHAPTER - NEWTON'S LAWS OF MOTIONEXERCISE - CBSE SCANNER
24 Videos
- NEWTON'S LAWS OF MOTIONBOOK - CHHAYA PUBLICATIONCHAPTER - NEWTON'S LAWS OF MOTIONEXERCISE - EXAMINATION ARCHIVE WITH SOLUTIONS (WBJEE)
5 Videos
- NATURE OF VIBRATIONBOOK - CHHAYA PUBLICATIONCHAPTER - NATURE OF VIBRATIONEXERCISE - EXERCISE (CBSE SCANNER)
2 Videos
- NEWTONIAN GRAVITATION AND PLANETARY MOTIONBOOK - CHHAYA PUBLICATIONCHAPTER - NEWTONIAN GRAVITATION AND PLANETARY MOTIONEXERCISE - CBSE SCANNER
19 Videos
Similar Questions
The force F acting on a particle of mass mis indicated by the force-time graph shown below. The change in momentum of the particle over the time interval from zero to 8 s is
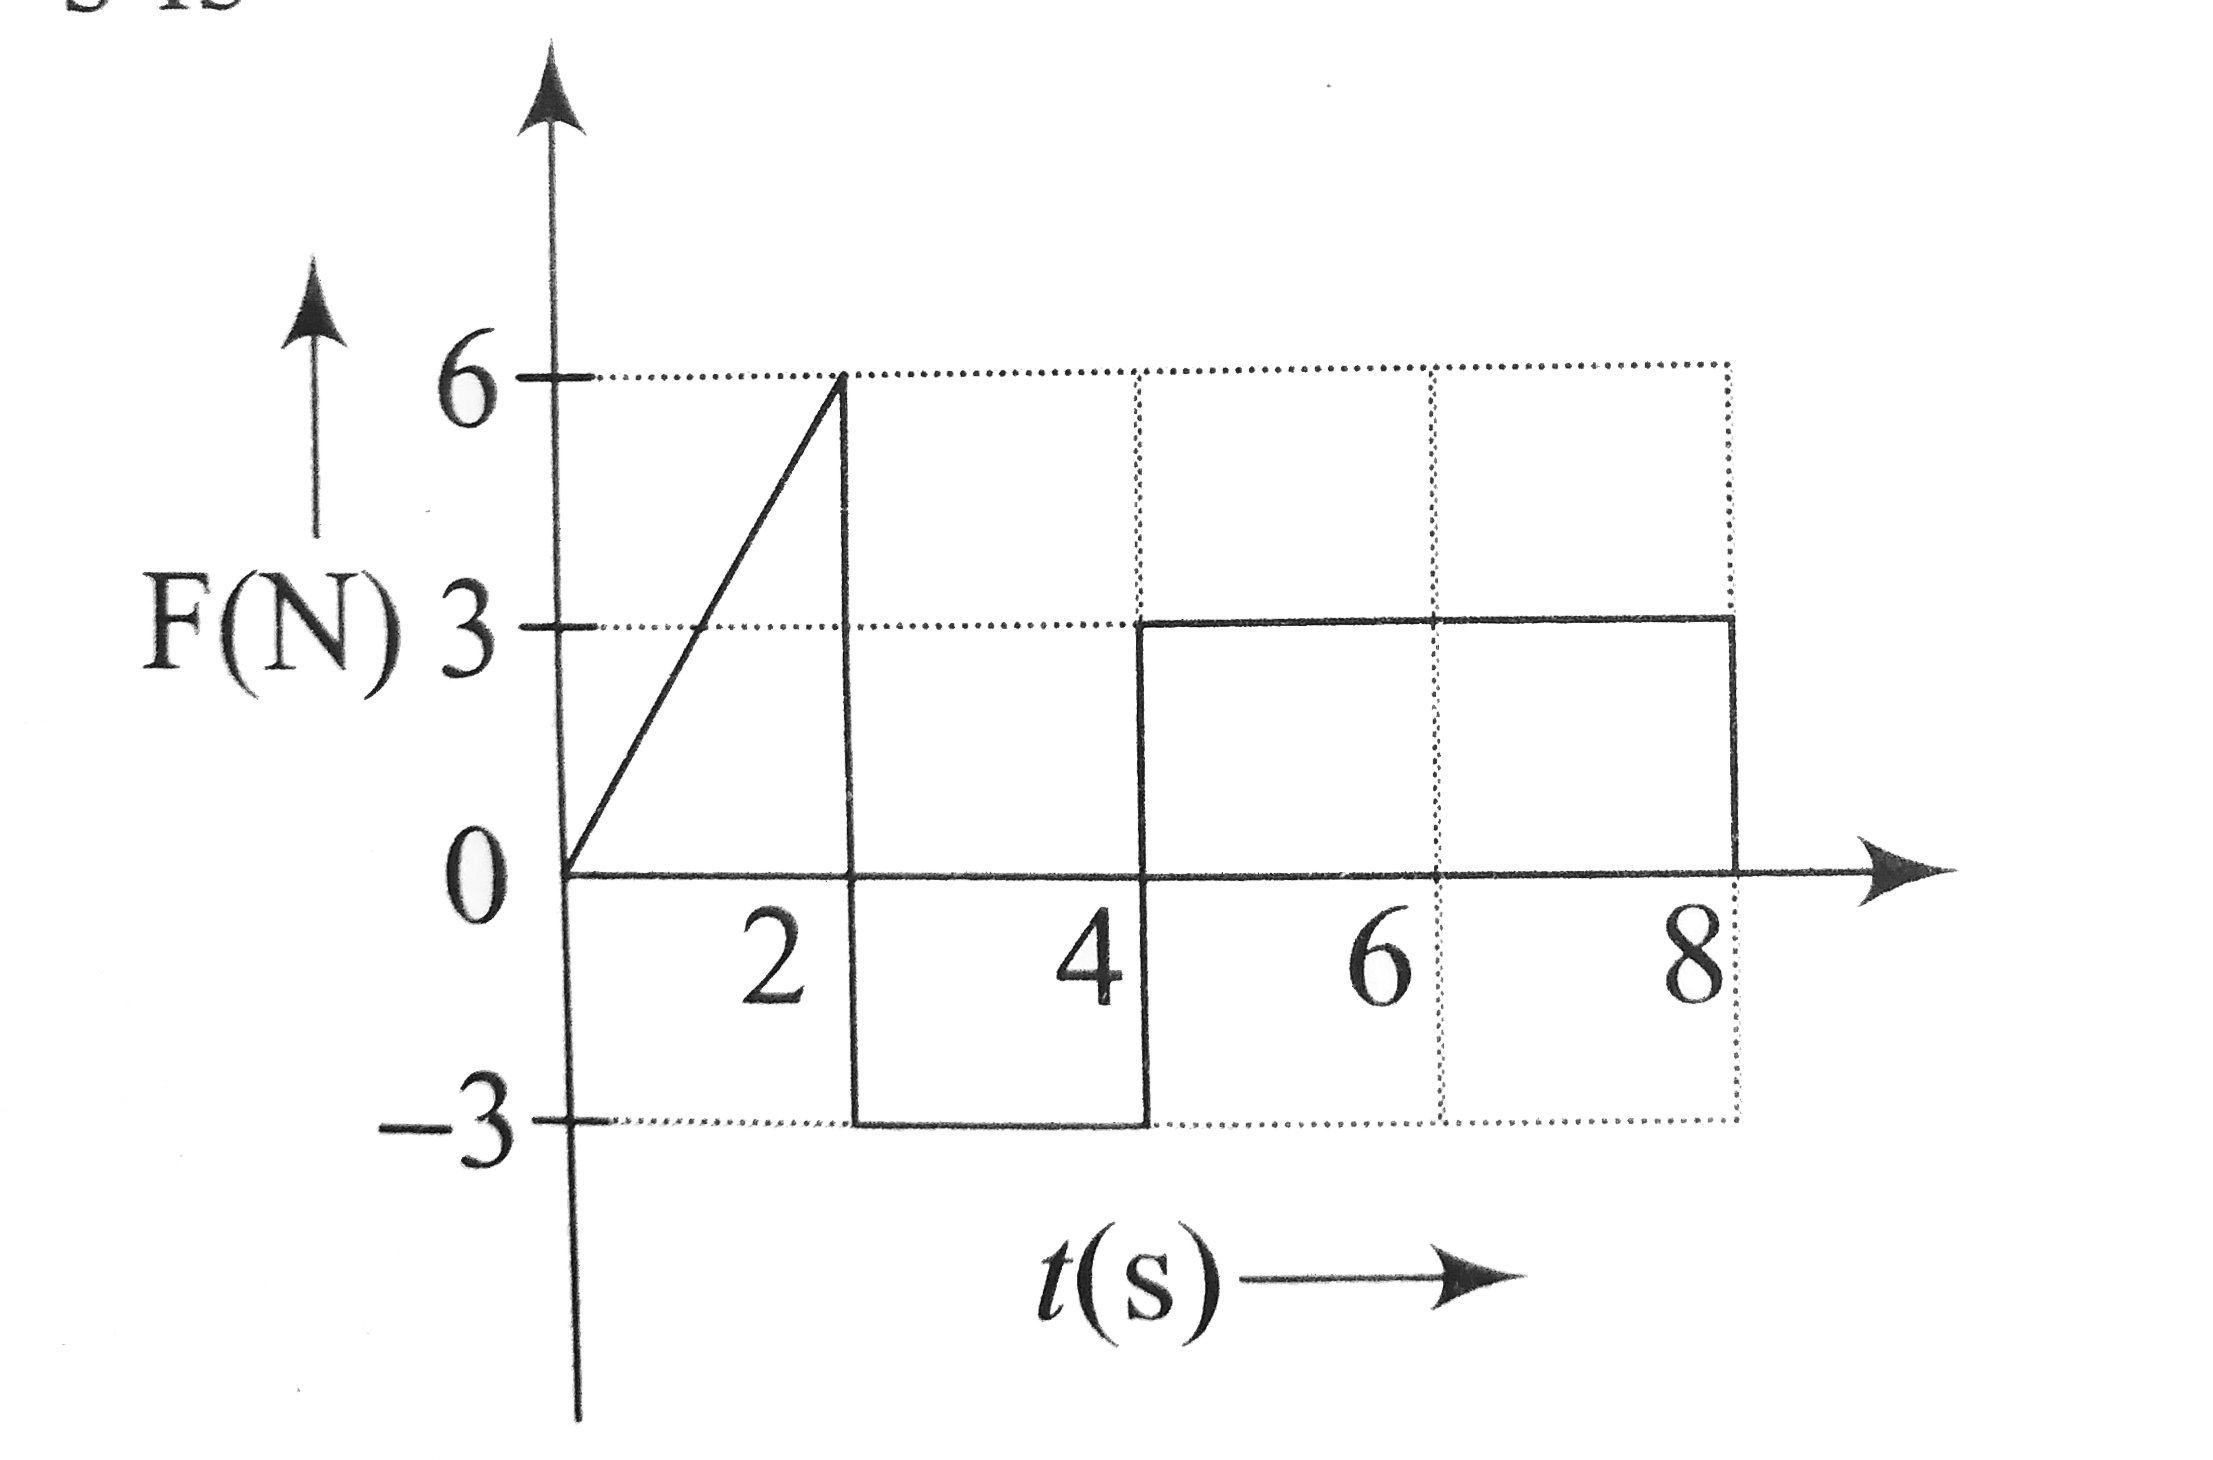
View SolutionThe force F acting on a partical of mass m is indicated by the force-time graph shown below. The change in momentum of the particle over time interval from zero to 8 s is.
View Solution
Knowledge Check
The force F acting on a particle of mass m is indicated by the force-time graph shown below. The change in momentum of the particle over time interval from zero to 8 s is.
 A24NsB20NsC12NsD6Ns
The force F acting on a particle of mass mis indicated by the force-time graph shown below. The change in momentum of the particle over the time interval from zero to 8 s is
 A24 NsB20 NsC12 NsD6 Ns
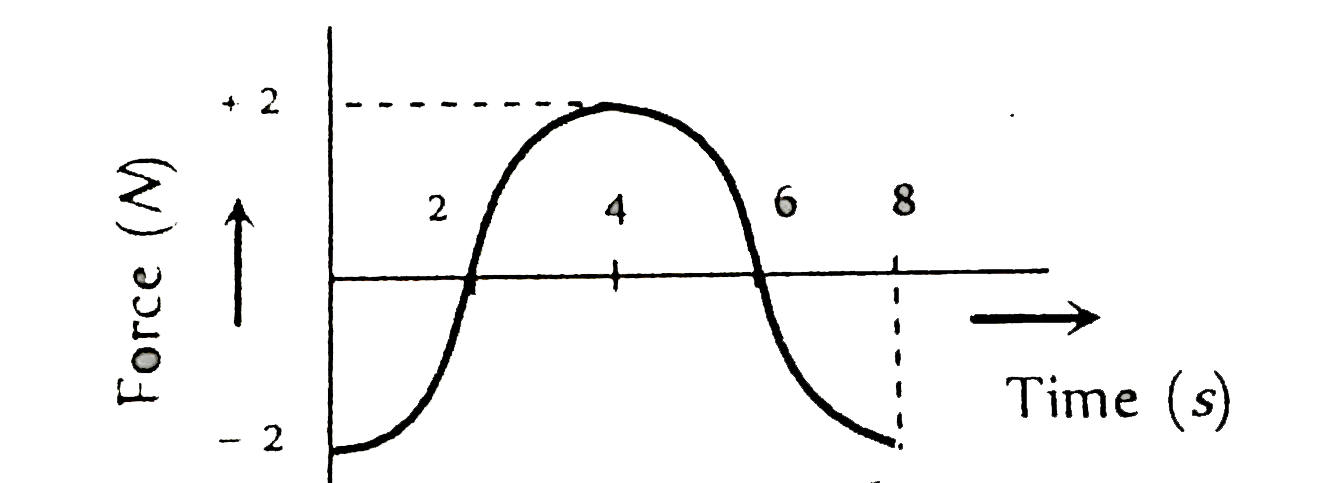
The force-time(F–t) curve of a particle executing linear motion is as shown in the figure. The momentum acquired by the particle in time interval from zero to 8 second will be
 A−2 N-sB+4 N-sC6 N-sDZero
The force acting on a particle of mass 20 kg is indicated by force - time graph as shown in figure. The magnitude of change in linear momentum of particle during time interval 0 to 6 second is
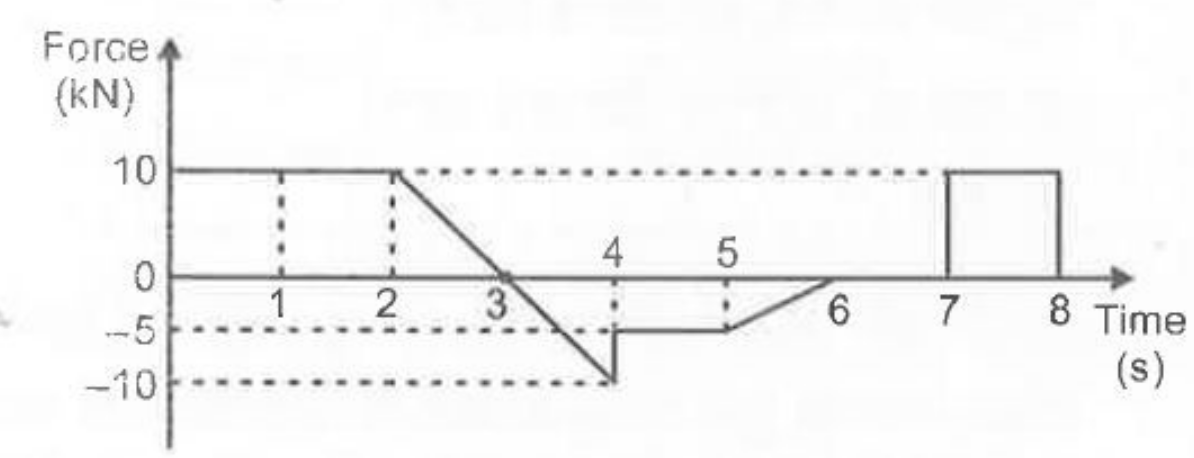
View SolutionThe force acting on a particle of mass 20 kg is indicated by force - time graph as shown in figure. The magnitude of change in linear momentum of particle during time interval 0 to 6 second is

View SolutionThe force(F) acting on a particle of mass m changing with time(t) is as shown in (F−t) graph. The change in linear momentum from t=0 to t=6 s (in kN s) is

View SolutionThe figure showns the force versus time graph for a particle.
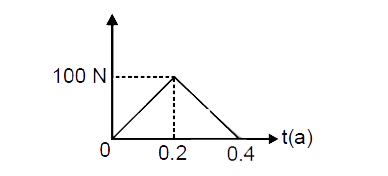
Find the change in momentum Δp of the particle
View SolutionThe variation of force (F) acting on a particle of mass 800 g with position (x) is as shown in figure. The time period of oscillation of the particles is
View Solution
