Graphs below show the variation of the frictional force against the force on a block applied parallel to the surface of contact of the block with a rough horizontal plane. Out of A, B, C,D which one is the correct graph?


The correct Answer is:B
Topper's Solved these Questions
- FRICTION BOOK - CHHAYA PUBLICATIONCHAPTER - FRICTION EXERCISE - EXERCISE (Based on Motion on inclined Surface )
7 Videos
- FRICTION BOOK - CHHAYA PUBLICATIONCHAPTER - FRICTION EXERCISE - Very Short Answer Type Questions (Based on Fundamentals of Friction)
6 Videos
- FRICTION BOOK - CHHAYA PUBLICATIONCHAPTER - FRICTION EXERCISE - HIGHER ORDER THINKING SKILL ( HOTS ) QUESTIONS
14 Videos
- FIRST AND SECOND LAW OF THERMODYNAMICSBOOK - CHHAYA PUBLICATIONCHAPTER - FIRST AND SECOND LAW OF THERMODYNAMICSEXERCISE - CBSE SCANNER
18 Videos
- HYDROSTATICSBOOK - CHHAYA PUBLICATIONCHAPTER - HYDROSTATICSEXERCISE - CBSE SCANNER
1 Videos
Similar Questions
A block is sliding on a rough horizontal surface. If the contact force on the block is √2 times the frictional force, the coefficient of friction is
View SolutionA block placed on a rough horizontal surface is pulled by a horizontal force F Let f be the force applied by the rough surface on the block . Plot a graph of f versus F .
View Solution
Knowledge Check
A block is sliding on a rough horizontal surface. If the contact force on the block is √2 times the frictional force, the coefficient of friction is
A0.25B1√2C√2D1A block is placed on a rough floor and a horizontal force F is applied on it.The force of friction f by the bloor on the block is measured for different values of F and a graph is plotted between them.
AThe graph is a straight line of slope 450BThe graph is a straight line parallel to the F-axisCThe graph is a straigtline of slope 450 for small F anda straight line parallel to the F-axis for large F.DThere is a small kink on the graphA block of mass m is pulled by a force of constant power P placed on a rough horizontal plane. The friction coefficient between the block and the surface is μ. Then
AThe maximum velocity of the block during the motion is PμmgBThe maximum velocity of the block during the motion is P2μmgCThe block's speed is never decreasing and finally becomes constantDThe speed of the block first increases to a maximum value and then decreases
A block placed on a rough horizontal surface is pulled by a horizontal force F Let f be the force applied by the rough surface on the block . Plot a graph of f versus F .
View SolutionA block placed on a rough horizontal surface is pulled by a horizontal force F Let f be the force applied by the rough surface on the block . Plot a graph of f versus F .
View SolutionA block of mass m is pulled by a force of constant power P placed on a rough horizontal plane. The friction coefficient between the block and the surface is μ. Then
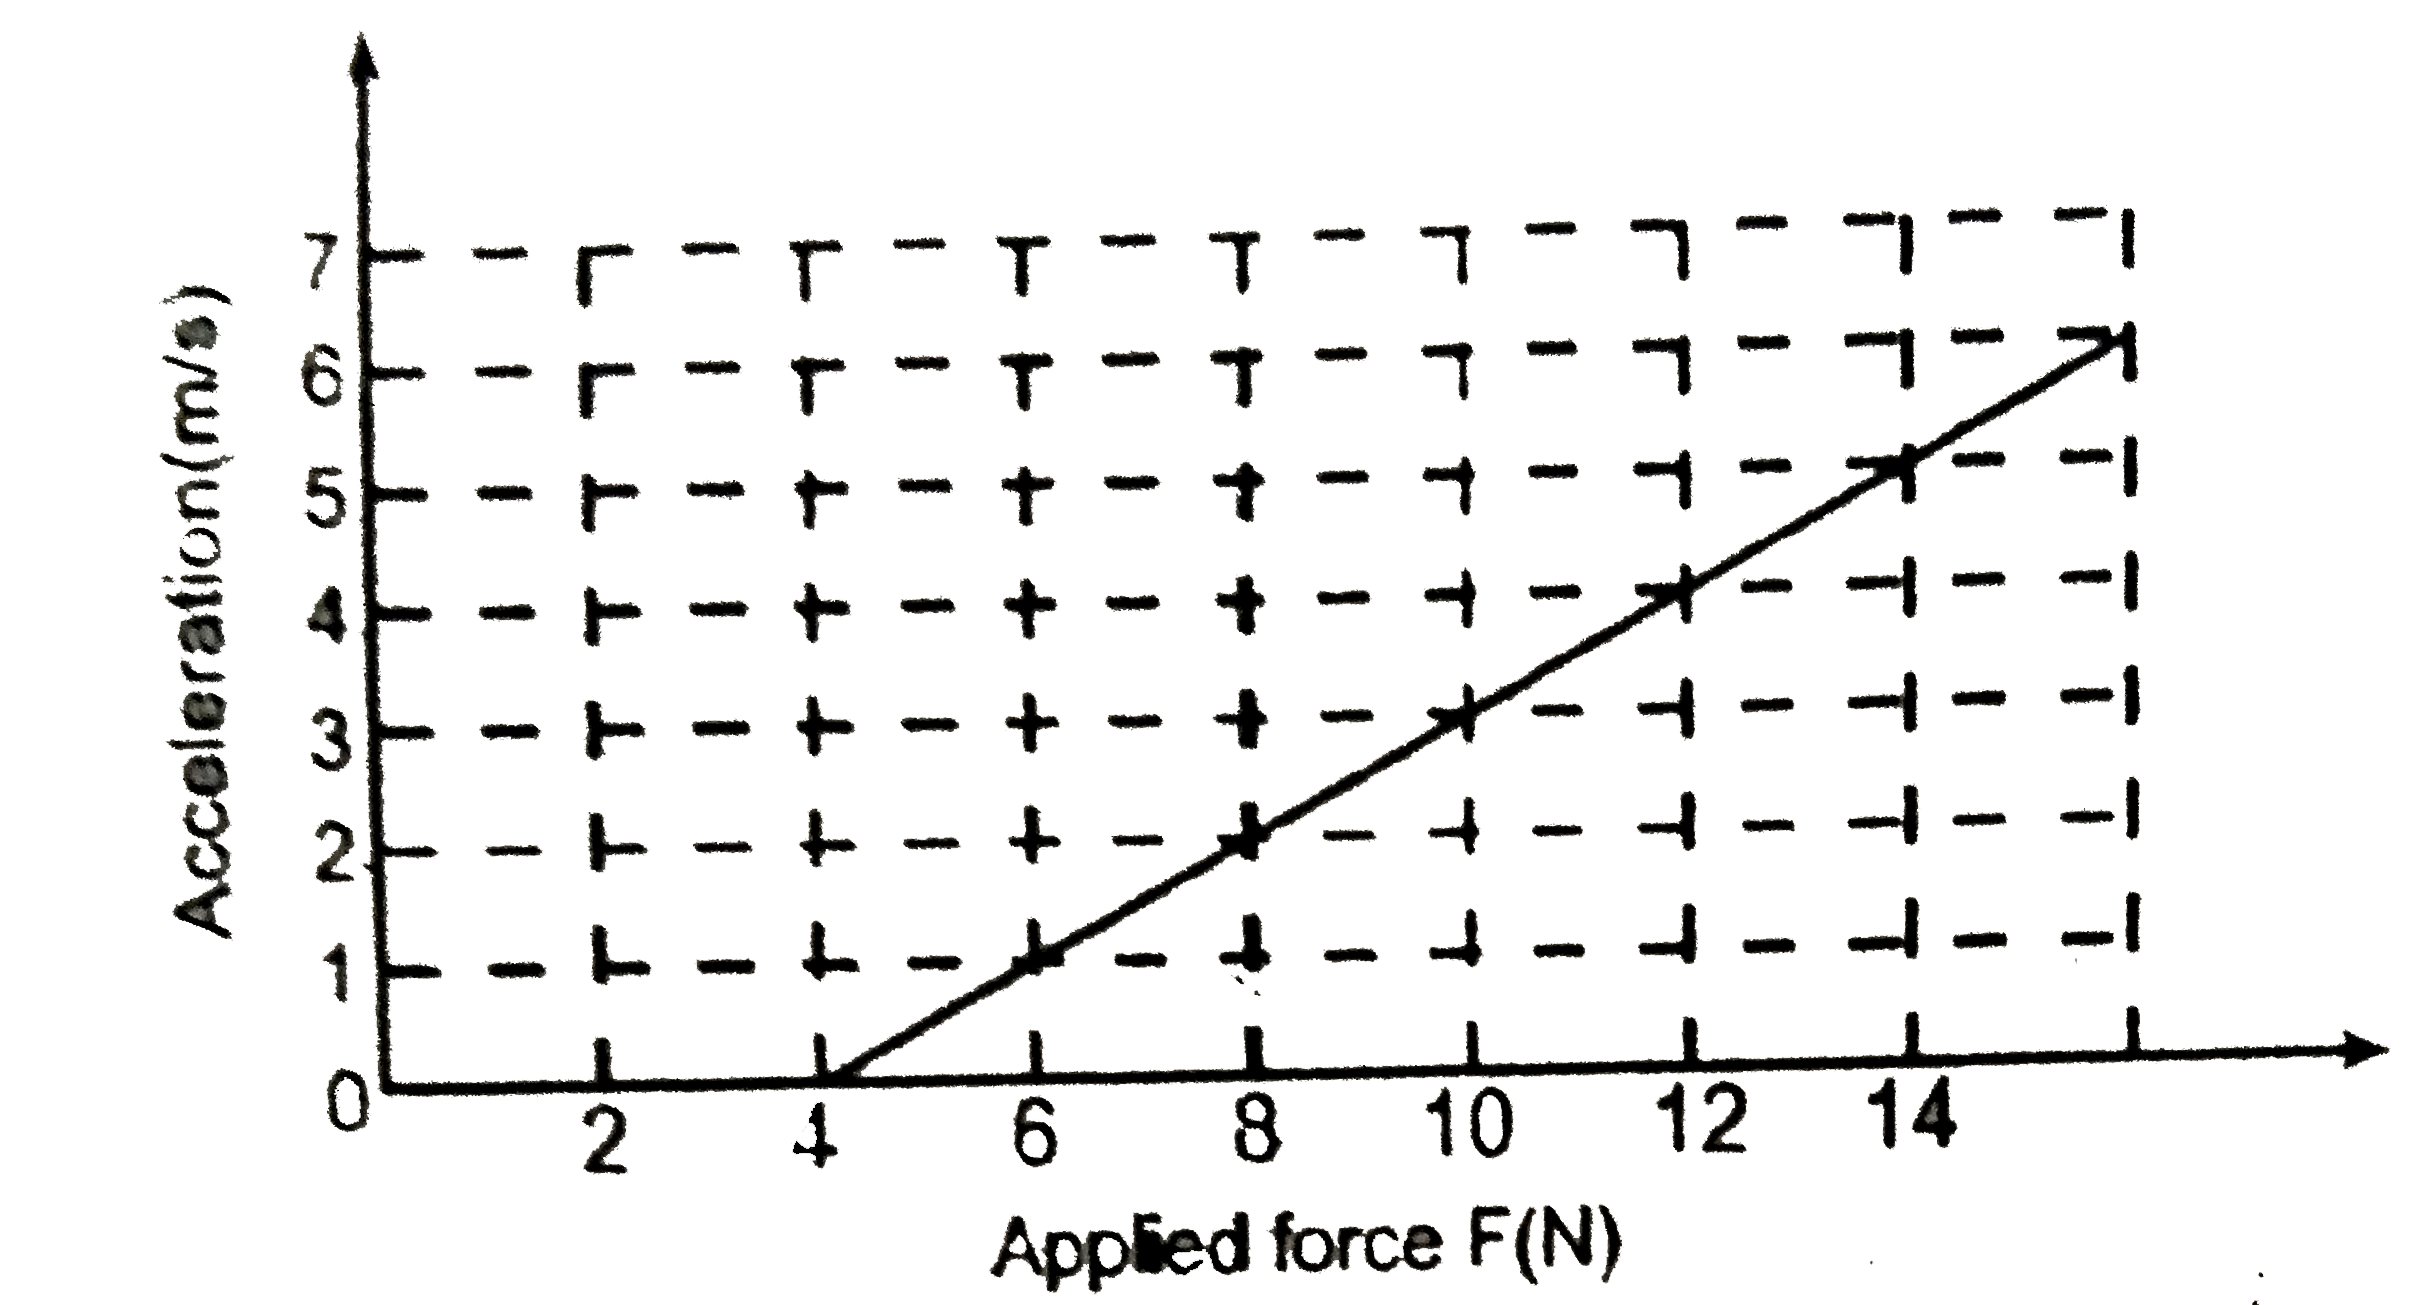
View SolutionA block of unknown mass is at rest on a rough, horizontal surface. A horizontal force F is applied to the block. The graph in the figure shows the acceleration of the block with respect to the applied force. The mass of the block is

View SolutionA block of unknown mass is at rest on a rough, horizontal surface. A horizontal force F is applied to the block. The graph in the figure shows the acceleration of the block with respect to the applied force. The mass of the block is

View Solution
