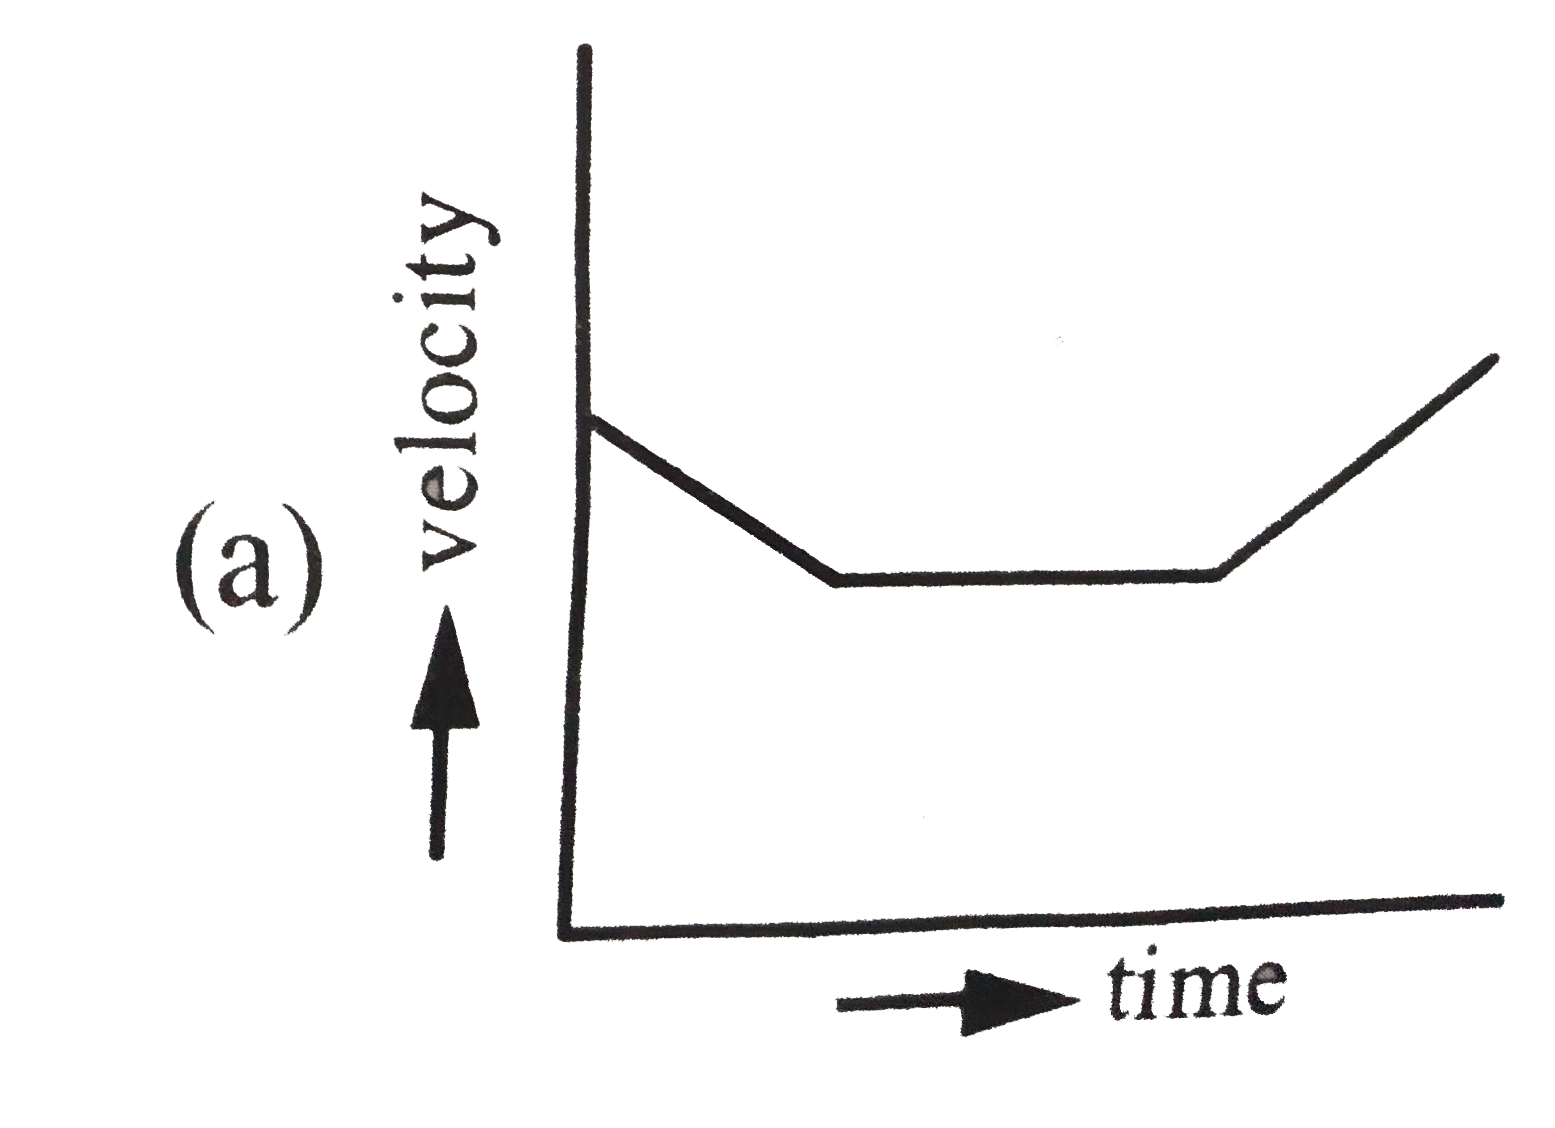
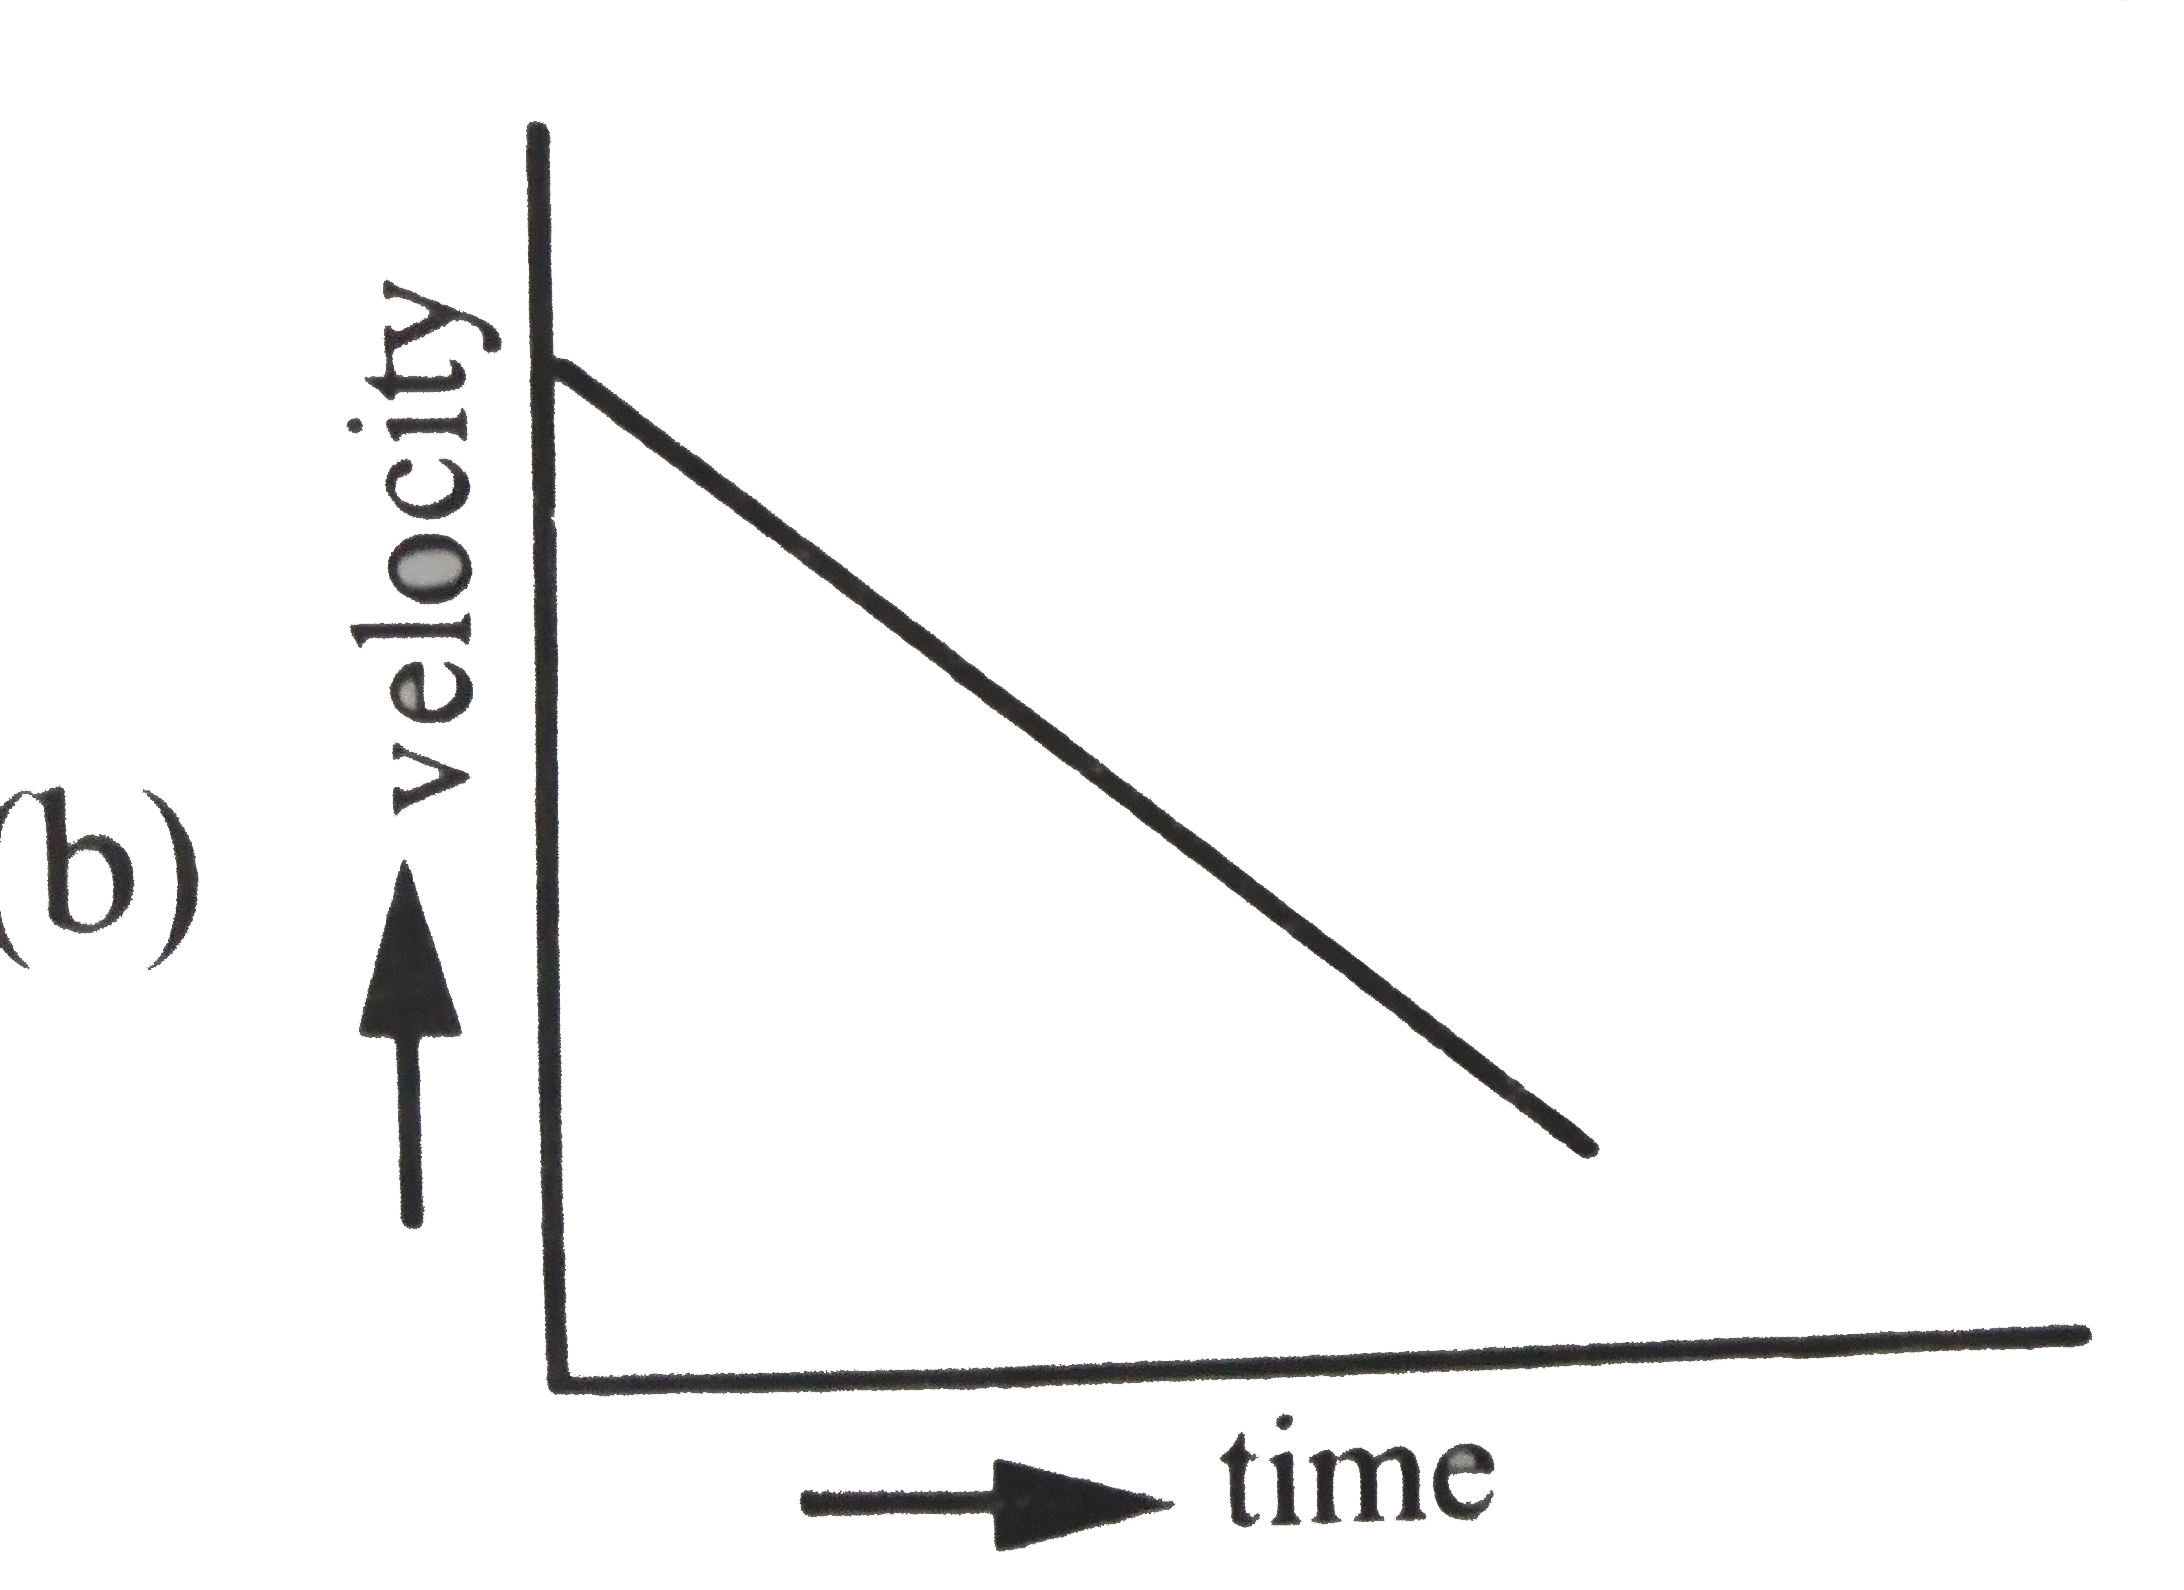
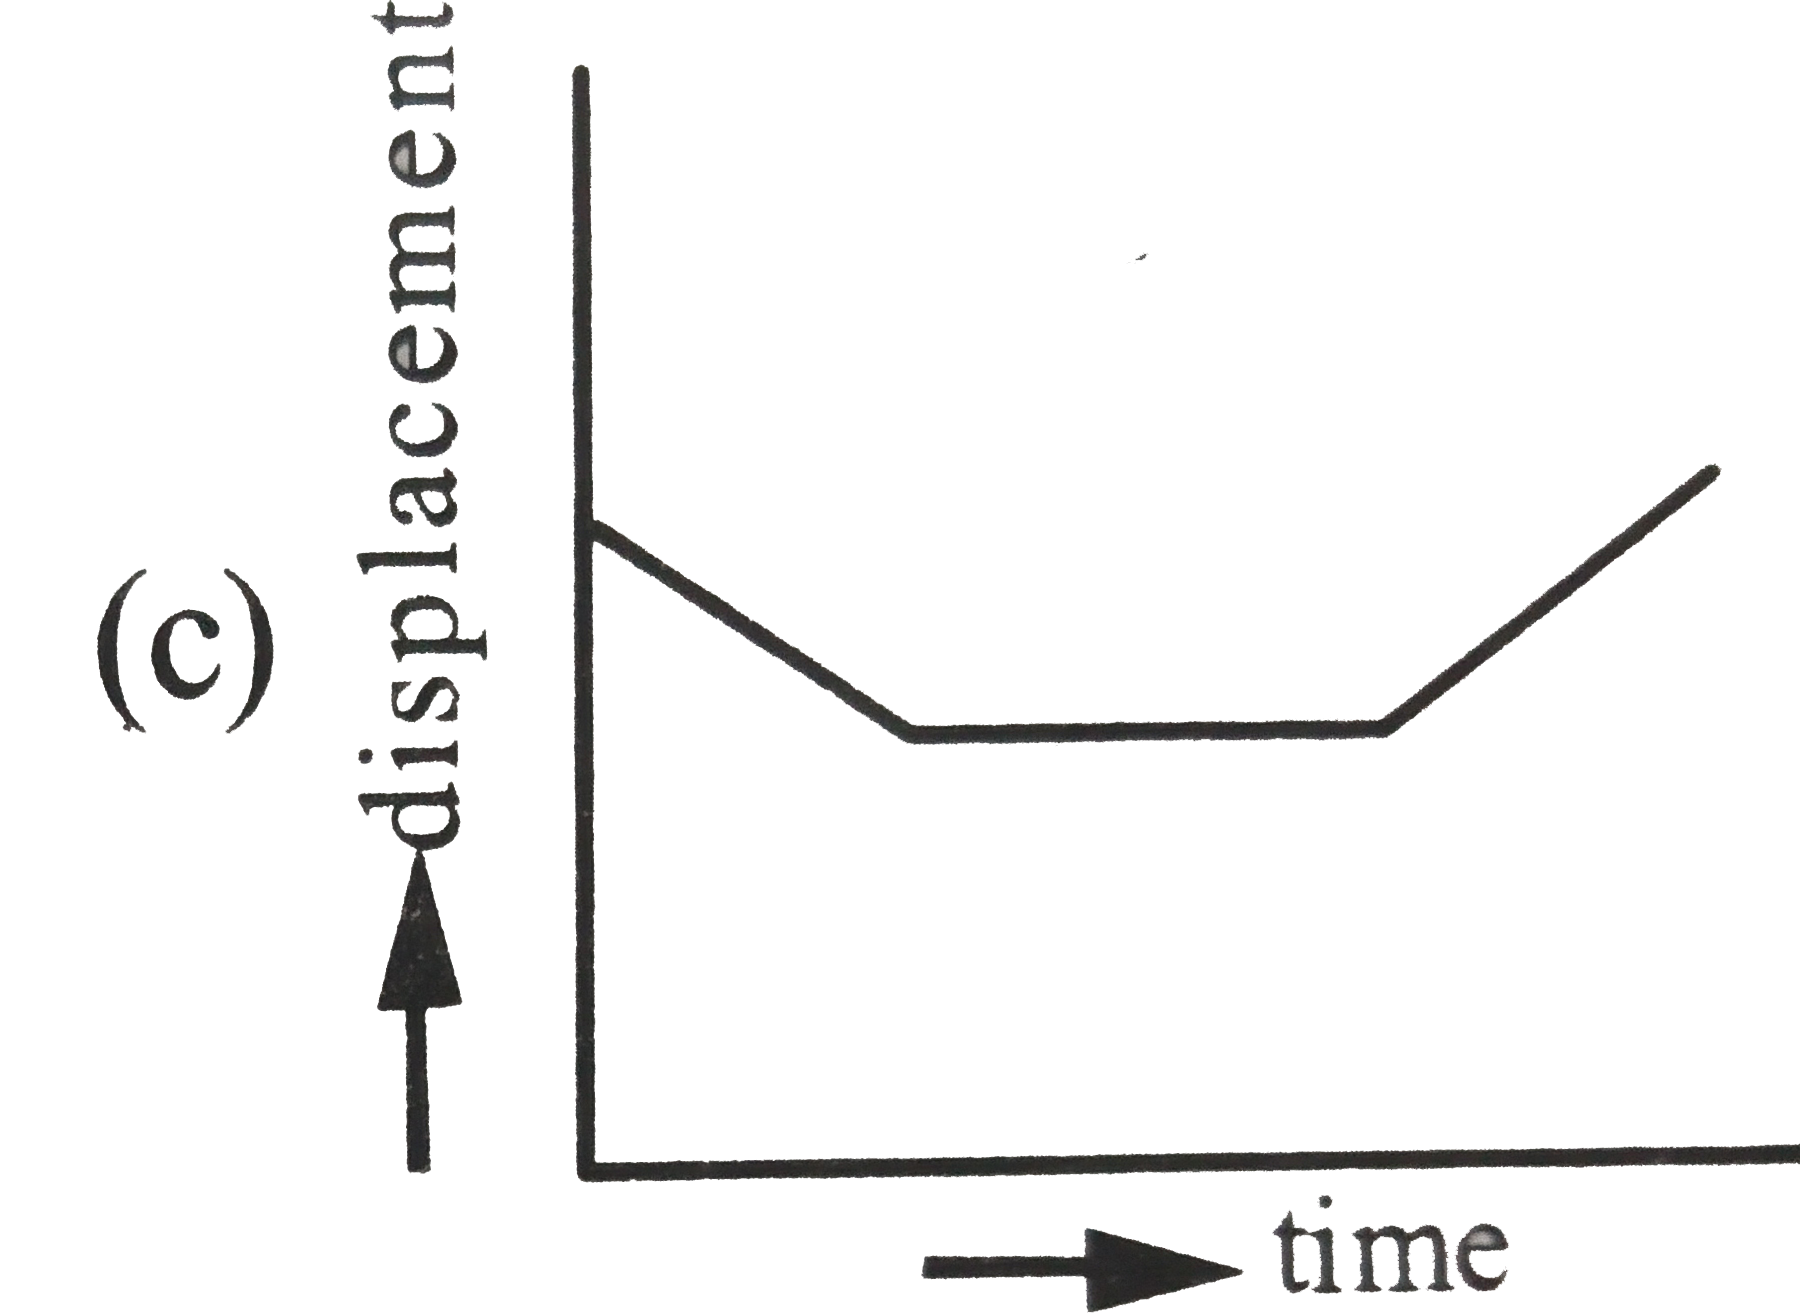
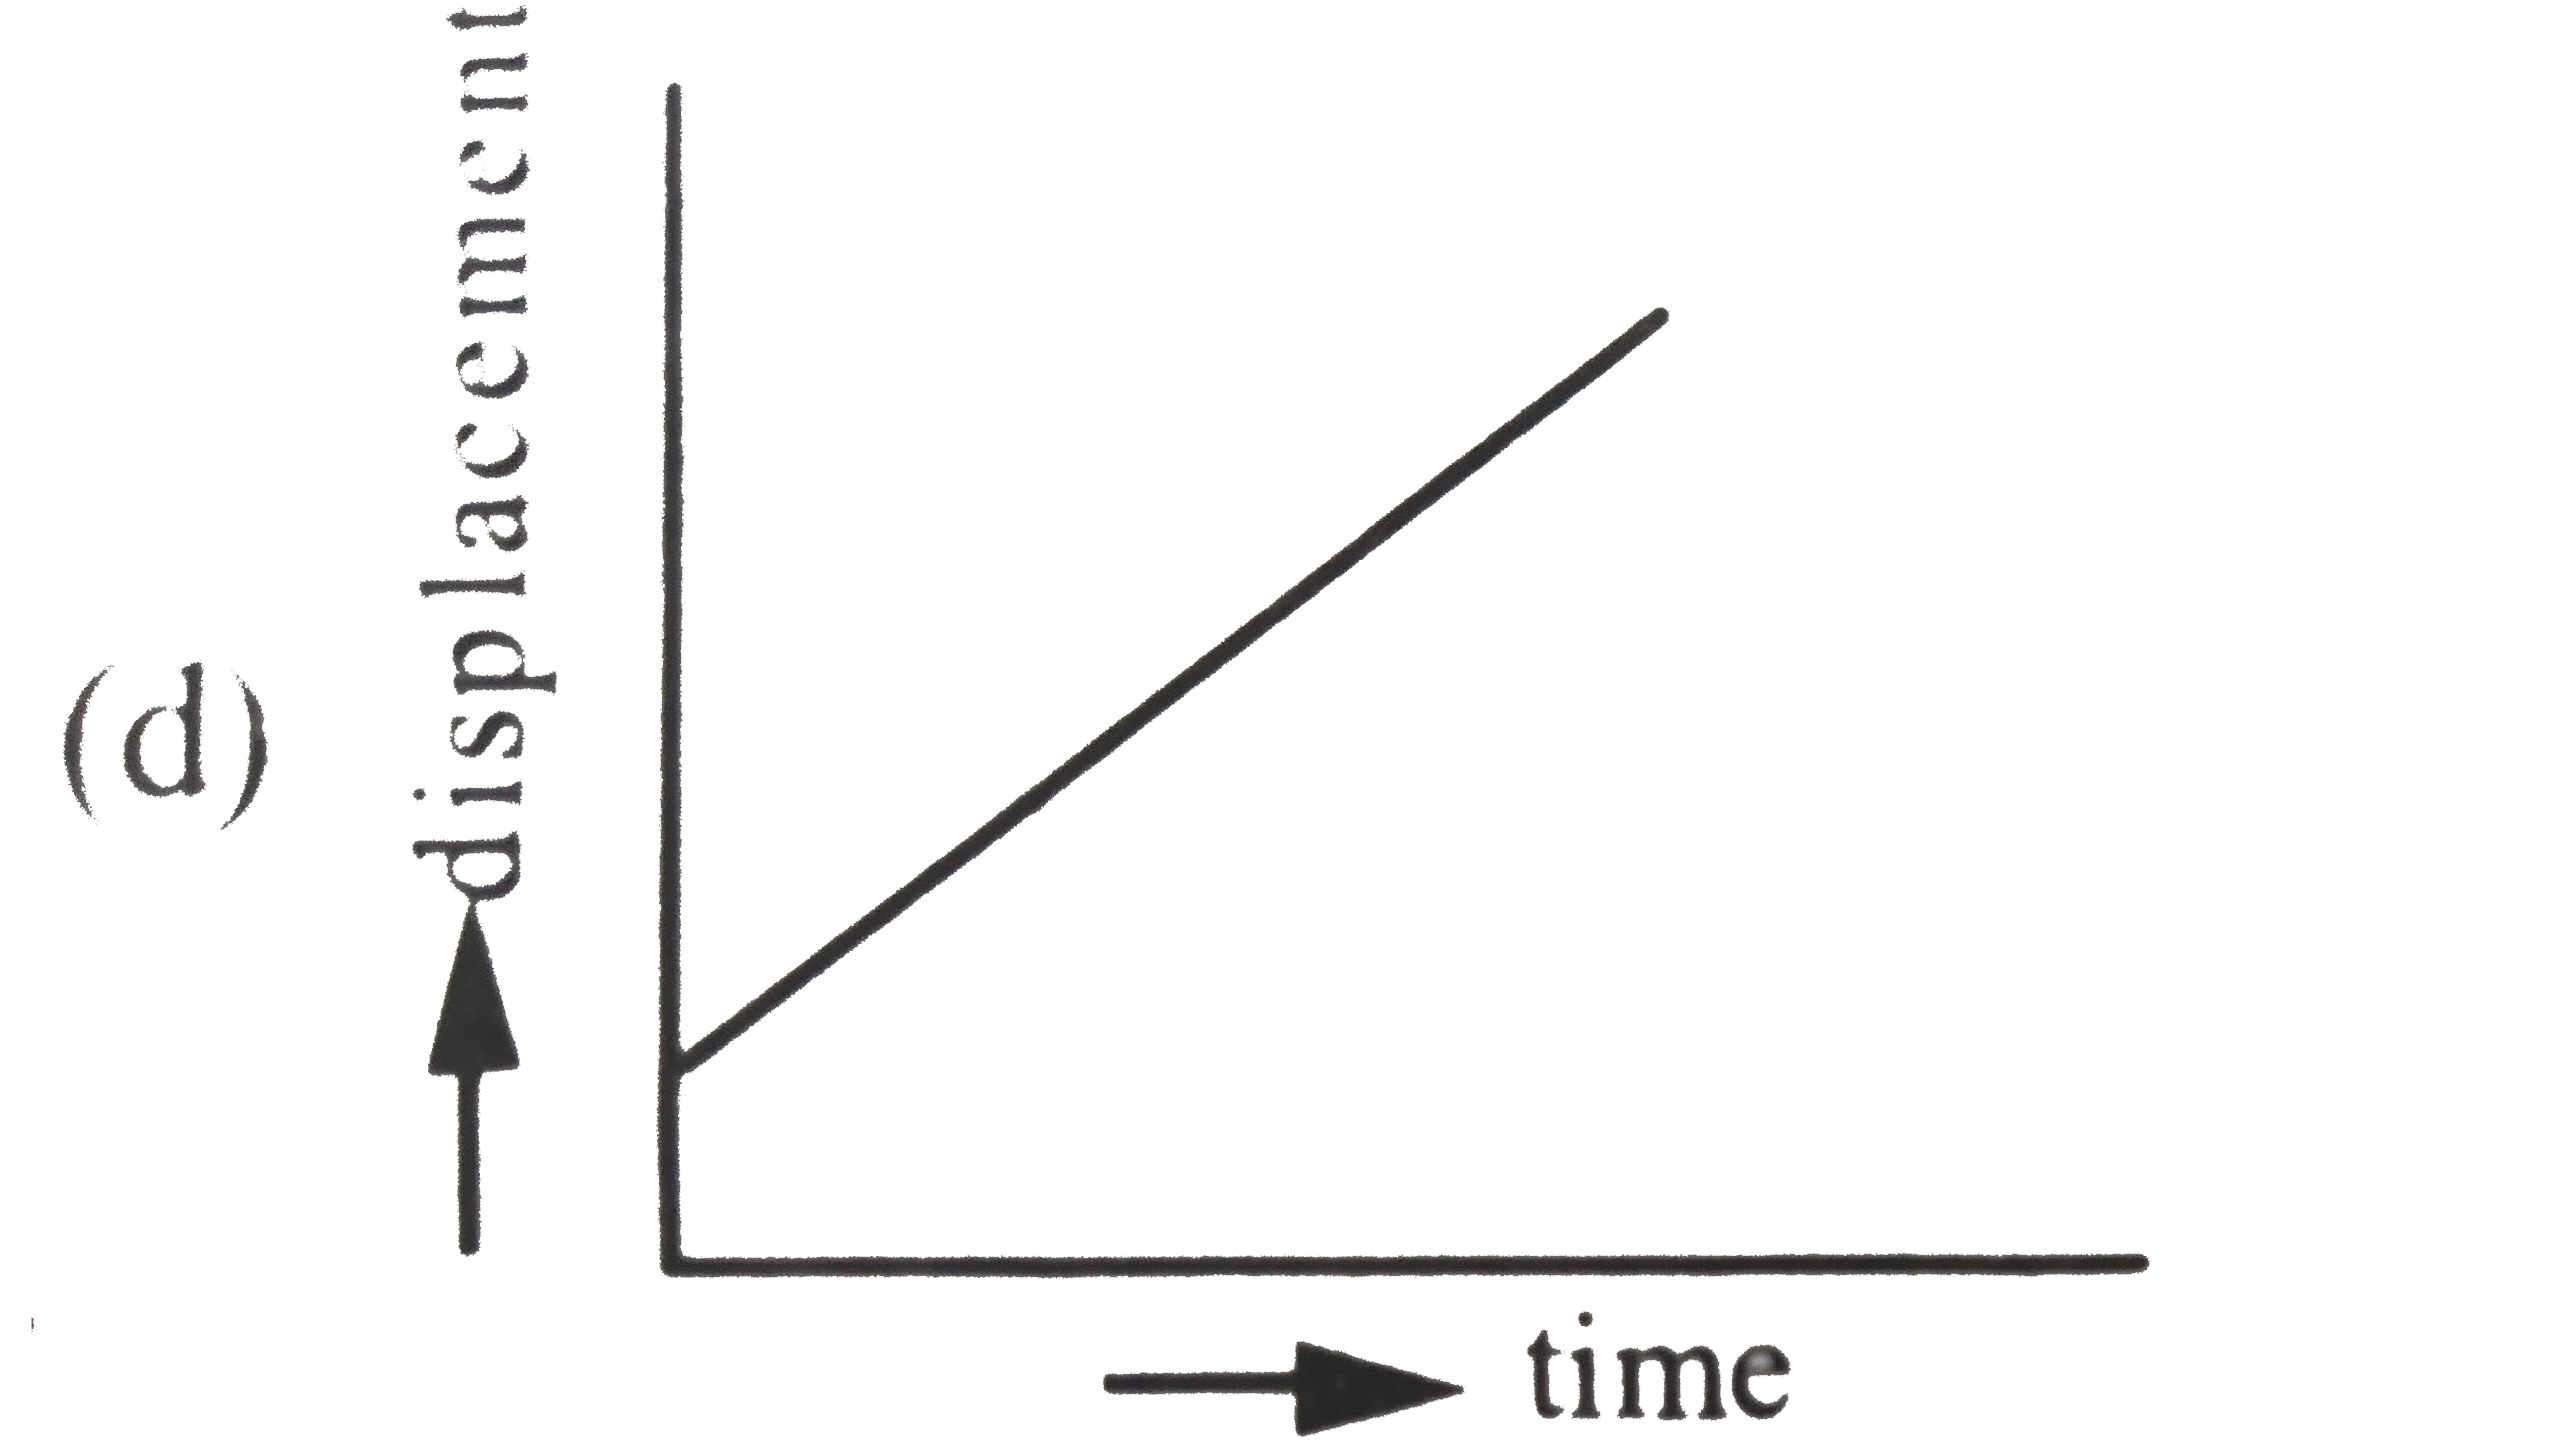
Which one of the following graphs in Fig. 5.16 correctly represents the change of density of water with temperature?

Text Solution
Graph (a) represents the correct nature of variation of density of water with temperature. The convex nature is due to the anomalous expansion of water. The maximum point corresponds to the maximum density of water at
|
Topper's Solved these Questions
- EXPANSION OF SOLIDS AND LIQUIDSBOOK - CHHAYA PUBLICATIONCHAPTER - EXPANSION OF SOLIDS AND LIQUIDSEXERCISE - EXERCISE - MULTIPLE CHOICE QUESTIONS
44 Videos
- EXPANSION OF SOLIDS AND LIQUIDSBOOK - CHHAYA PUBLICATIONCHAPTER - EXPANSION OF SOLIDS AND LIQUIDSEXERCISE - EXERCISE - VERY SHORT ANSWER TYPE QUESTIONS
18 Videos
- EXPANSION OF SOLIDS AND LIQUIDSBOOK - CHHAYA PUBLICATIONCHAPTER - EXPANSION OF SOLIDS AND LIQUIDSEXERCISE - SECTION RELATED QUESTIONS
6 Videos
- EXPANSION OF GASESBOOK - CHHAYA PUBLICATIONCHAPTER - EXPANSION OF GASESEXERCISE - CBSE Scanner
1 Videos
- FIRST AND SECOND LAW OF THERMODYNAMICSBOOK - CHHAYA PUBLICATIONCHAPTER - FIRST AND SECOND LAW OF THERMODYNAMICSEXERCISE - CBSE SCANNER
18 Videos
Similar Questions
Knowledge Check
Which one of the following structures is correctly represented.
A B
B C
C D
D
Which one of the following graphs represents the variation of surface tension of water with temperture for a small range of temperature ?
A B
B C
C D
D
Which one of the following graphs represents motion?
A B
B C
C D
D
Which of the following graph is correctly represented?
View SolutionWhich one of the following graphs correctly gives the ideal gas behaviour ?
View SolutionWhich of the following graphs represents freundlich adsorption isotherm?
View SolutionWhich of the following correctly represents the increasing order of densities IA group elements?
View SolutionWhich one of the following correctly represents esterification reaction
View Solution
