The volume V of a monatomic gas varies with its temperature T. as shown in the graph. The ratio of work done by the gas, to the heat absorbed by it, when it undergoes a change from state A to state B, is

The correct Answer is:C
Here the curve represents an isobaric process,
In an isobaric process,
Degree of freedom for monatomic gas,
We get from equation (1) ,
Work done by the gas in this process,
.
Topper's Solved these Questions
- FIRST AND SECOND LAW OF THERMODYNAMICSBOOK - CHHAYA PUBLICATIONCHAPTER - FIRST AND SECOND LAW OF THERMODYNAMICSEXERCISE - CBSE SCANNER
18 Videos
- FIRST AND SECOND LAW OF THERMODYNAMICSBOOK - CHHAYA PUBLICATIONCHAPTER - FIRST AND SECOND LAW OF THERMODYNAMICSEXERCISE - Examination Archive with solution (AIPMT)
6 Videos
- EXPANSION OF SOLIDS AND LIQUIDSBOOK - CHHAYA PUBLICATIONCHAPTER - EXPANSION OF SOLIDS AND LIQUIDSEXERCISE - CBSE SCANNER
2 Videos
- FRICTION BOOK - CHHAYA PUBLICATIONCHAPTER - FRICTION EXERCISE - CBSE SCANNER
7 Videos
Similar Questions
the volume( V) of a polyatomic( non linear molecule) gas varies with its temperature(T) , as shown in figure. The ratio of the heat absorbed by the gas to the work done by the gas, when gas is taken from state A to state B , is ( neglect vibrational mode)
_PHY_E05_037_Q01.png)
View SolutionAn ideal gas change from state a to state b as shown in Fig. what is the work done by the gas in the process?
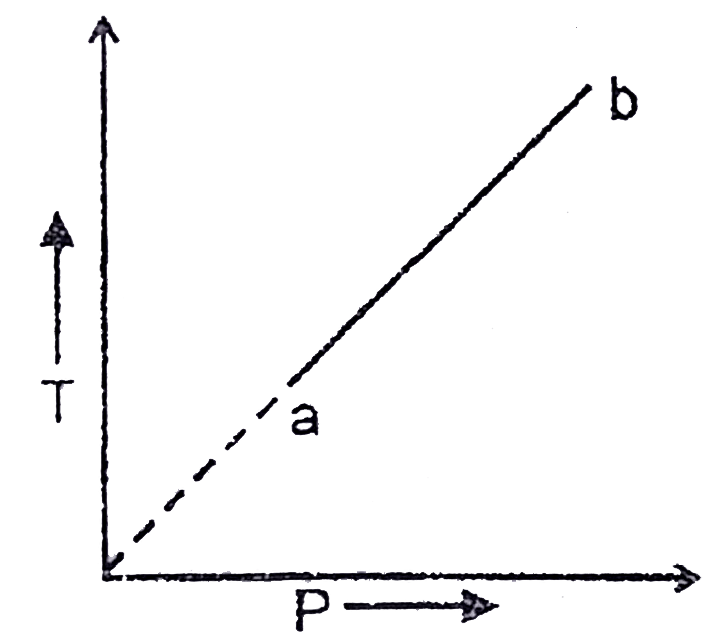
View Solution
Knowledge Check
The volume (V) of a moatomic gas varies with its temperature (T), as shown in the graph. The ratio of work done by the gas, to the heat absorbed by it, when it undergoes a change from state A to state B, is
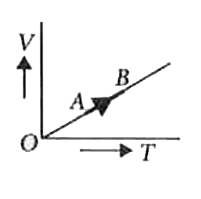 A25B23C13D27
The volume (V) of a manatomic gas varies with its temperature (T) , as shown in the graph. The ratio of work done by the gas, to the heat absorbed by it, when it undergoes a change from state A to B , is
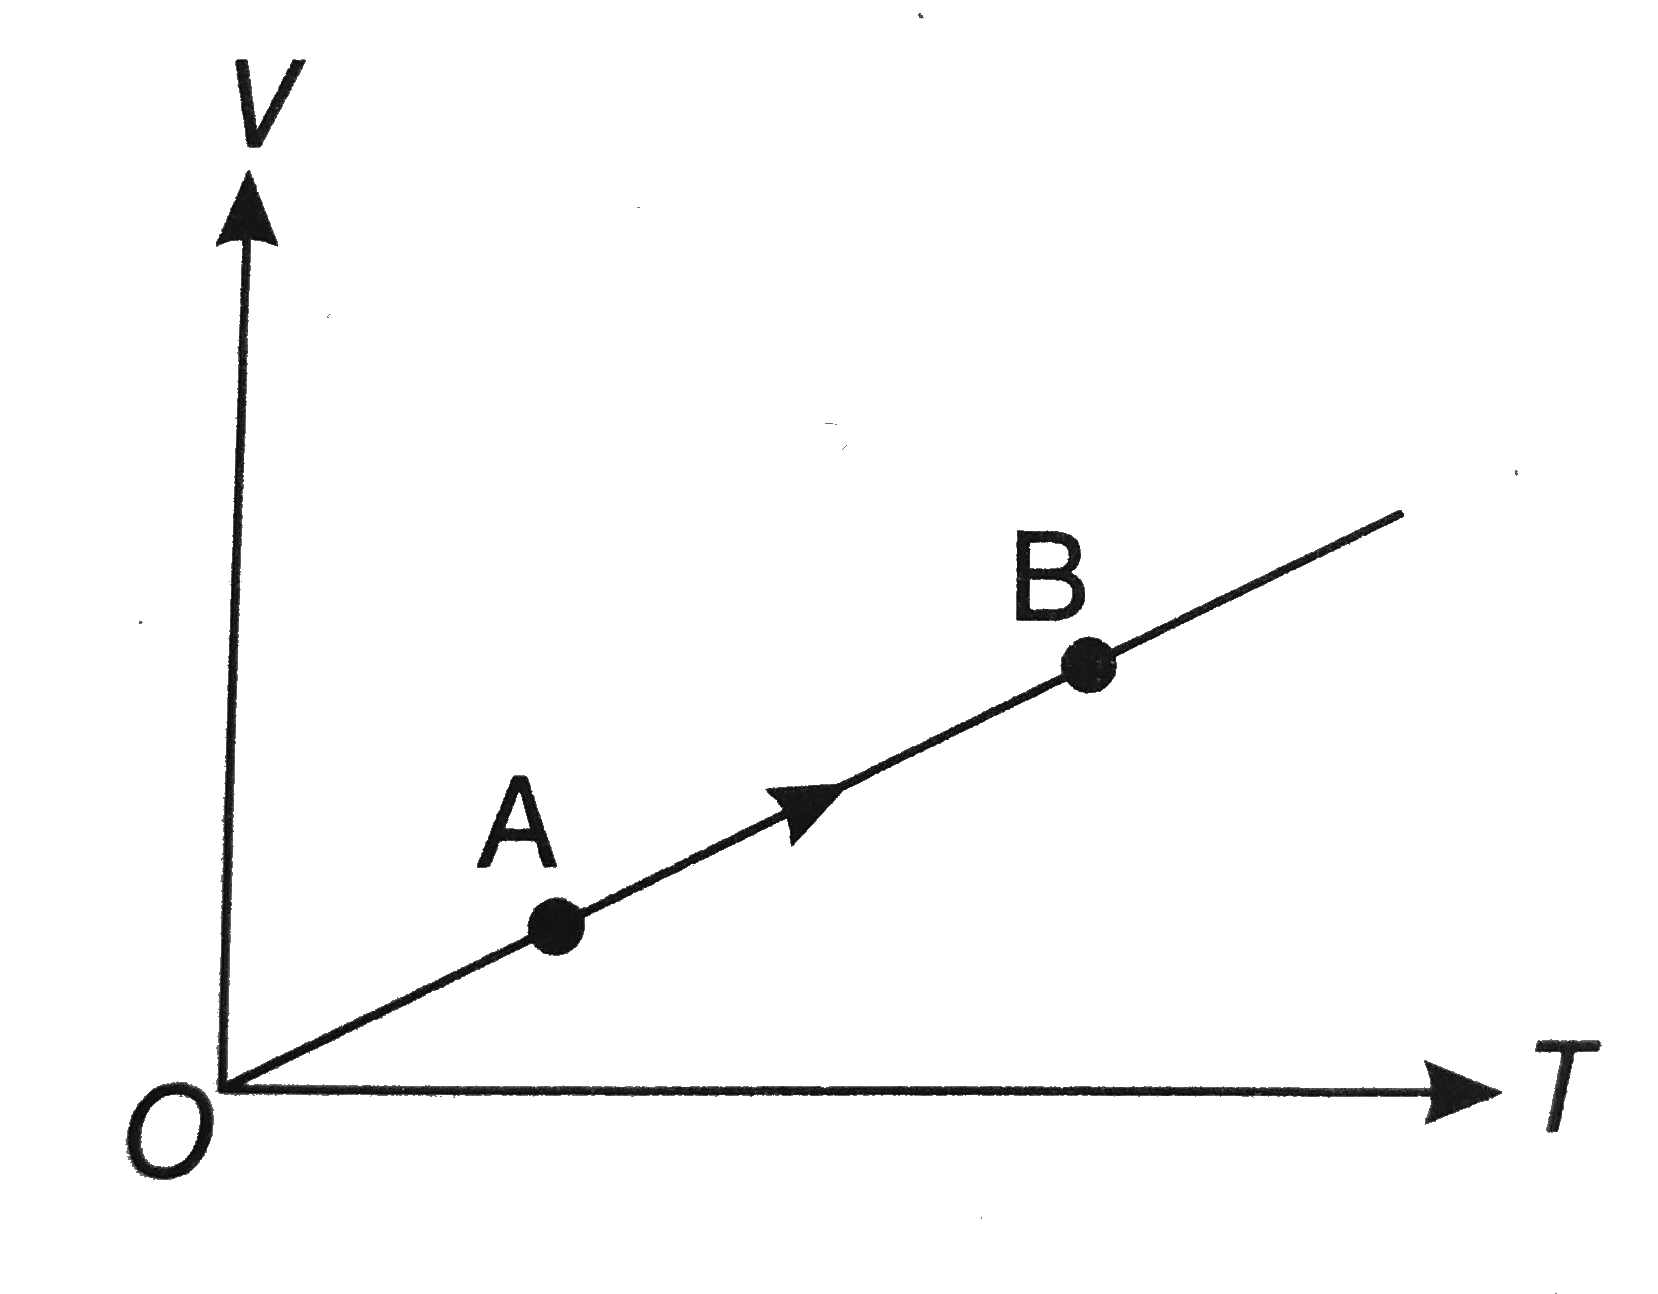 A27B25C13D23
The volume (V) of a monatomic gas varies with its temperature (T) as shown in the graph. The ratio of work done by the gas, to the heat absorbed by it, when it undergoes a change from state A to state B,is
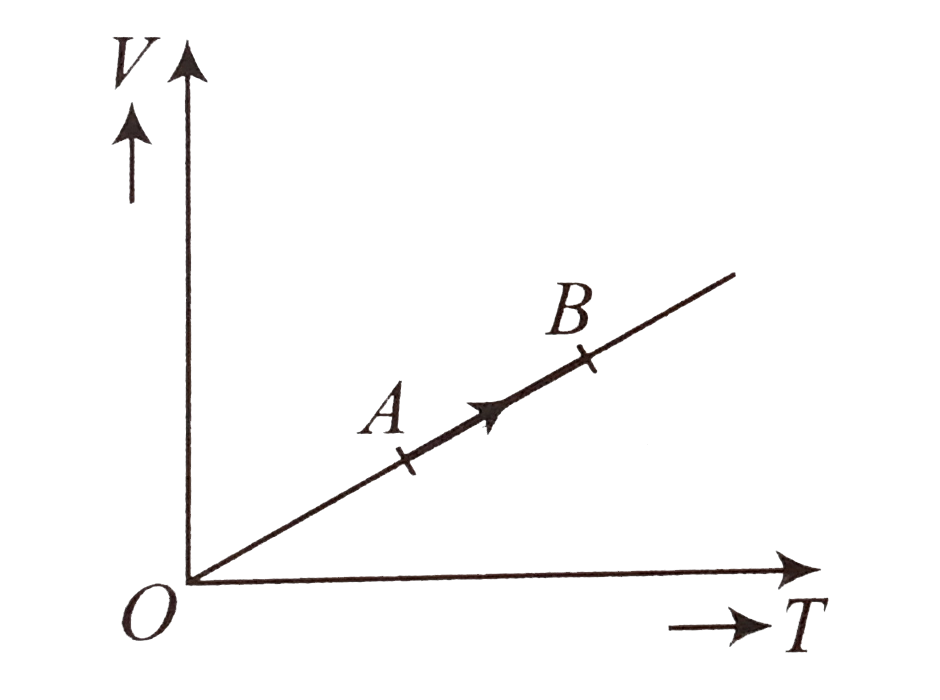 A13B23C25D27
The state of an ideal gas is changed through an isothermal process at temperature T0 as shown in figure. The work done by the gas in going from state B to C is double the work done by gas in going from state A to B. If the pressure in the state B is p02, then the pressure of the gas in state C is
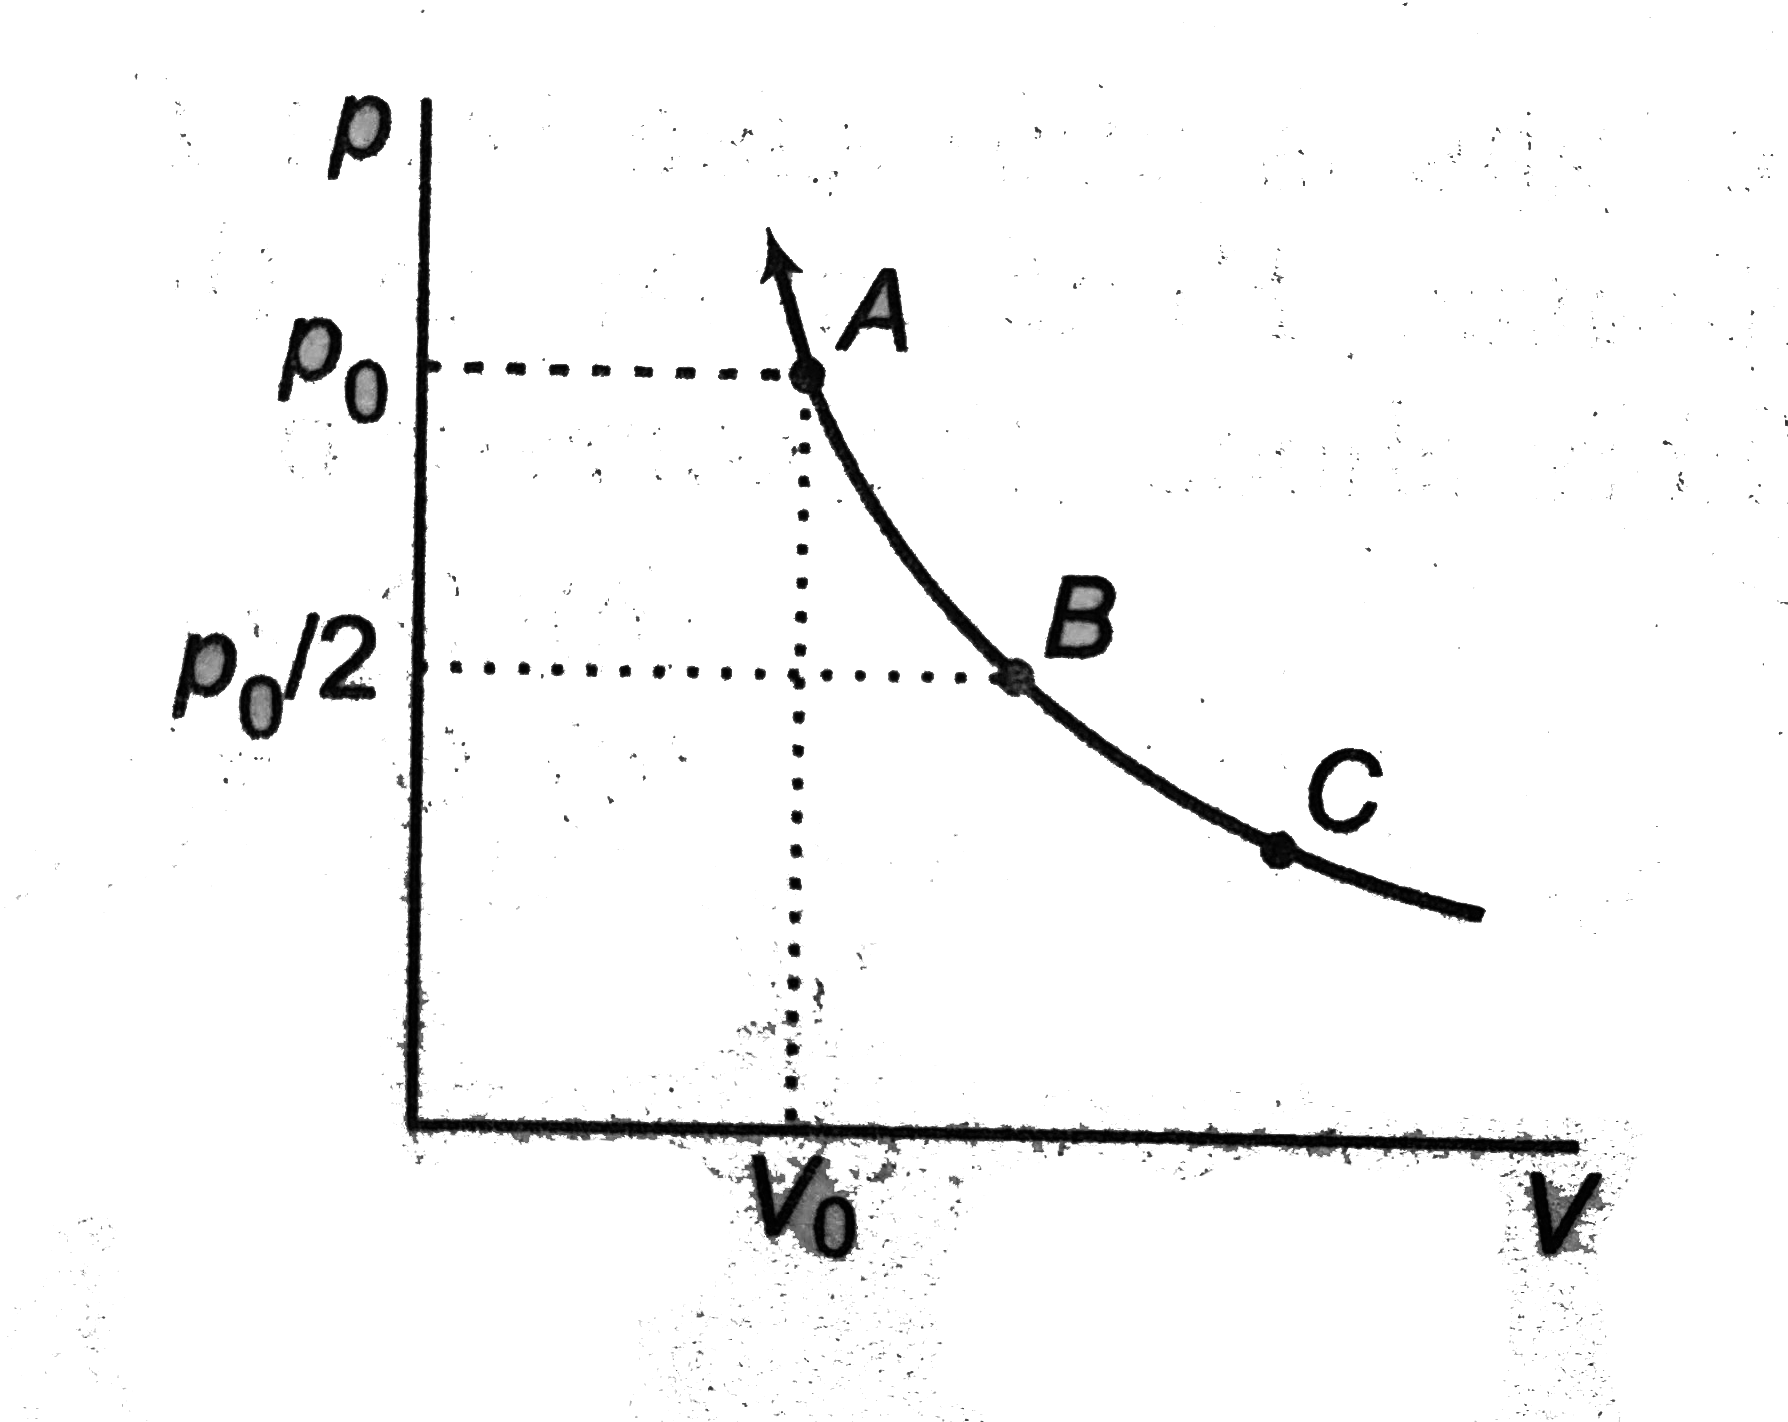
View SolutionThe state of an ideal gas is changed through an isothermal process at temperature T0 as shown in figure. The work done by the gas in going from state B to C is double the work done by gas in going from state A to B. If the pressure in the state B is p02, then the pressure of the gas in state C is

View SolutionAn ideal gas change from state a to state b as shown in Fig. what is the work done by the gas in the process?

View SolutionAn ideal gas change from state a to state b as shown in Fig. what is the work done by the gas in the process?

View SolutionThe state of an ideal gas is changed through an isothermal process at temperature T0 as shown in figure. The work done by the gas in going from state B to C is double the work done by gas in going from state A to B. If the pressure in the state B is p02, then the pressure of the gas in state C is

View Solution
