The oscillation of a body on a smooth horizontal surface is represented by the equation, x=Acosωt, where x = displacement at time t, ω = frequency of oscillation.
Which one of the following graphs shows correctly the variation a with t ?
Here, a = acceleration at time t and T = time period.


The correct Answer is:C
x=Acosωt,
So, velocity, v=dxdt=−Aωsinωt
and acceleration, a=dvdt=−Aω2cosωt
Now at t = 0, a=−Aω2
ant at t = T, a=−Aω2
Topper's Solved these Questions
- SIMPLE HARMONIC MOTIONBOOK - CHHAYA PUBLICATIONCHAPTER - SIMPLE HARMONIC MOTIONEXERCISE - NEET
2 Videos
- SIMPLE HARMONIC MOTIONBOOK - CHHAYA PUBLICATIONCHAPTER - SIMPLE HARMONIC MOTIONEXERCISE - CBSE SCANNER
16 Videos
- SIMPLE HARMONIC MOTIONBOOK - CHHAYA PUBLICATIONCHAPTER - SIMPLE HARMONIC MOTIONEXERCISE - JEE MAIN
6 Videos
- ROTATION OF RIGID BODIES BOOK - CHHAYA PUBLICATIONCHAPTER - ROTATION OF RIGID BODIES EXERCISE - CBSE SCANNER
10 Videos
- STATICSBOOK - CHHAYA PUBLICATIONCHAPTER - STATICSEXERCISE - CBSE SCANNER
3 Videos
Similar Questions
The oscillation of a body on a smooth horizental surface is respresented by the equation
X=Acos(ωt)
where one of the following graph shown correctly the variation a with t?
View SolutionThe graph shown the variation with times t of the velocity v of an object . Which one of the following graphs best represents the variation of acceleration a of the object with time t?

View Solution
Knowledge Check
The oscillation of a body on a smooth horizontal surface is represented by the equation, X=Acos(ωt)
where X = displacement at time t
ω = frequency of oscillation
Which one of the following graphs shows correctly the variation a with t ?A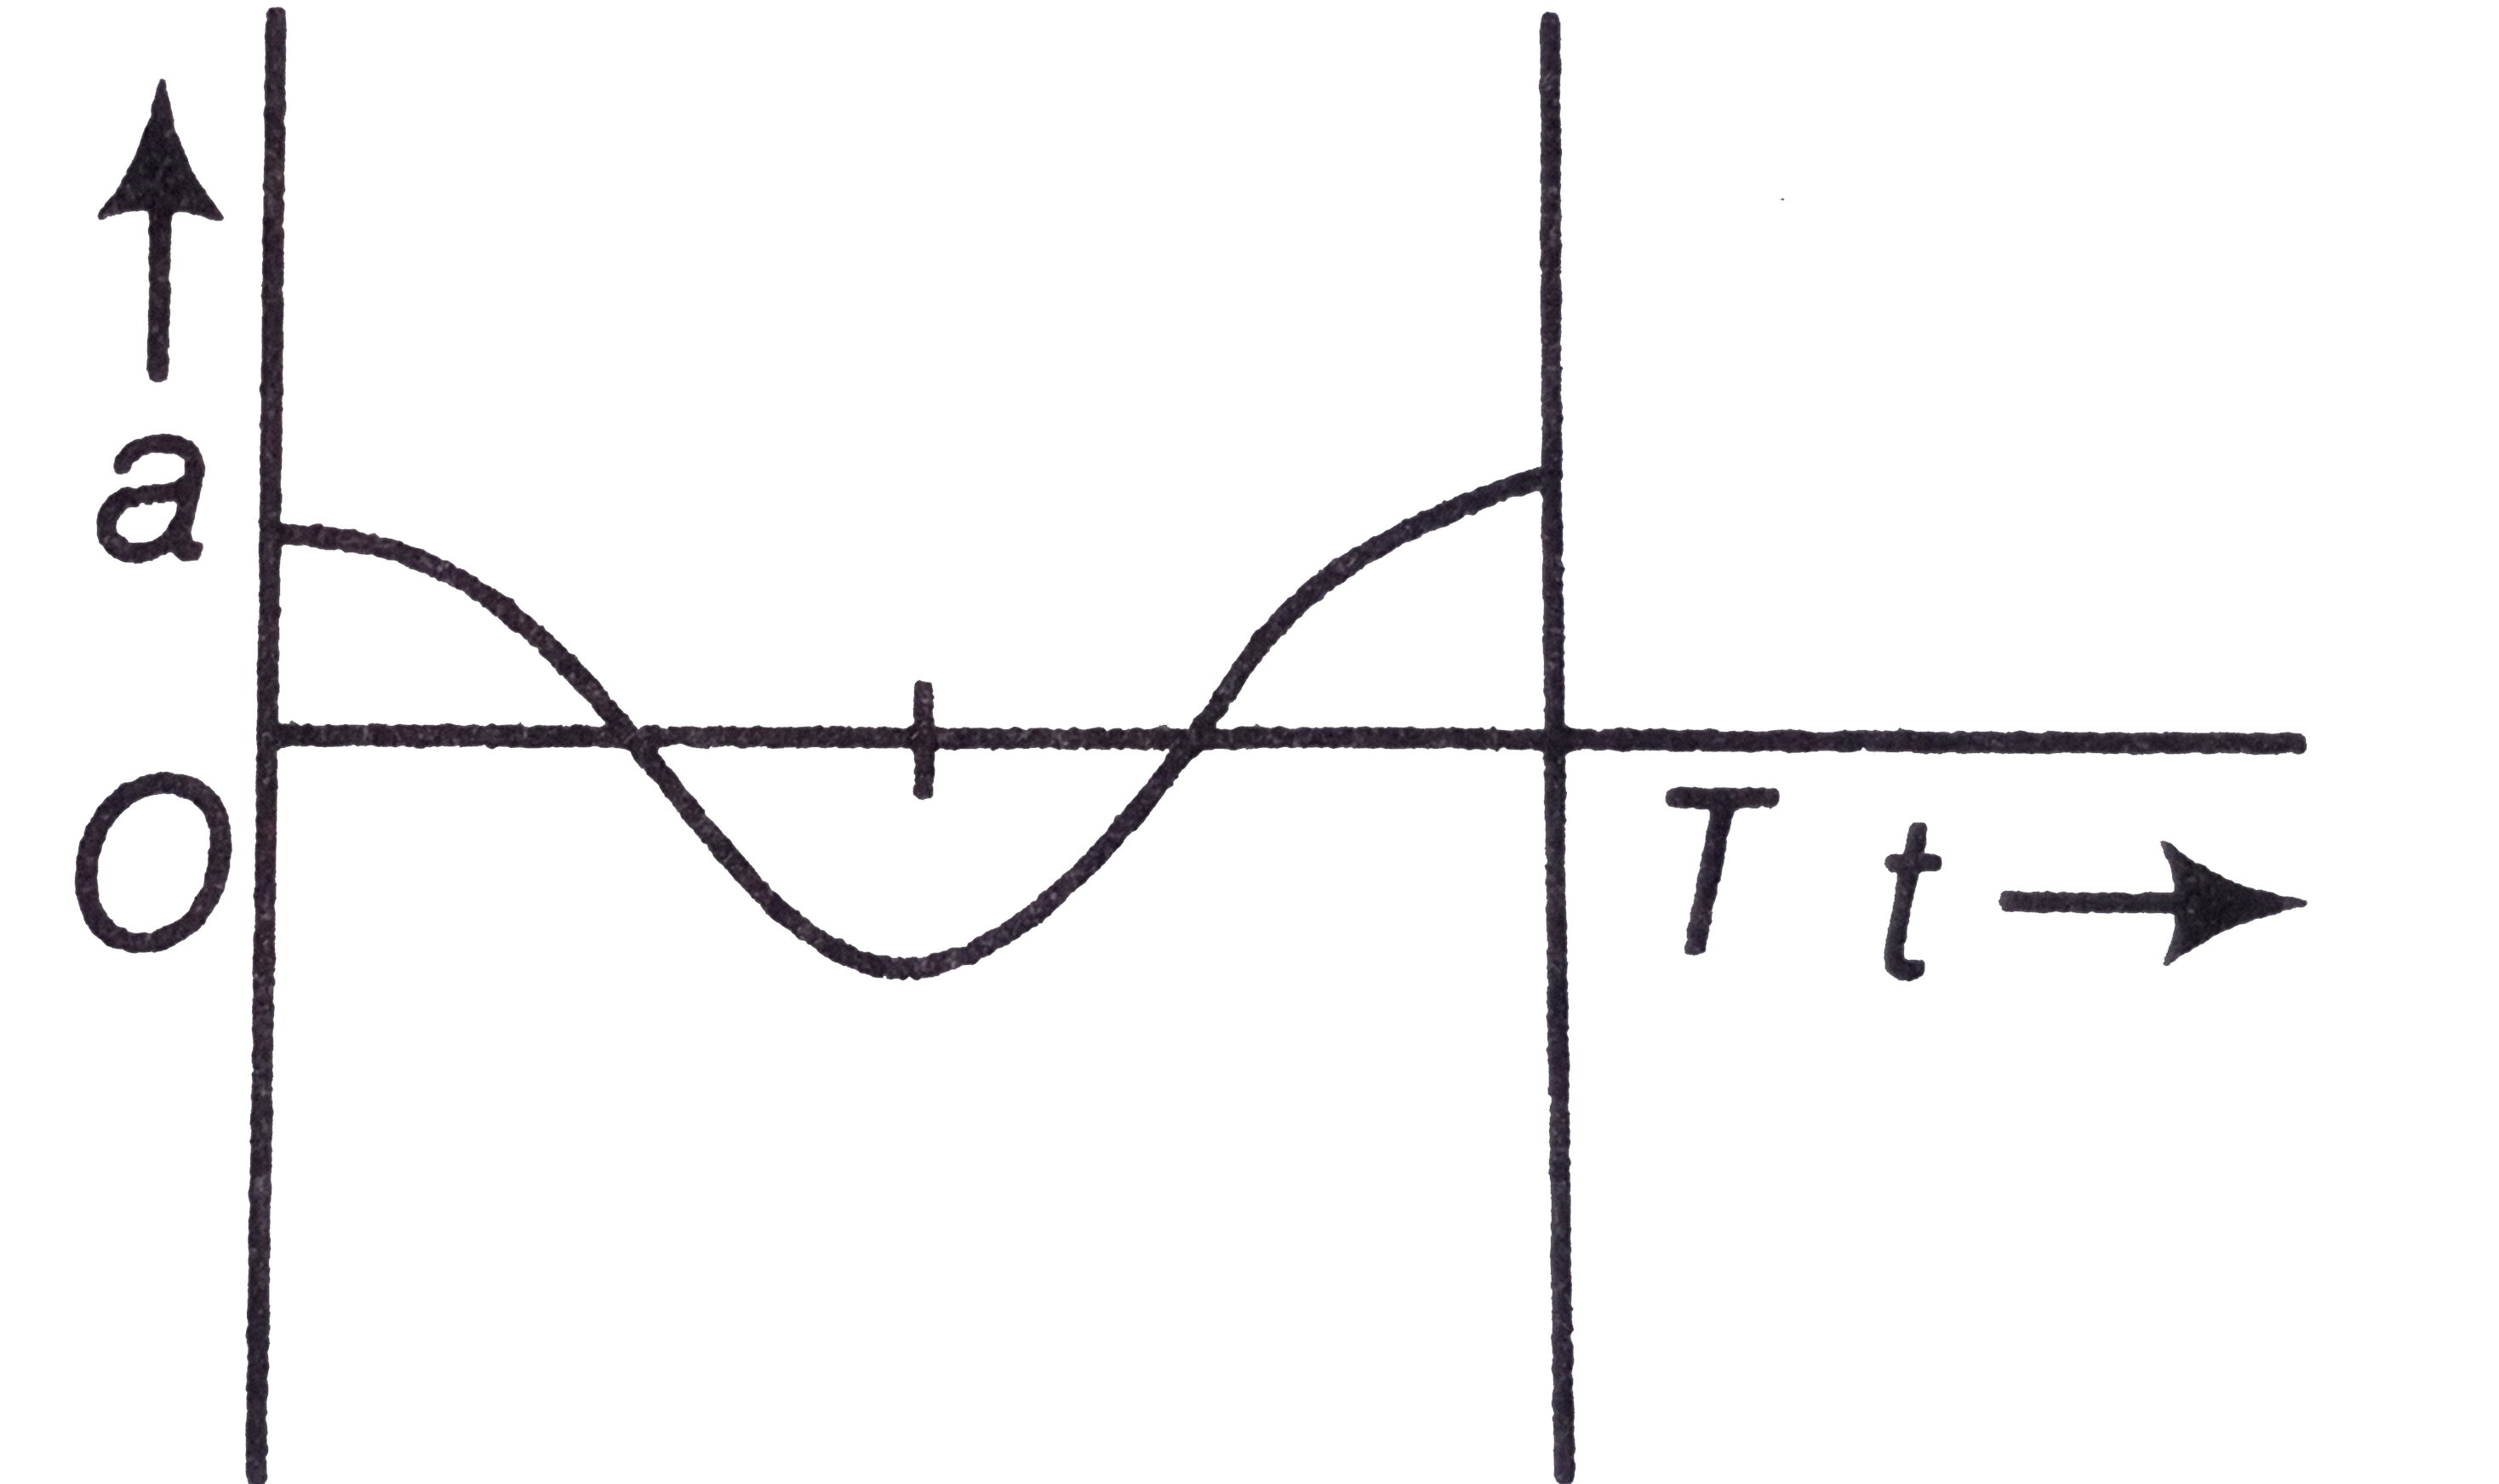 B
B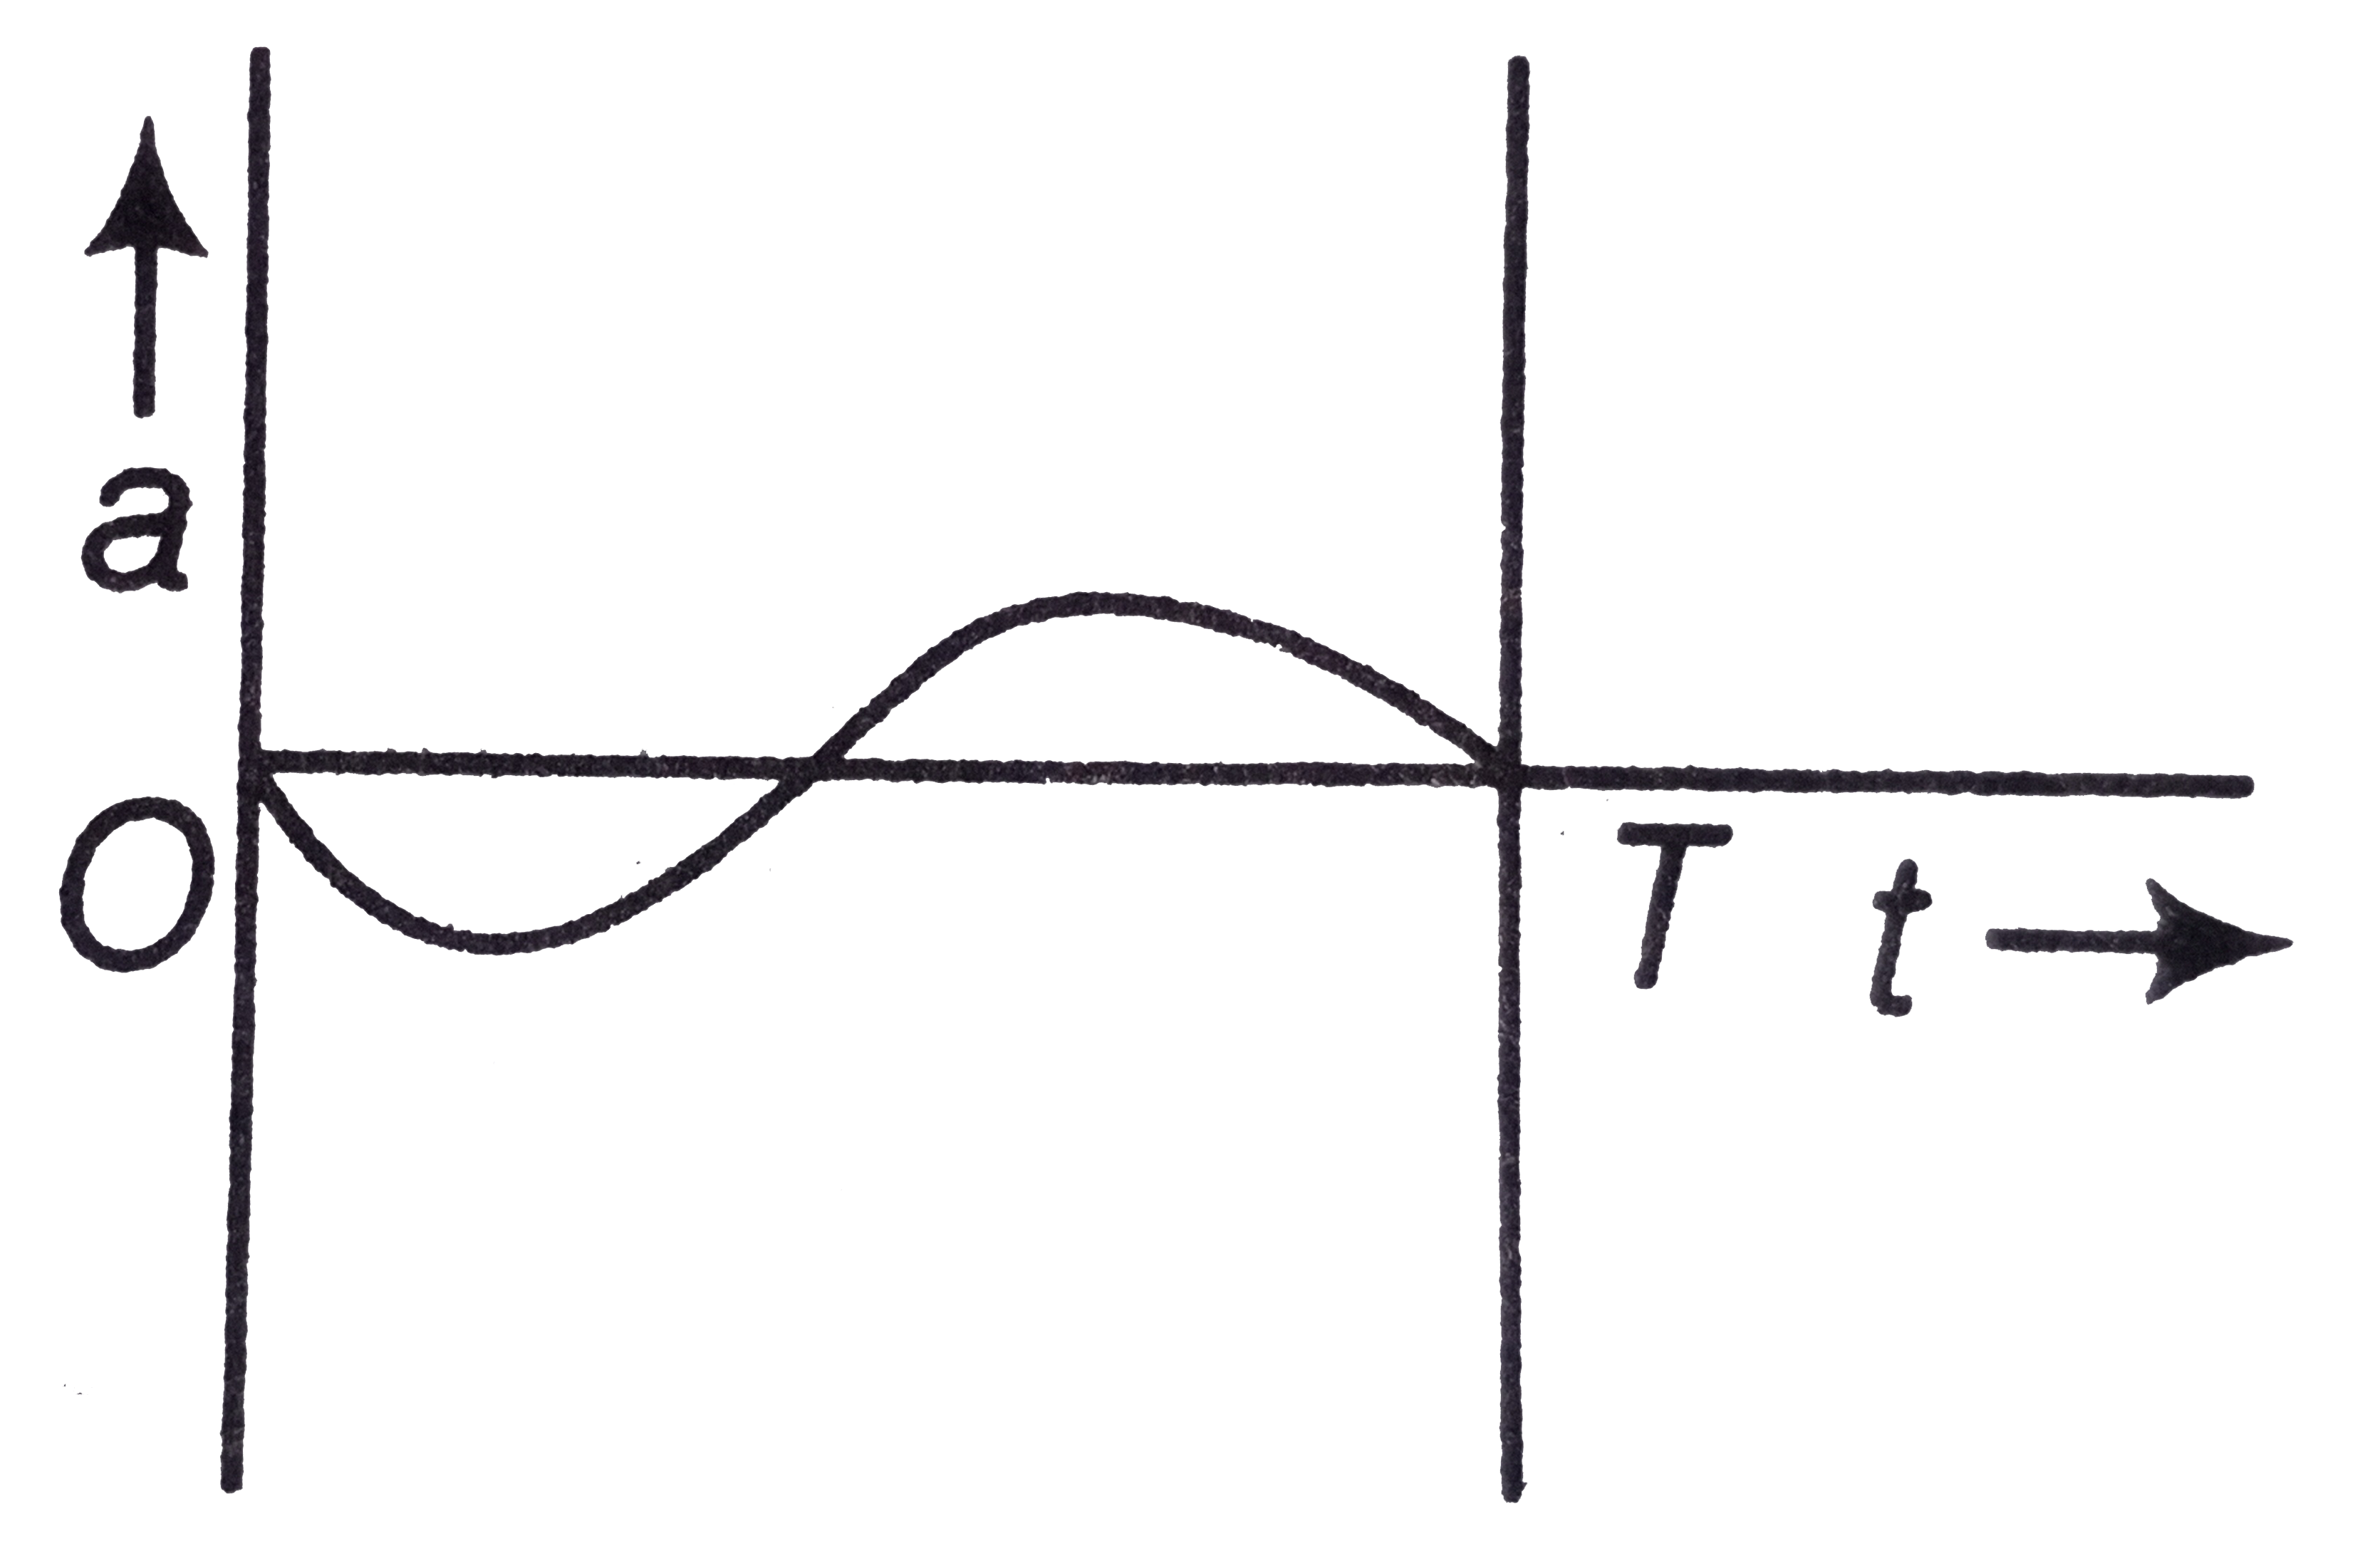 C
C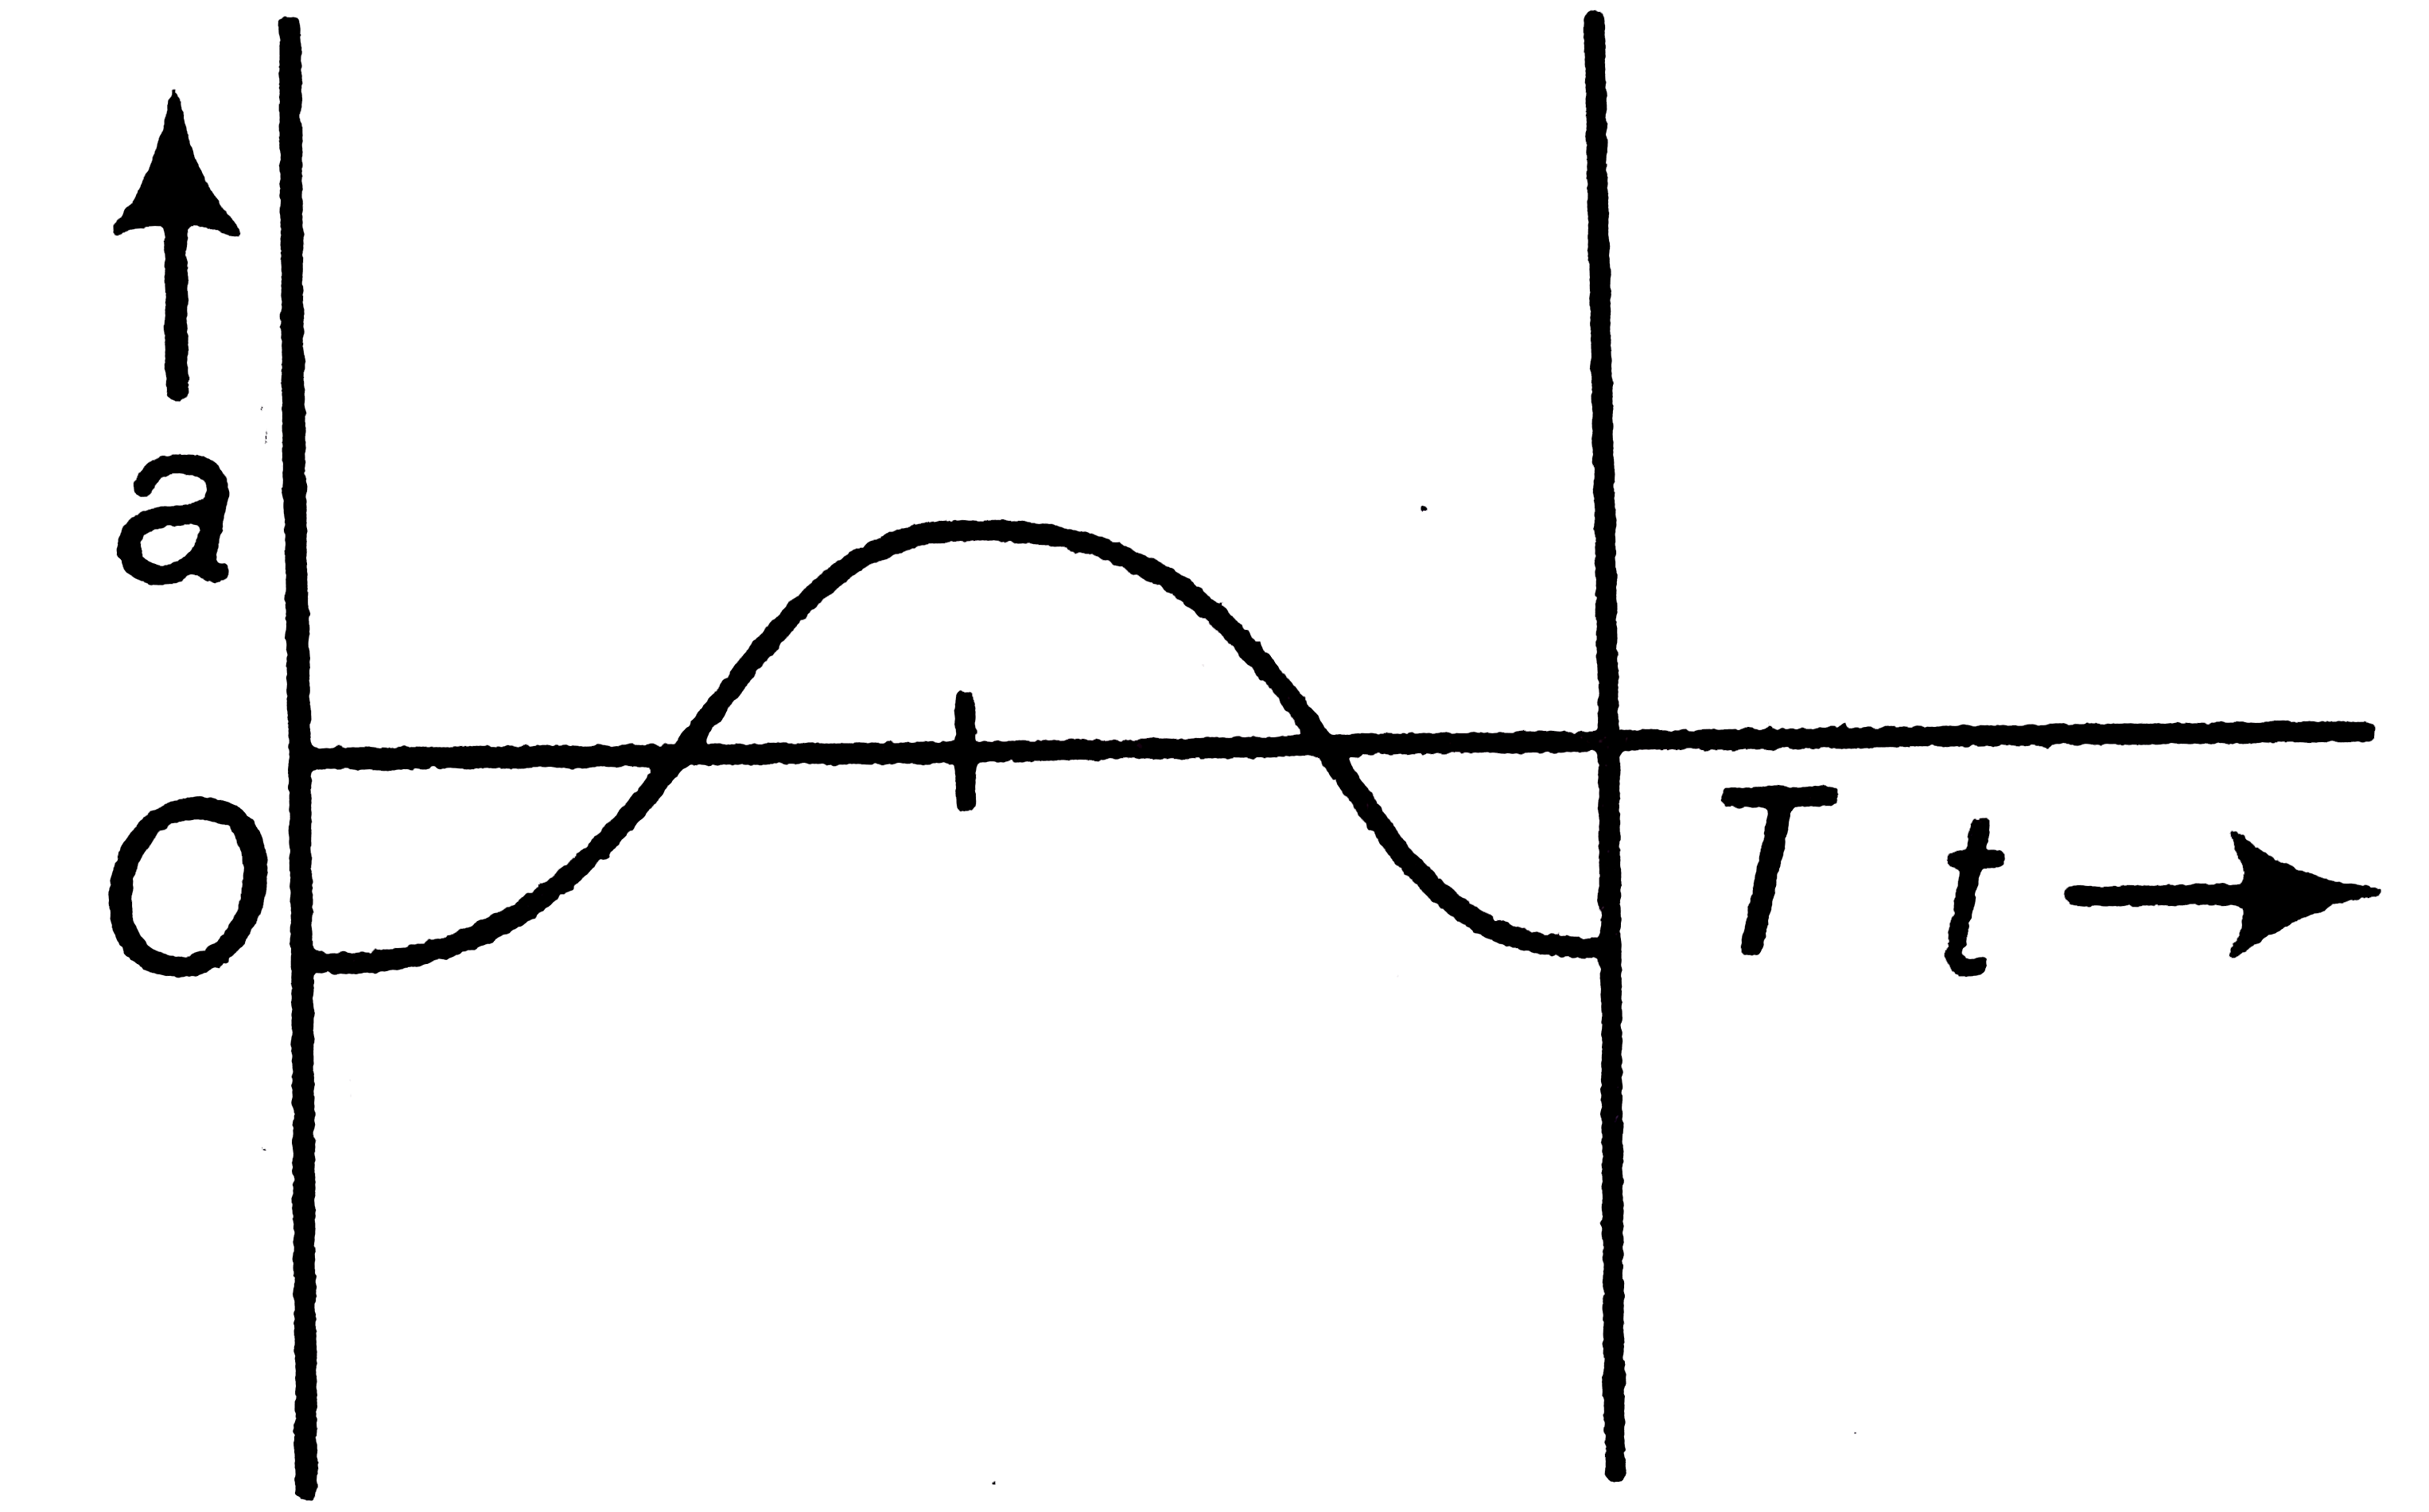 D
D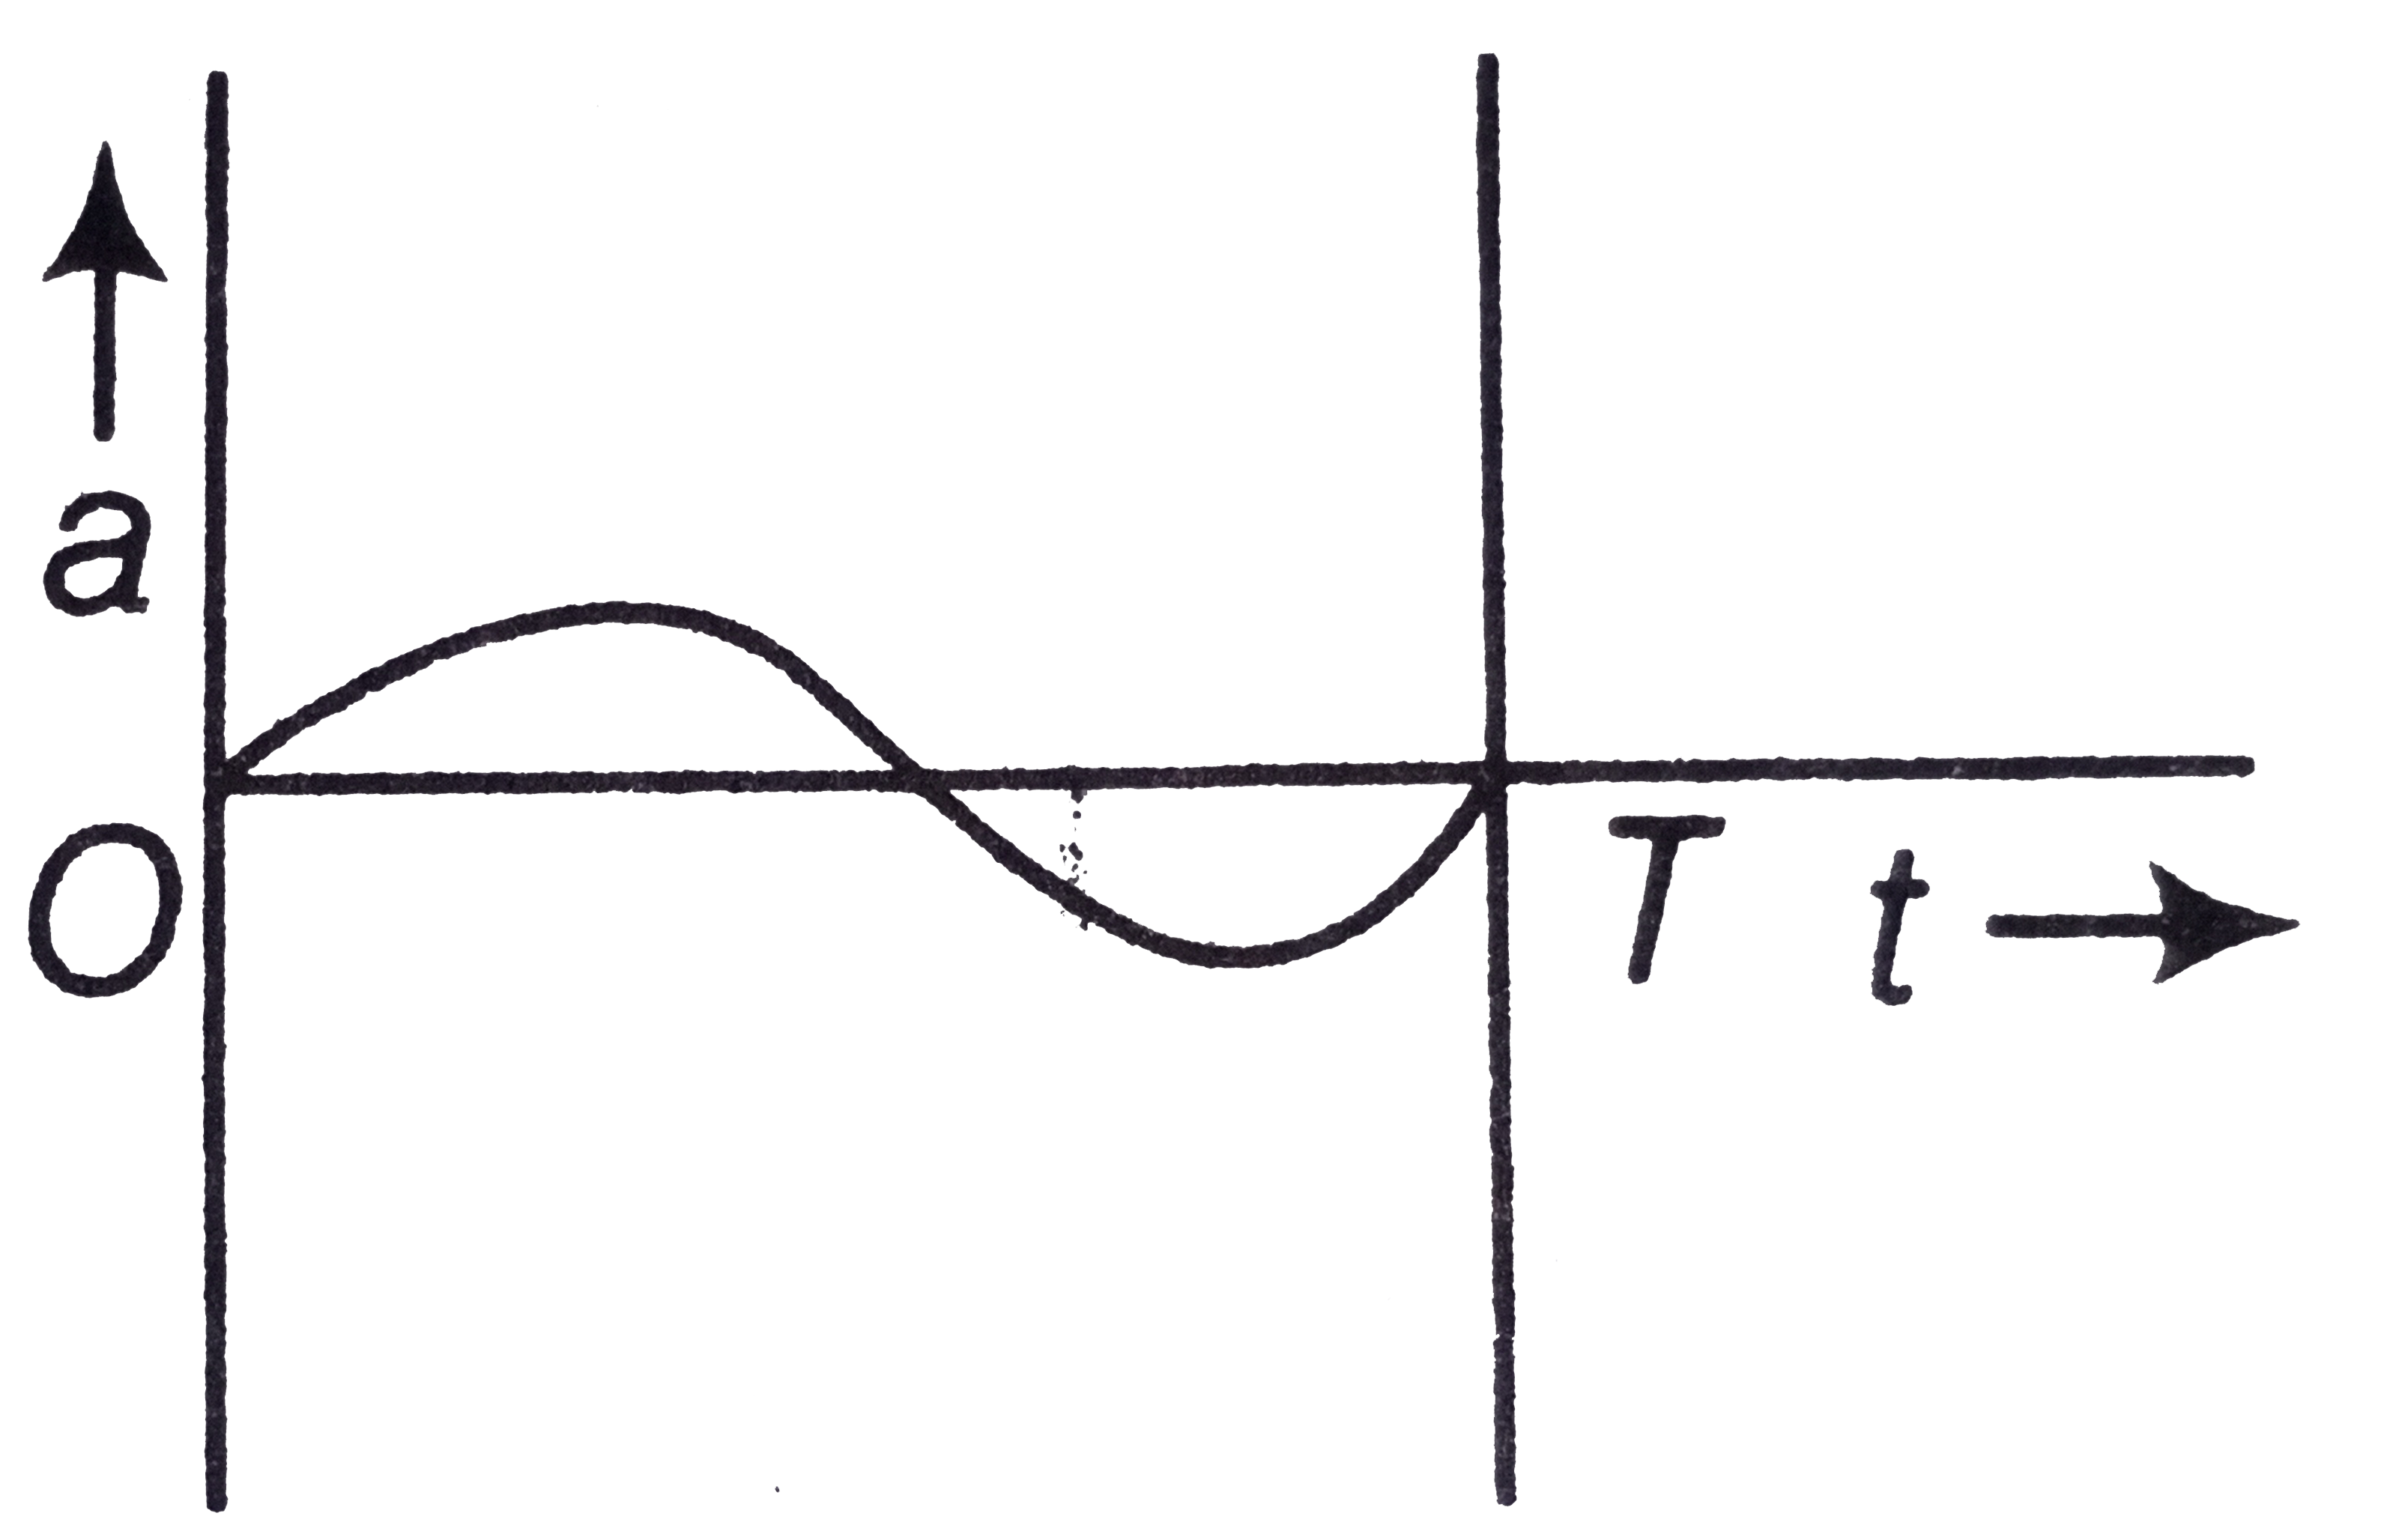
The oscillation of a body on a smooth horizontal surface is represented by the equation,
X=Acos(ωt)
where, X = displacement at time t
ω= frequency of oscillation
Which one of the following graphs shows correctly the variation a with t?
Here, a = acceleration at time t
T = time periodA B
B C
C D
D
The oscillationof a body on a smooth horizontal surface is represented by the equation
x=Acosωt
where x= displacement at time t, ω= frequency of oscillation. Which one of the following graphs shows correctly the variation of acceleration a with time t ?A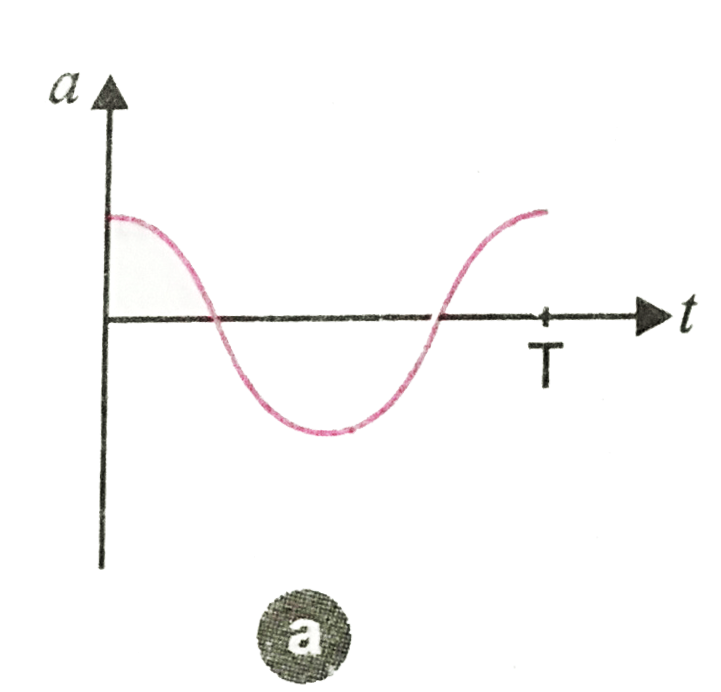 B
B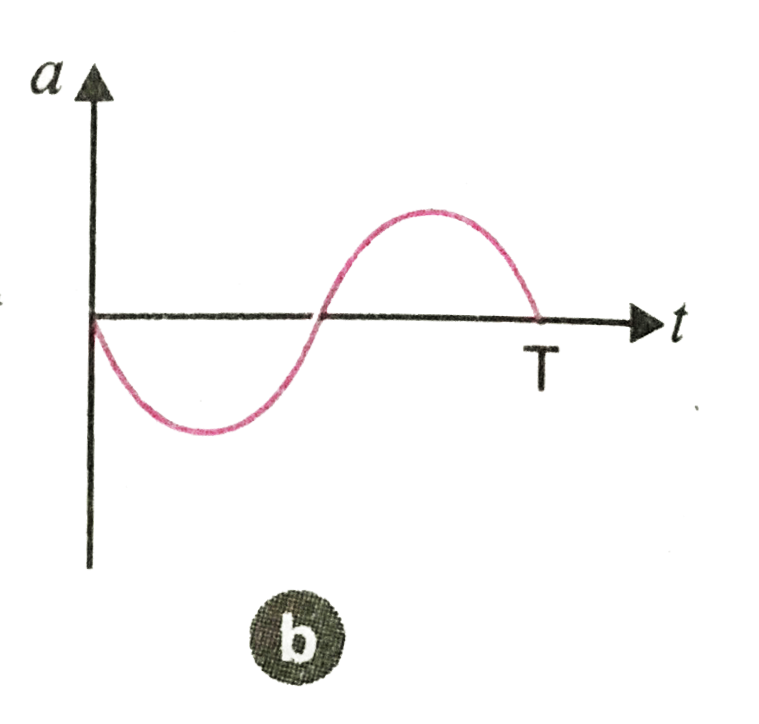 C
C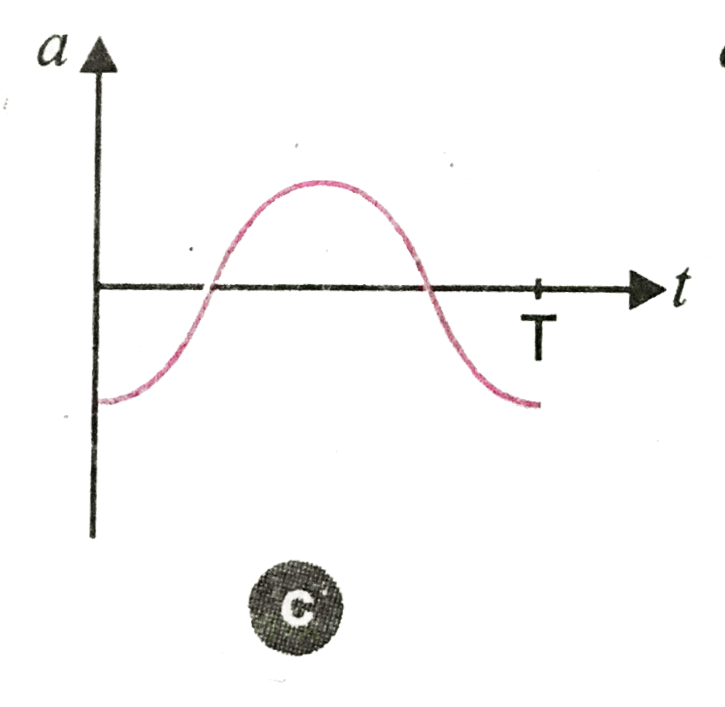 D
D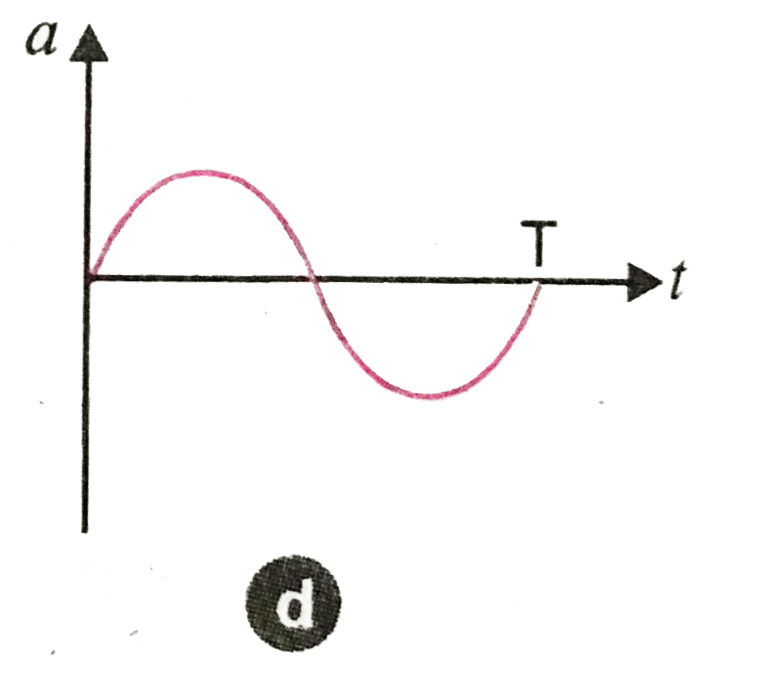
If displacement x at time t is x=√1+t2 , then acceleration is
View SolutionThe oscillation of a body on a smooth horizontal surface is represented by the equation
X=Acos(ωt)
which one of the following graph shown correctly the variation a with t?
View SolutionWhich of the following graphs represents the variation of activity (A) of a radioactive substance with time (t).
View SolutionThe graph shown the variation with times t of the velocity v of an object . Which one of the following graphs best represents the variation of acceleration a of the object with time t?

View SolutionA simple pendulum of length φ oscillates with the time period T . Then which of the following graph correctly represents the relation ?
View Solution
