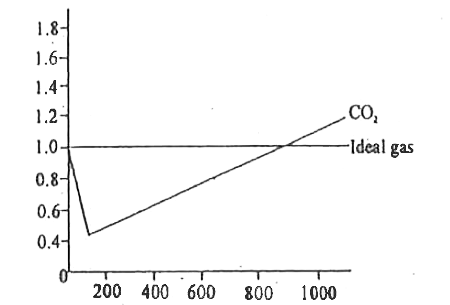
Draw z vs PO graph for an ideal gas, and CO2 gas
Topper's Solved these Questions
- PUE DEPT. MODEL QUESTION PAPERBOOK - SUBHASH PUBLICATIONCHAPTER - PUE DEPT. MODEL QUESTION PAPEREXERCISE - PART-E
13 Videos
- PUE DEPT. MODEL QUESTION PAPERBOOK - SUBHASH PUBLICATIONCHAPTER - PUE DEPT. MODEL QUESTION PAPEREXERCISE - PART-A
11 Videos
- PUE DEPT. MODEL QUESTION PAPERBOOK - SUBHASH PUBLICATIONCHAPTER - PUE DEPT. MODEL QUESTION PAPEREXERCISE - PART -C
16 Videos
- P-BLOCK ELEMENTSBOOK - SUBHASH PUBLICATIONCHAPTER - P-BLOCK ELEMENTSEXERCISE - Three mark questions and answers
24 Videos
- REDOX REACTIONSBOOK - SUBHASH PUBLICATIONCHAPTER - REDOX REACTIONSEXERCISE - Three Marks Questions
29 Videos
Similar Questions
According to the real gas equation, Z is equal to 1 for an ideal gas and Z is variable for a real gas. Suppose, in order to easy our calculation, we fixed Z=1 for real gas and for ideal gas Z will become variable, Z vs P for an ideal gas will be similar to:
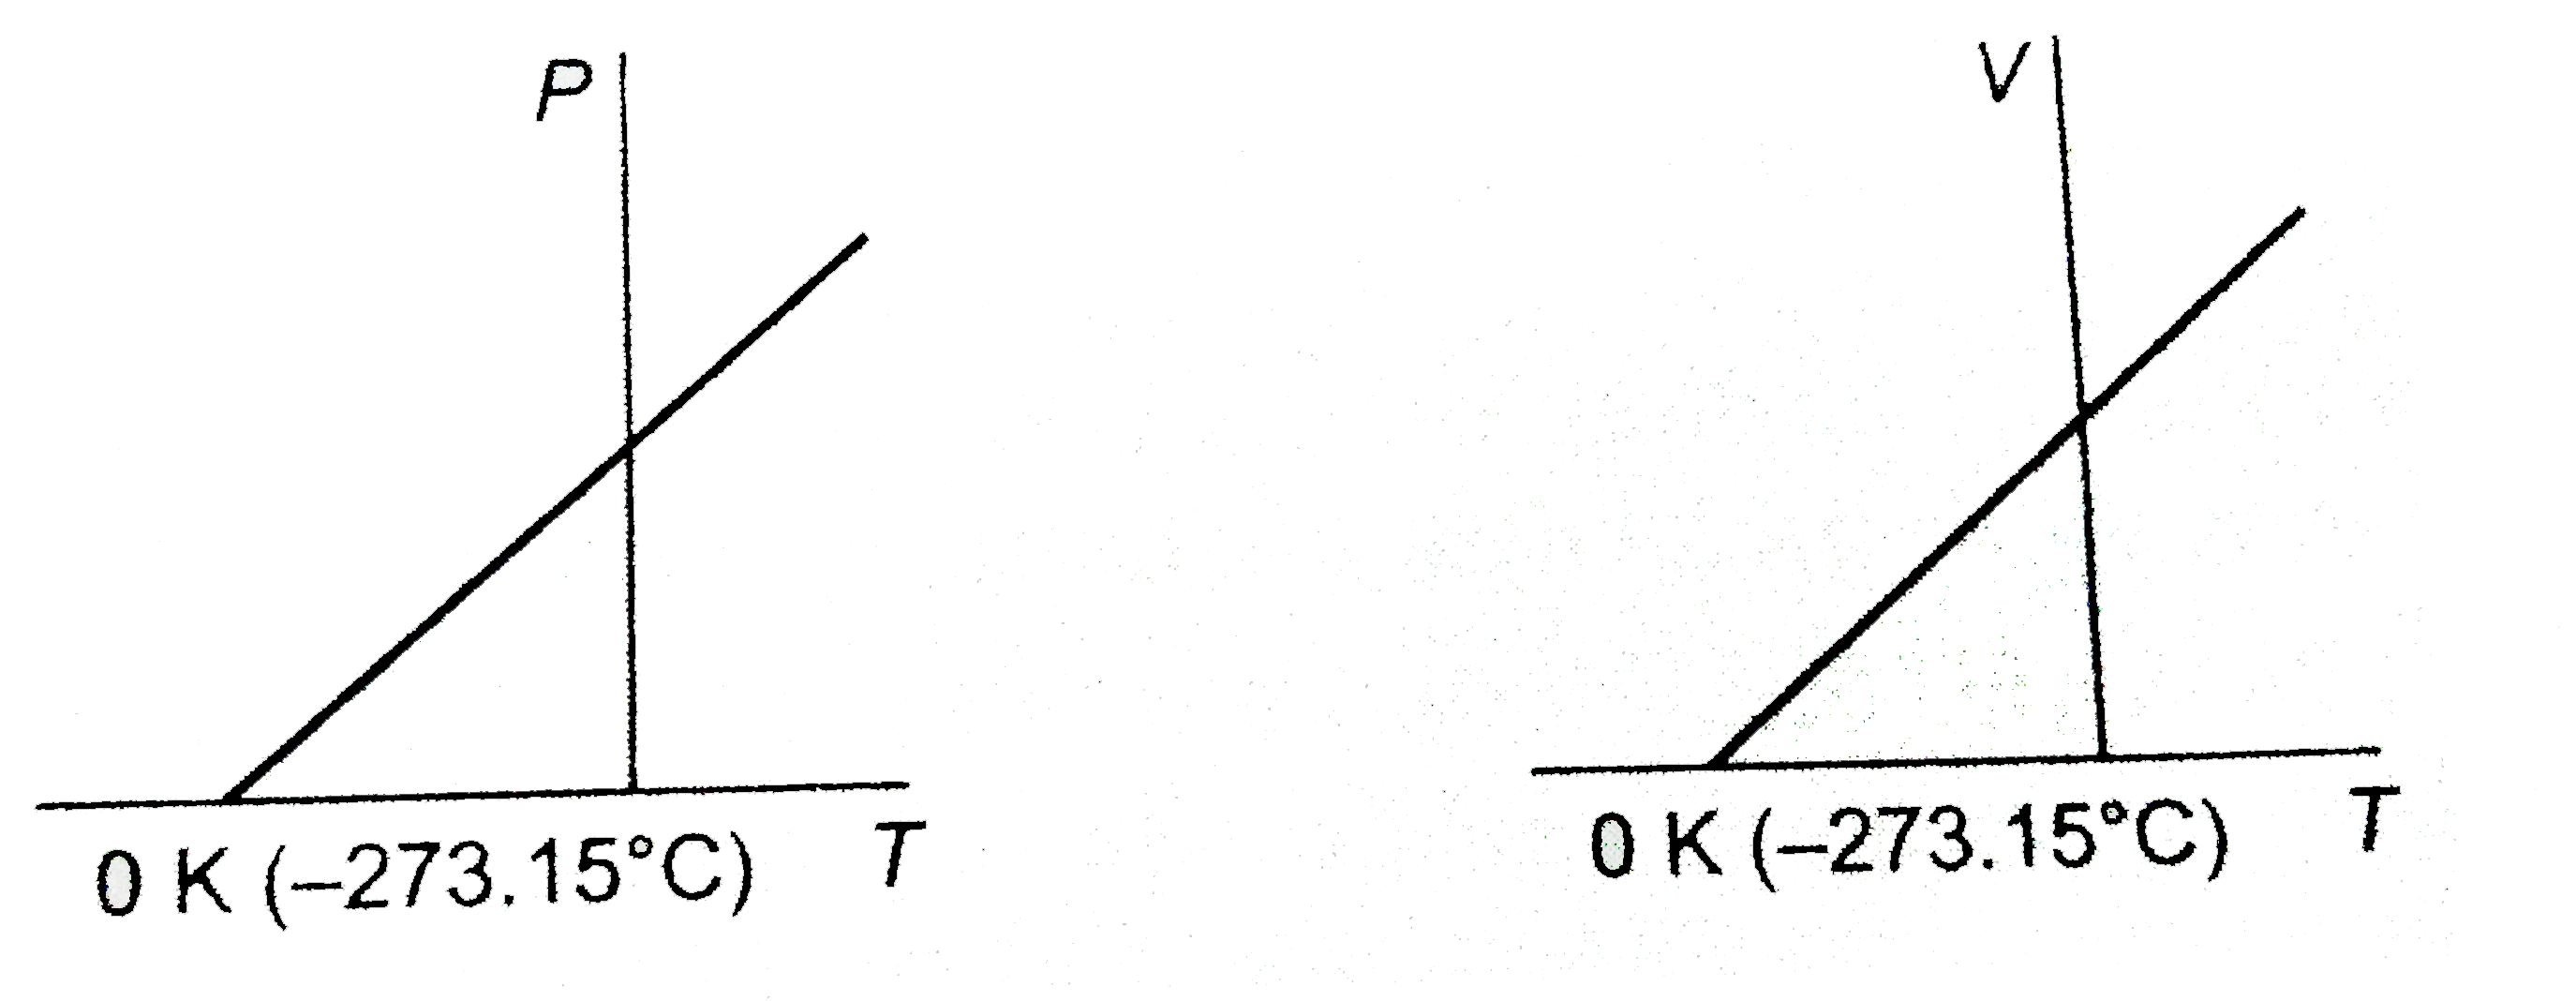
View SolutionWhat conclusion would you draw from the following graphs for an ideal gas?
View Solution
Knowledge Check
What conclusion would you draw from the following graphs for an ideal gas?
 AAs the temperature is reduced, the volume as well as the pressure increaseBAs the temperature is reduced, the volumebecomes zero and the pressure reaches infinityCAs the temperature is reduced, the pressure decreaseDA point is reached where, theoretically, the volume become zero
Graph depicting correct behaviour of ideal gas and H2 gas will be (neglect a):
A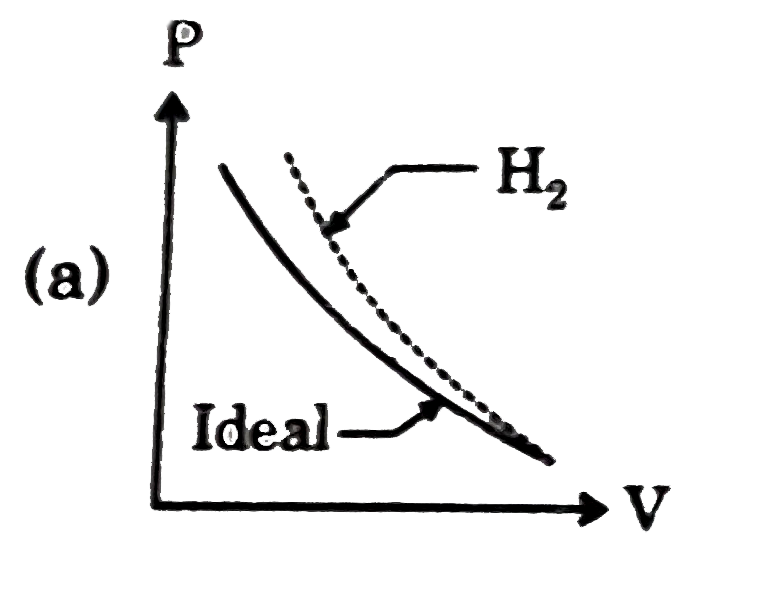 B
B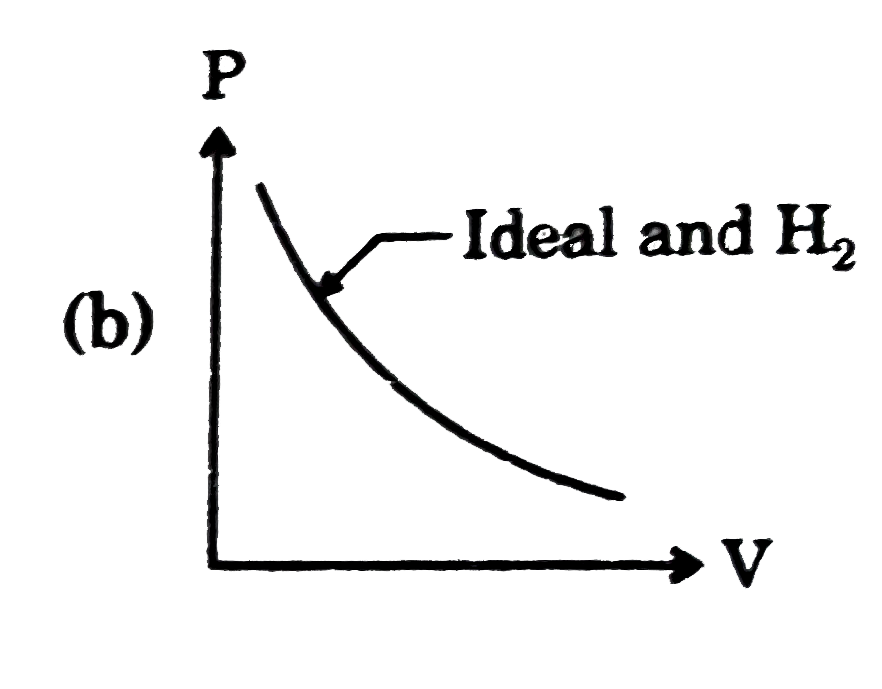 C
C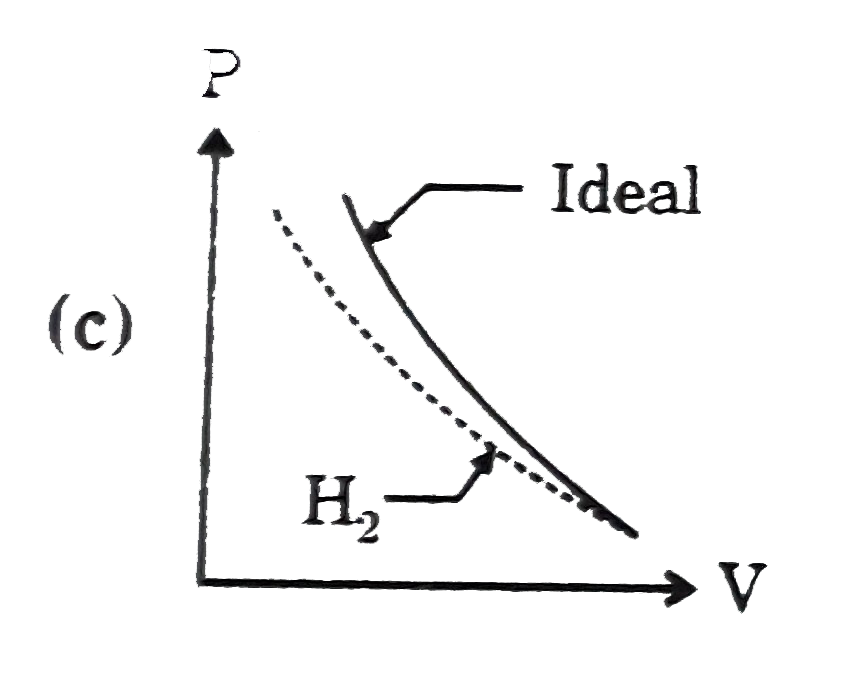 D
D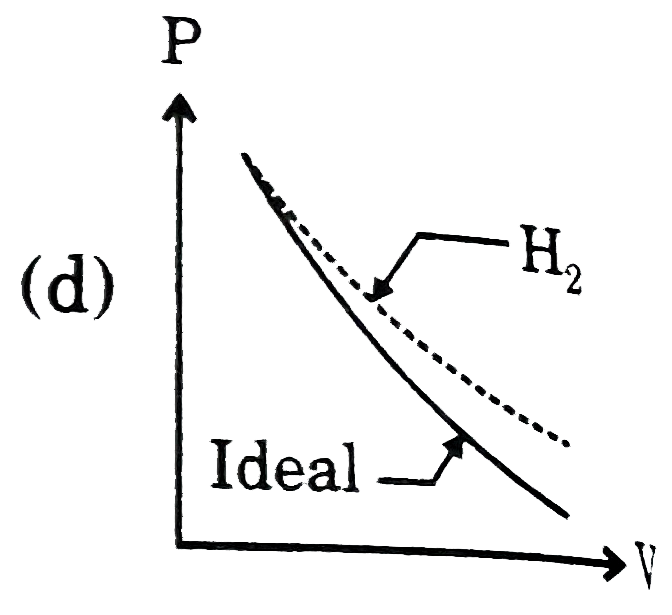
Shows graphs of pressure vs density for an ideal gas at two temperaturesT1andT2
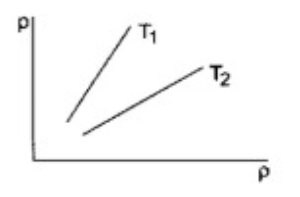 A(a)T1>T2B(b)T1=T2C(c)T1<T2D(d)Any of the three is possibe.
Graph depicting correct behaviour of ideal gas and H2 gas will be (neglect a):
View Solutiongraph of an ideal gas is as shown in figure.
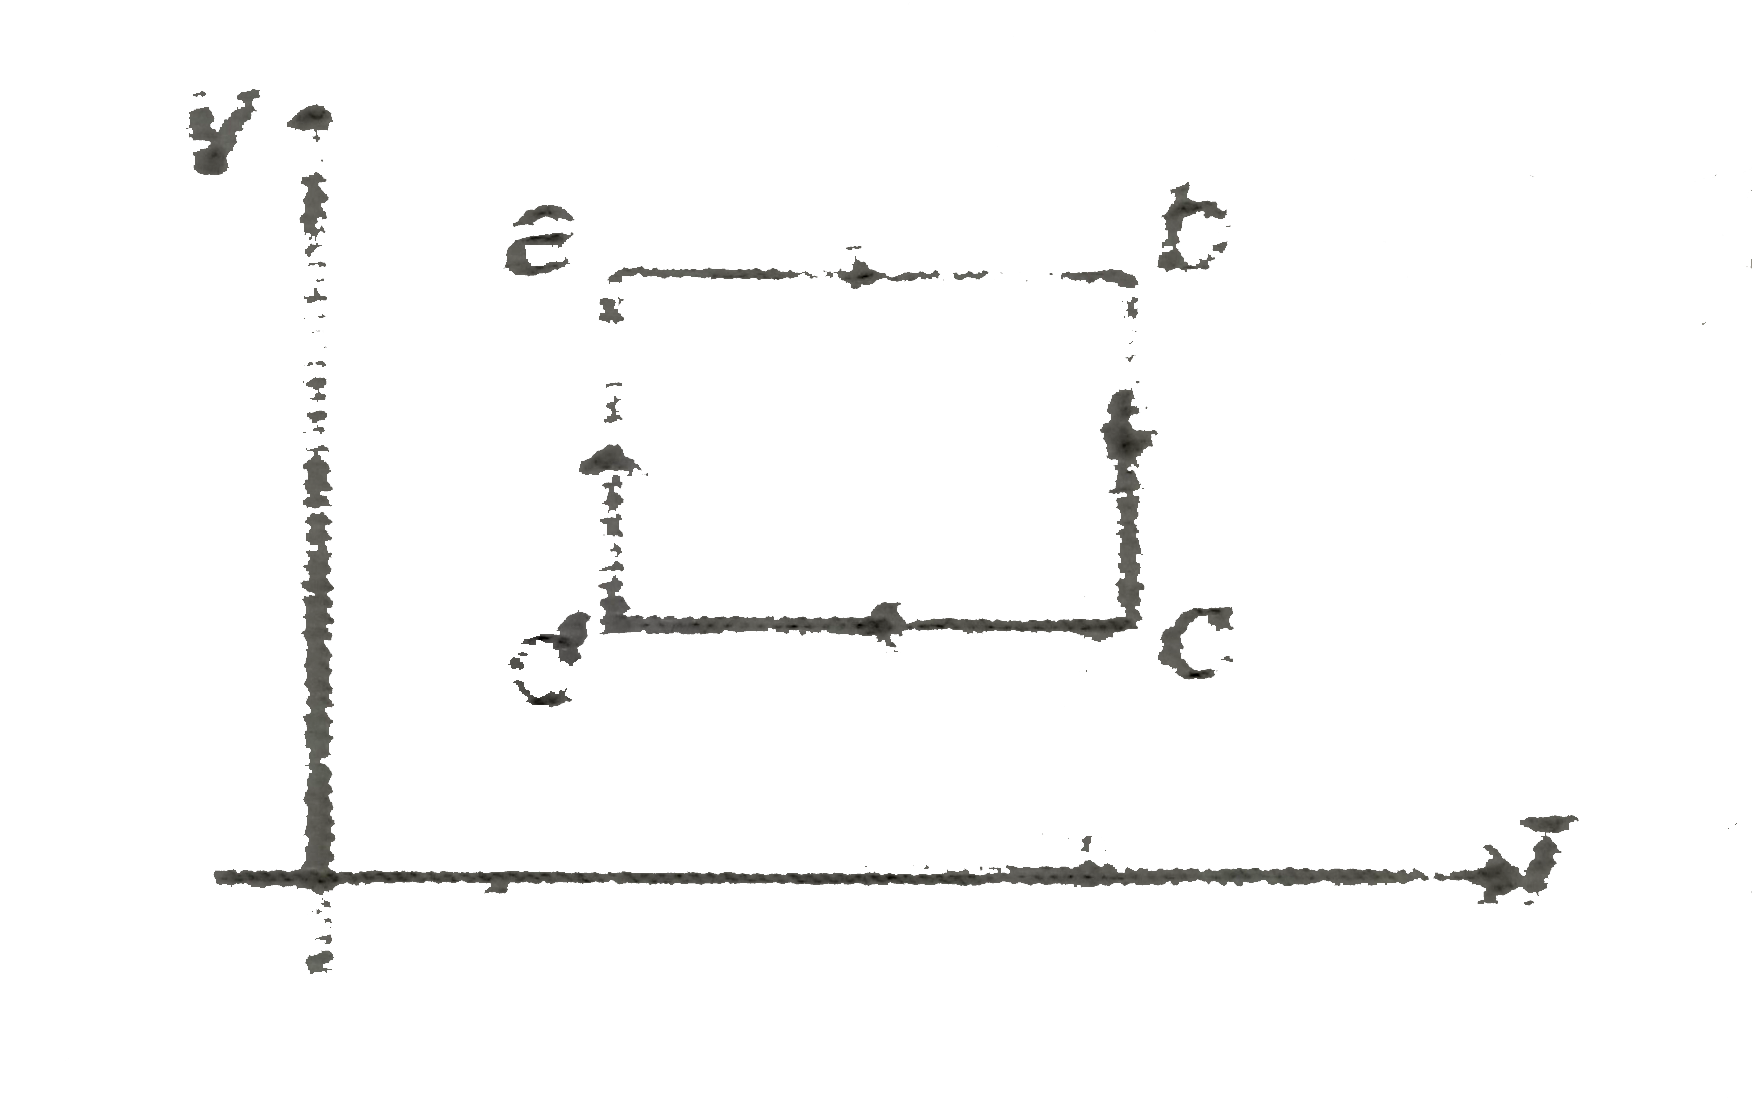
Heat is supplied to the gas in process (s).
View SolutionFigure shows graphs of pressure vs density for an ideal gas at two temperatures Tt and T2
View SolutionLog P vs log V curve is plotted for an ideal gas, which is true for the gas ?

View Solutiongraph of an ideal gas is as shown in figure.

Heat is supplied to the gas in process (s).
View Solution
