Log P vs log V curve is plotted for an ideal gas, which is true for the gas ? 
Monoatomic & undergoing adiabitc chagre
Monatomic & undergoing an isothermal change
Diamtomic & undergoing an adiabitc charge
Triatomic & undergoing an isothermal change
The correct Answer is:C
Equation of processe
logP−2.38logV−1.10=2.10−2.381.30−1.10=−0.280.20=−75
⇒(logP−2.38)×5=−7(logV−1.1)
⇒5logP+7logV=19.60
⇒logP5+logV7=19.60
P5V7 = antilog (19.60) = constant
or PV1.4 = constant
∴γ=1.4−diatomic & adiabatic
Topper's Solved these Questions
- THERMODYNAMICSBOOK - BANSALCHAPTER - THERMODYNAMICSEXERCISE - Exercise
14 Videos
- THERMODYNAMICSBOOK - BANSALCHAPTER - THERMODYNAMICSEXERCISE - Exercise 1
35 Videos
- THERMODYNAMICSBOOK - BANSALCHAPTER - THERMODYNAMICSEXERCISE - Exercise 3
43 Videos
- THERMOCHEMISTRYBOOK - BANSALCHAPTER - THERMOCHEMISTRYEXERCISE - Exercise 4
15 Videos
Similar Questions
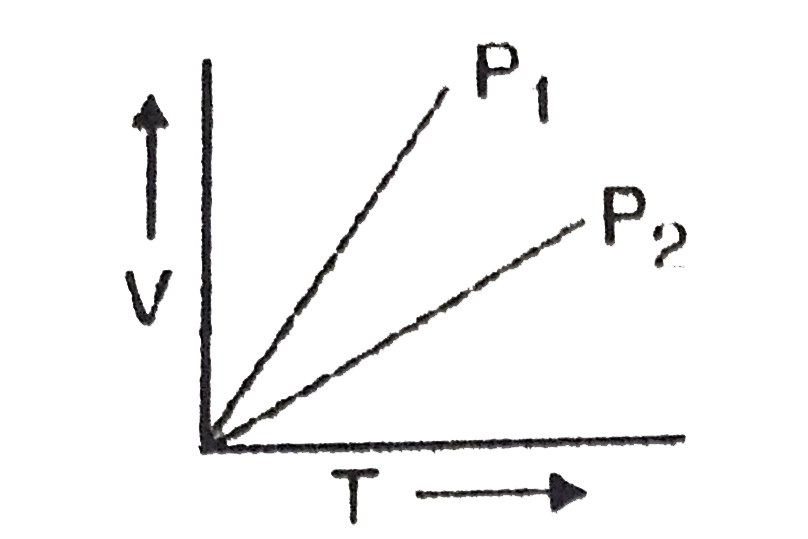
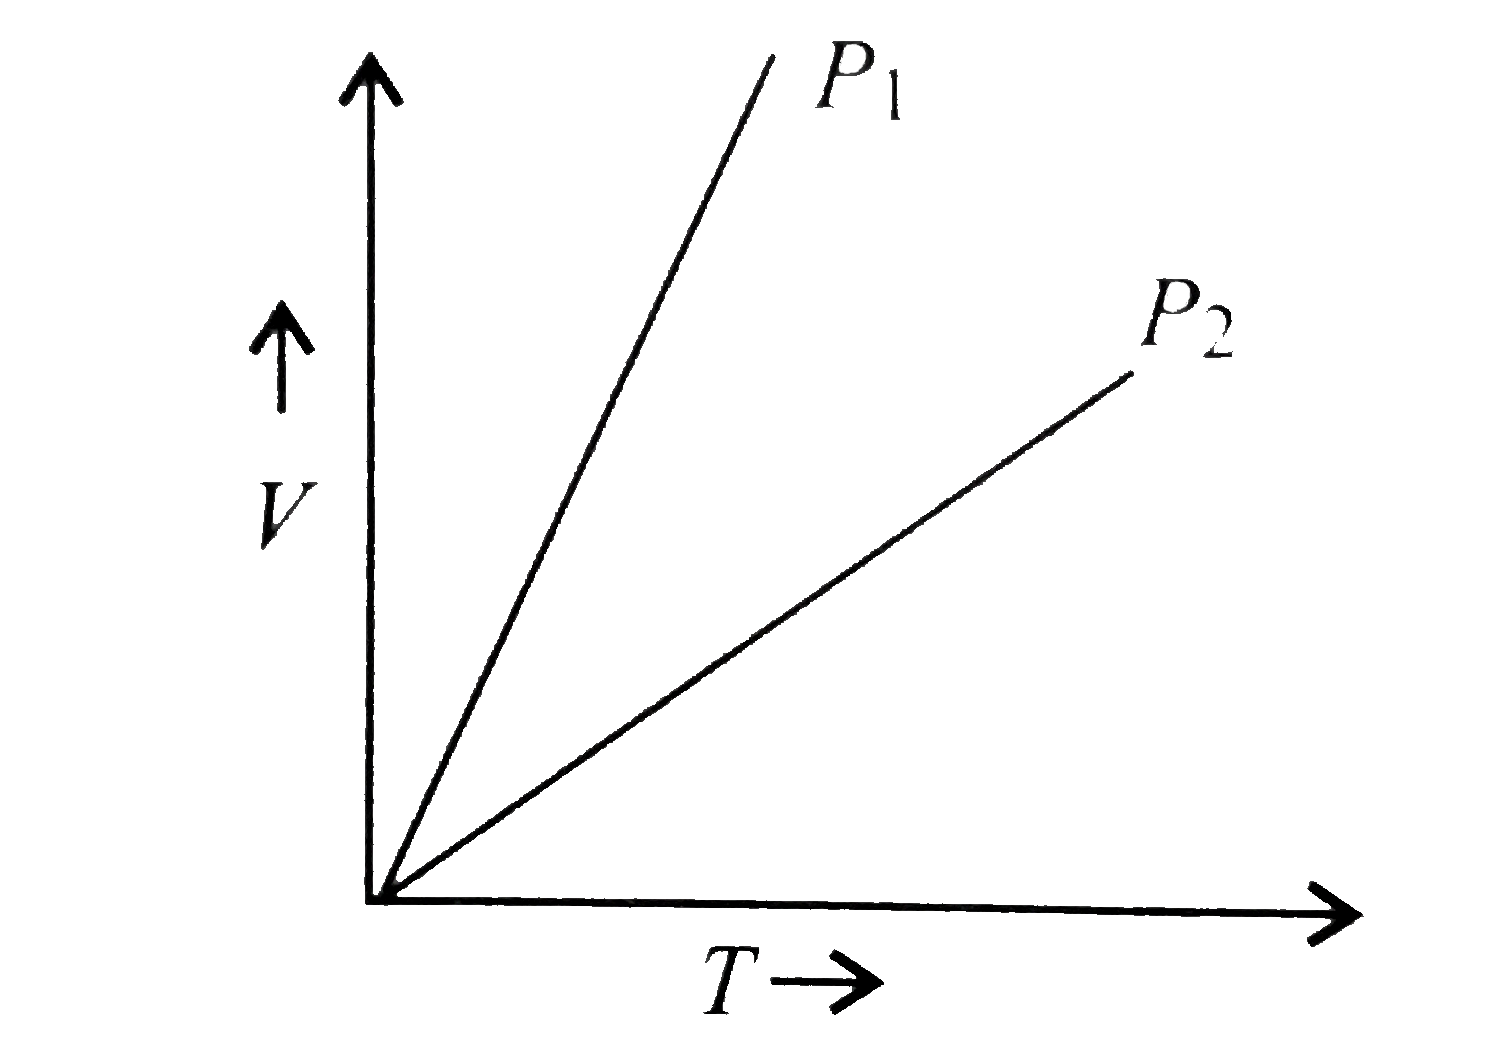
V vs T curves at constant pressure P1 and P2 for an ideal gas are shown in the figure. Which of the following is correct?

View SolutionWhich one of the following is the correct PV vs P plot at constant temperature for an ideal gas ? (P and V stand for pressure and volume of the gas respectively)
View Solution
Knowledge Check
V vs T curves at constant pressure P1 and P2 for an ideal gas are shown below

Which is correct ?AP1>P2BP1<P2CP1=P2DAll of the aboveSTATEMENT-1 : Plot of P vs 1/V (volume) is a straight line for an ideal gas.
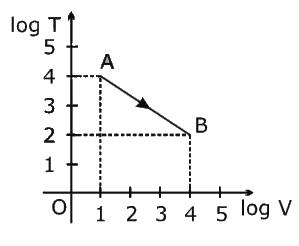
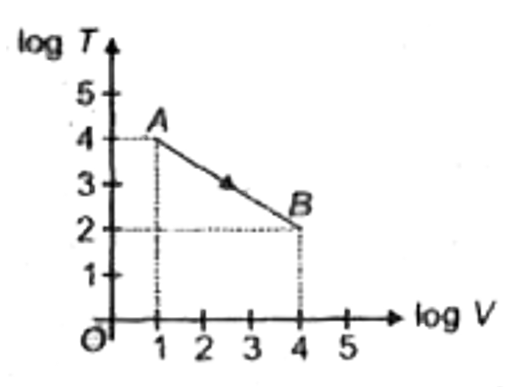
STATEMENT-2 : Pressure is directly proportional to volume for an ideal gas.AIf both the statement are TRUE and STATEMENT-2 is the correct explanation of STATEMENT-1BIf both the statement are TRUE but STATEMENT-2 is NOT the correct explanation of STATEMENT-1CIf STATEMENT-1 is TRUE and STATEMENT-2 is FALSEDIf STATEMENT-1 is FALSE and STATEMENT-2 is TRUEFigure shows, the adiabatic curve on a log T and log V scale performed on ideal gas. The gas is -
 AMonatomicBDiatomicCPolyatomicDMixture of monatomic and diatomic
V vs T curves at constant pressure P1 and P2 for an ideal gas are shown below

Which is correct ?
View SolutionSTATEMENT-1 : Plot of P vs 1/V (volume) is a straight line for an ideal gas.
STATEMENT-2 : Pressure is directly proportional to volume for an ideal gas.
View SolutionV vs T curves at different pressures P1 and P2 for an ideal gas are shown below:

Which one of the following is correct?
View SolutionV vs T curves at different pressures P1 and P2 for an ideal gas are shown below:

Which one of the following is correct?
View SolutionFigure shows , the adiabatic curve on log T and log V scale performed on ideal gas . The gas is

View Solution
