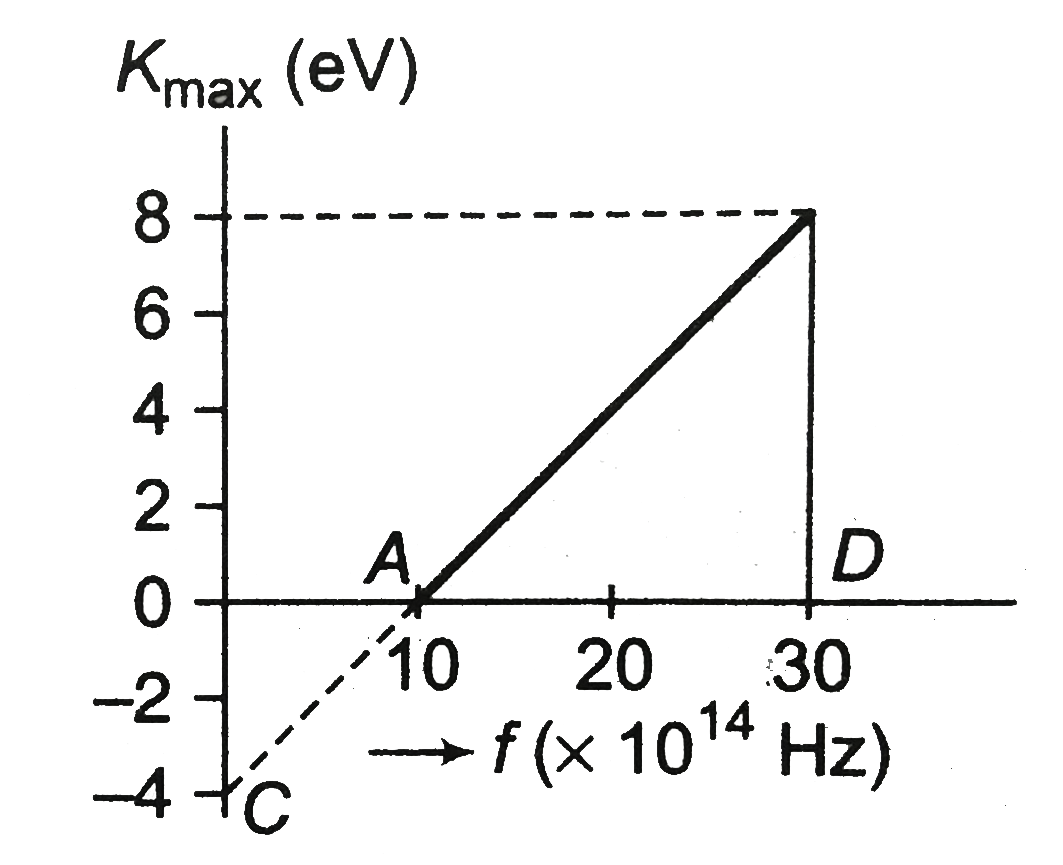
A graph regarding photoelectric effect is shwon between the maximum kinetic energy of electrons and the frequency of the incident light. On the basis of data as shown in the graph, calculate the work function

2eV
4 eV
4.2 eV
2.5 eV
From the graph threshold frquency (f0)=10×1014Hz
h=8×1.6×10−1920×1014=6.4×10⁻³⁴j
work function = hf0=4eV
Topper's Solved these Questions
- BOOK - NARAYNACHAPTER - DUAL NATURE OF RADIATION AND MATTEREXERCISE - ASSERTION AND REASON15videos
DUAL NATURE OF RADIATION AND MATTER
- BOOK - NARAYNACHAPTER - DUAL NATURE OF RADIATION AND MATTEREXERCISE - EXERCISE - 335videos
DUAL NATURE OF RADIATION AND MATTER
- BOOK - NARAYNACHAPTER - CURRENT ELECTRICITYEXERCISE - Level 643videos
CURRENT ELECTRICITY
- BOOK - NARAYNACHAPTER - DUAL NATUREEXERCISE - LEVEL-II (H.W)17videos
DUAL NATURE
Similar Questions
A graph regarding photoelectric effect is shown between the maximum kinetic energy of electrons and the frequency of the incident light. On the basis of data as shown in the graph, calculate (a) threshold frequency , (b) work- function, (c ) planck constant
 View Solution
A graph regarding photoelectric effect is shown between the maximum kinetic energy of electrons and the frequency of the incident light. On the basis of data as shown in the graph, calculate (a) threshold frequency , (b) work- function, (c ) planck constant
 View Solution
Knowledge Check
- Question 1 - Select One
According to Einstein's photoelectric equation , the graph between the kinetic energy of photoelectrons ejected and the frequency of incident radiation is
A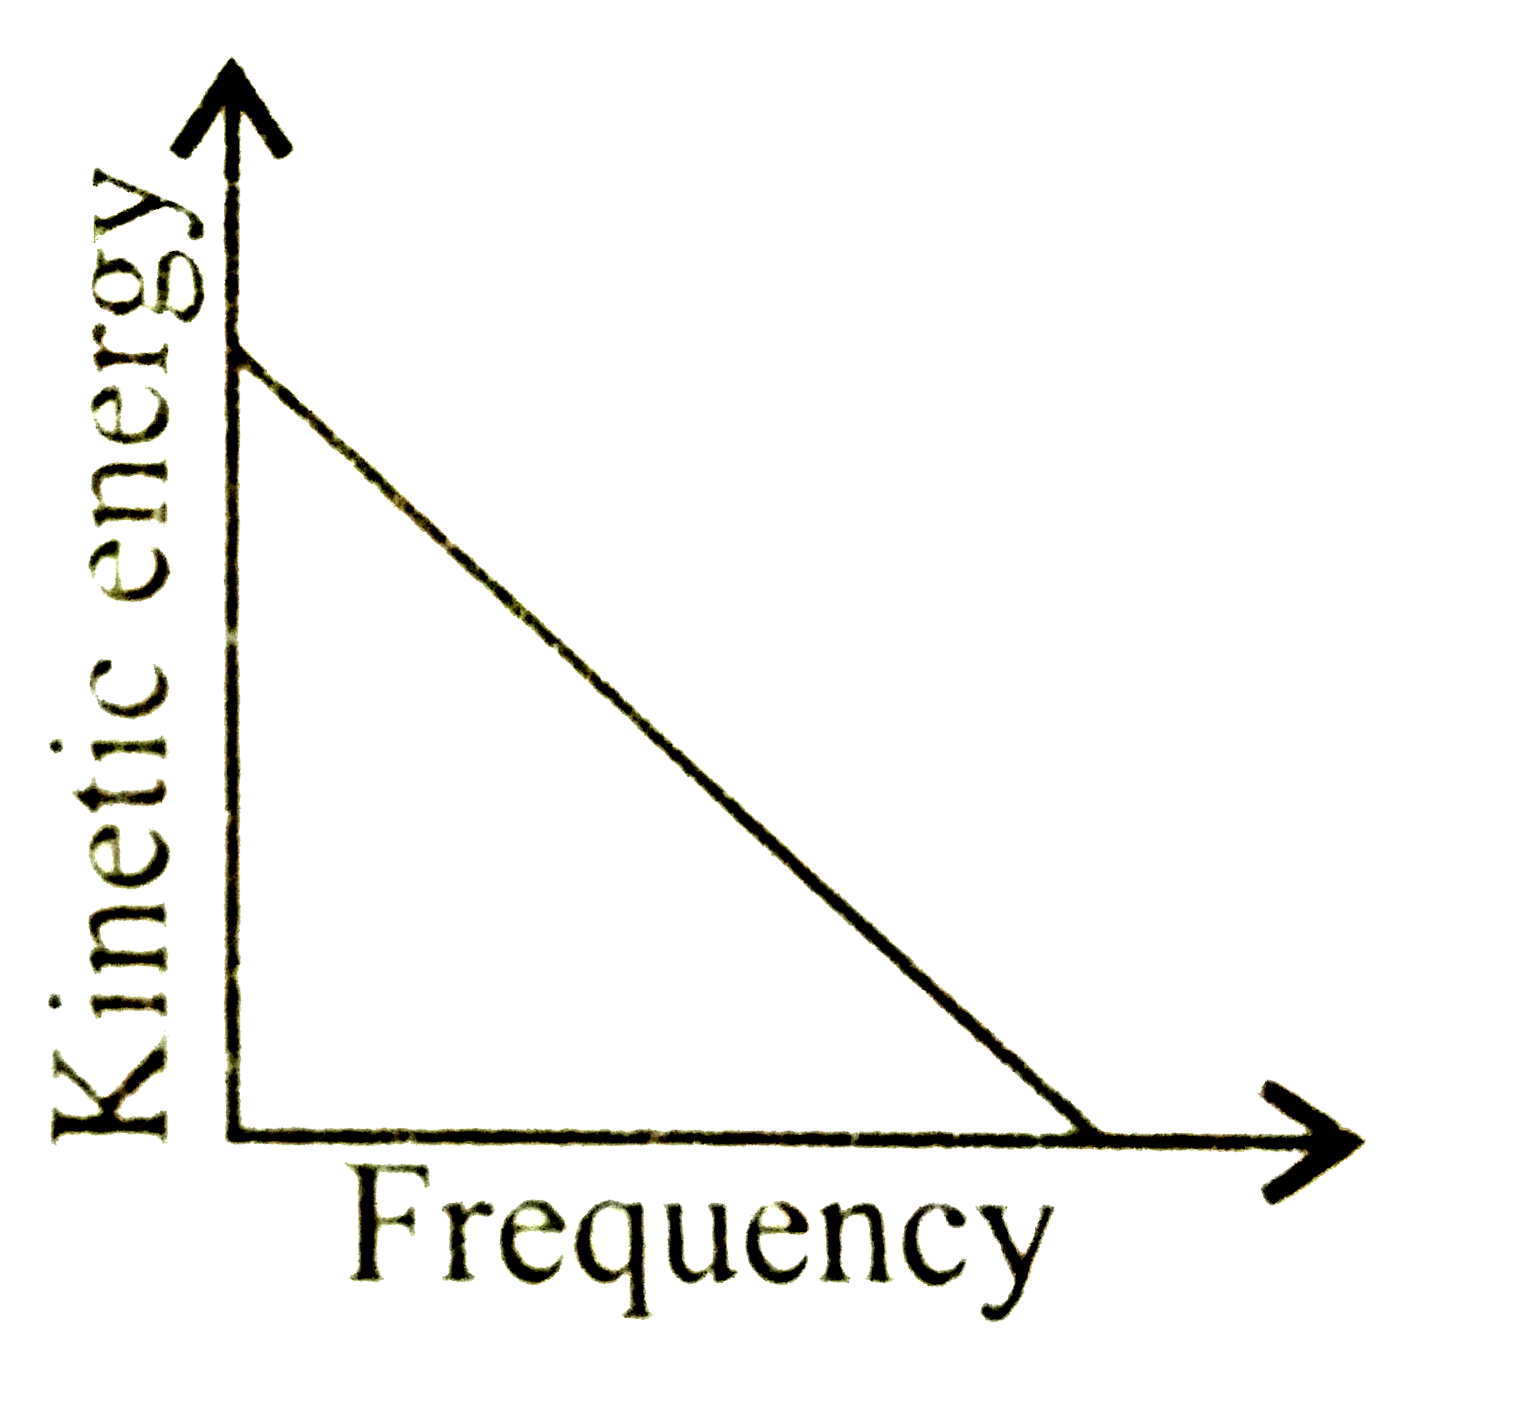 B
B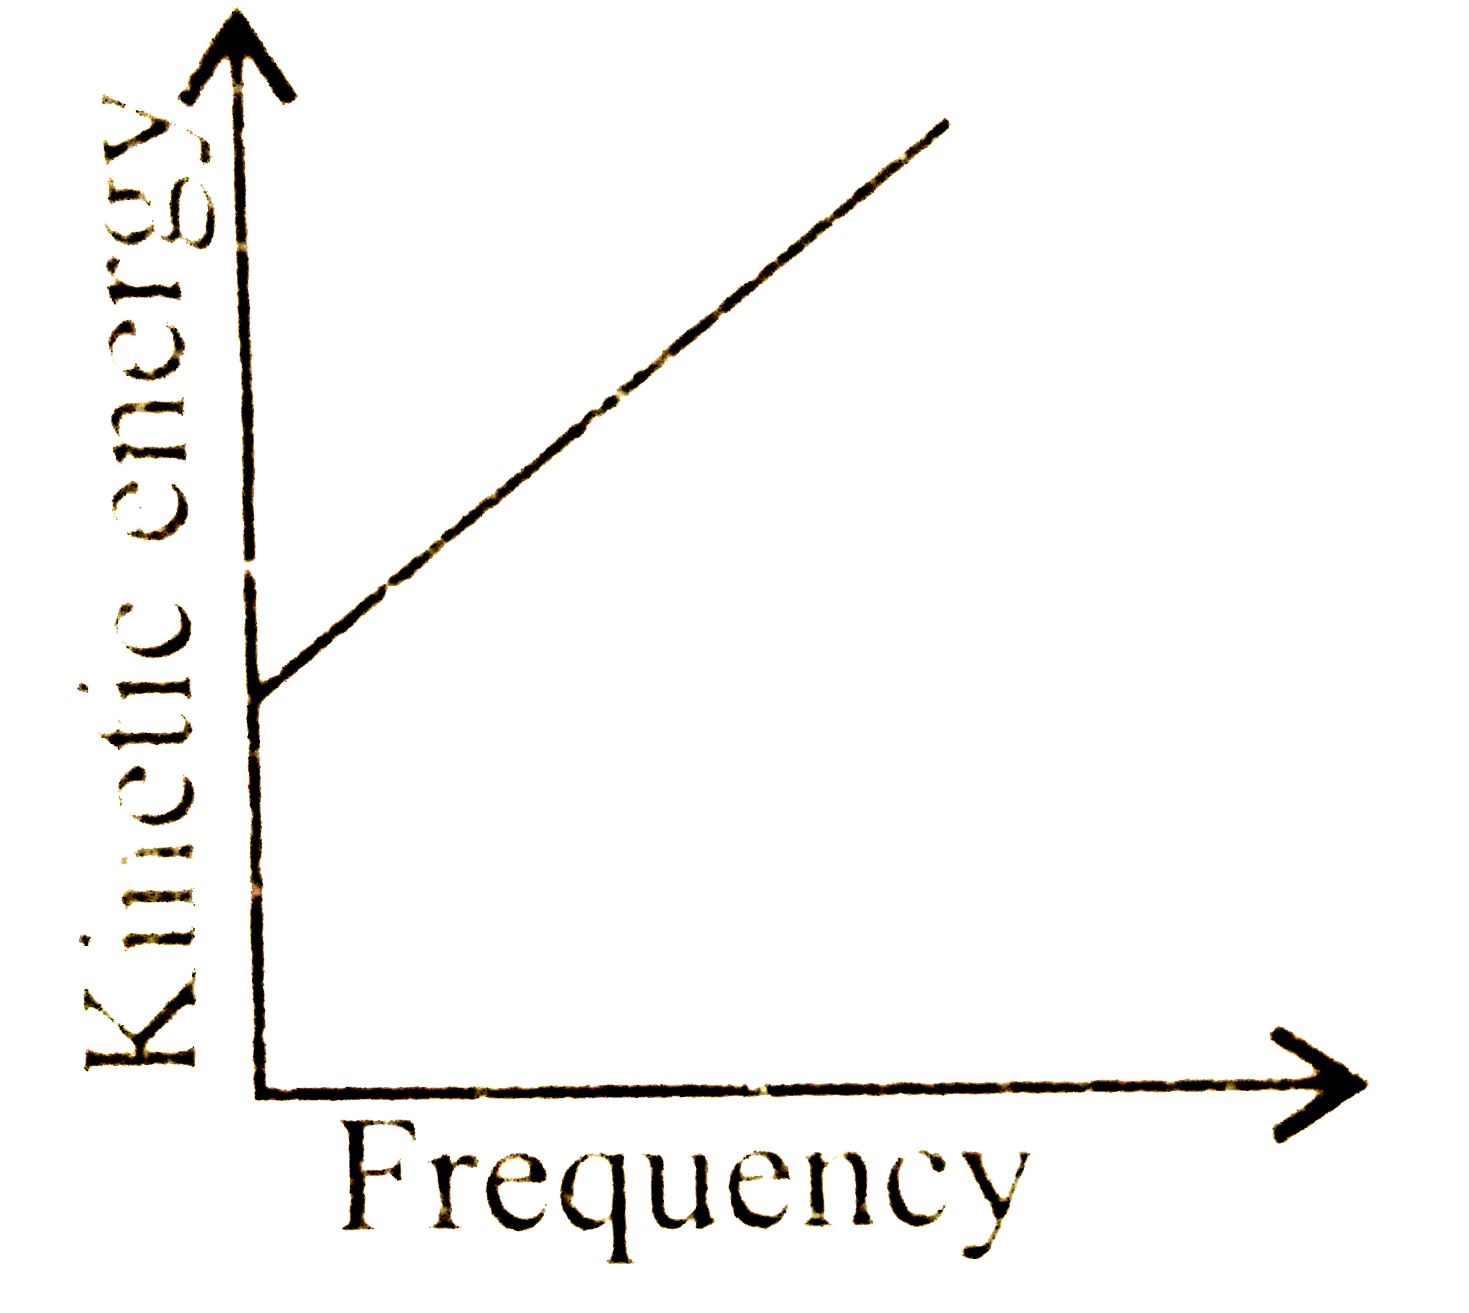 C
C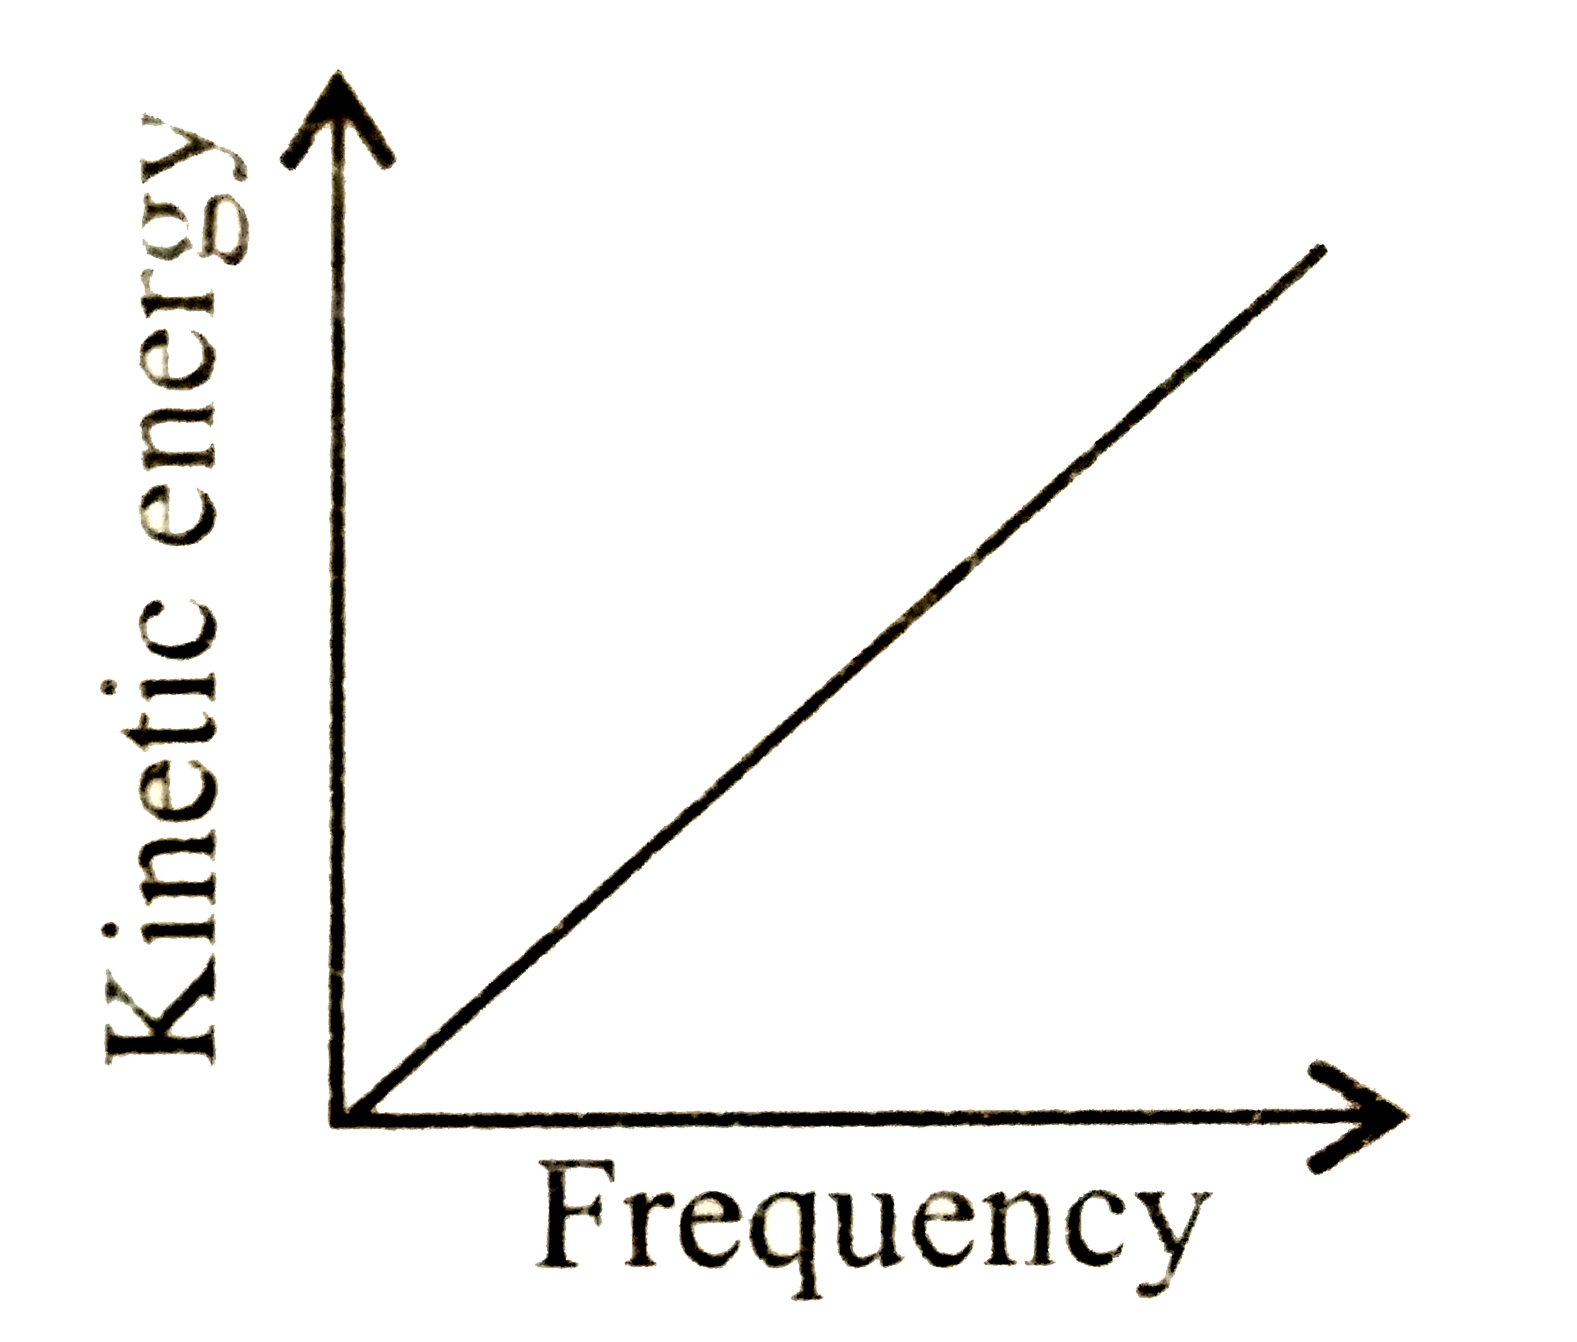 D
D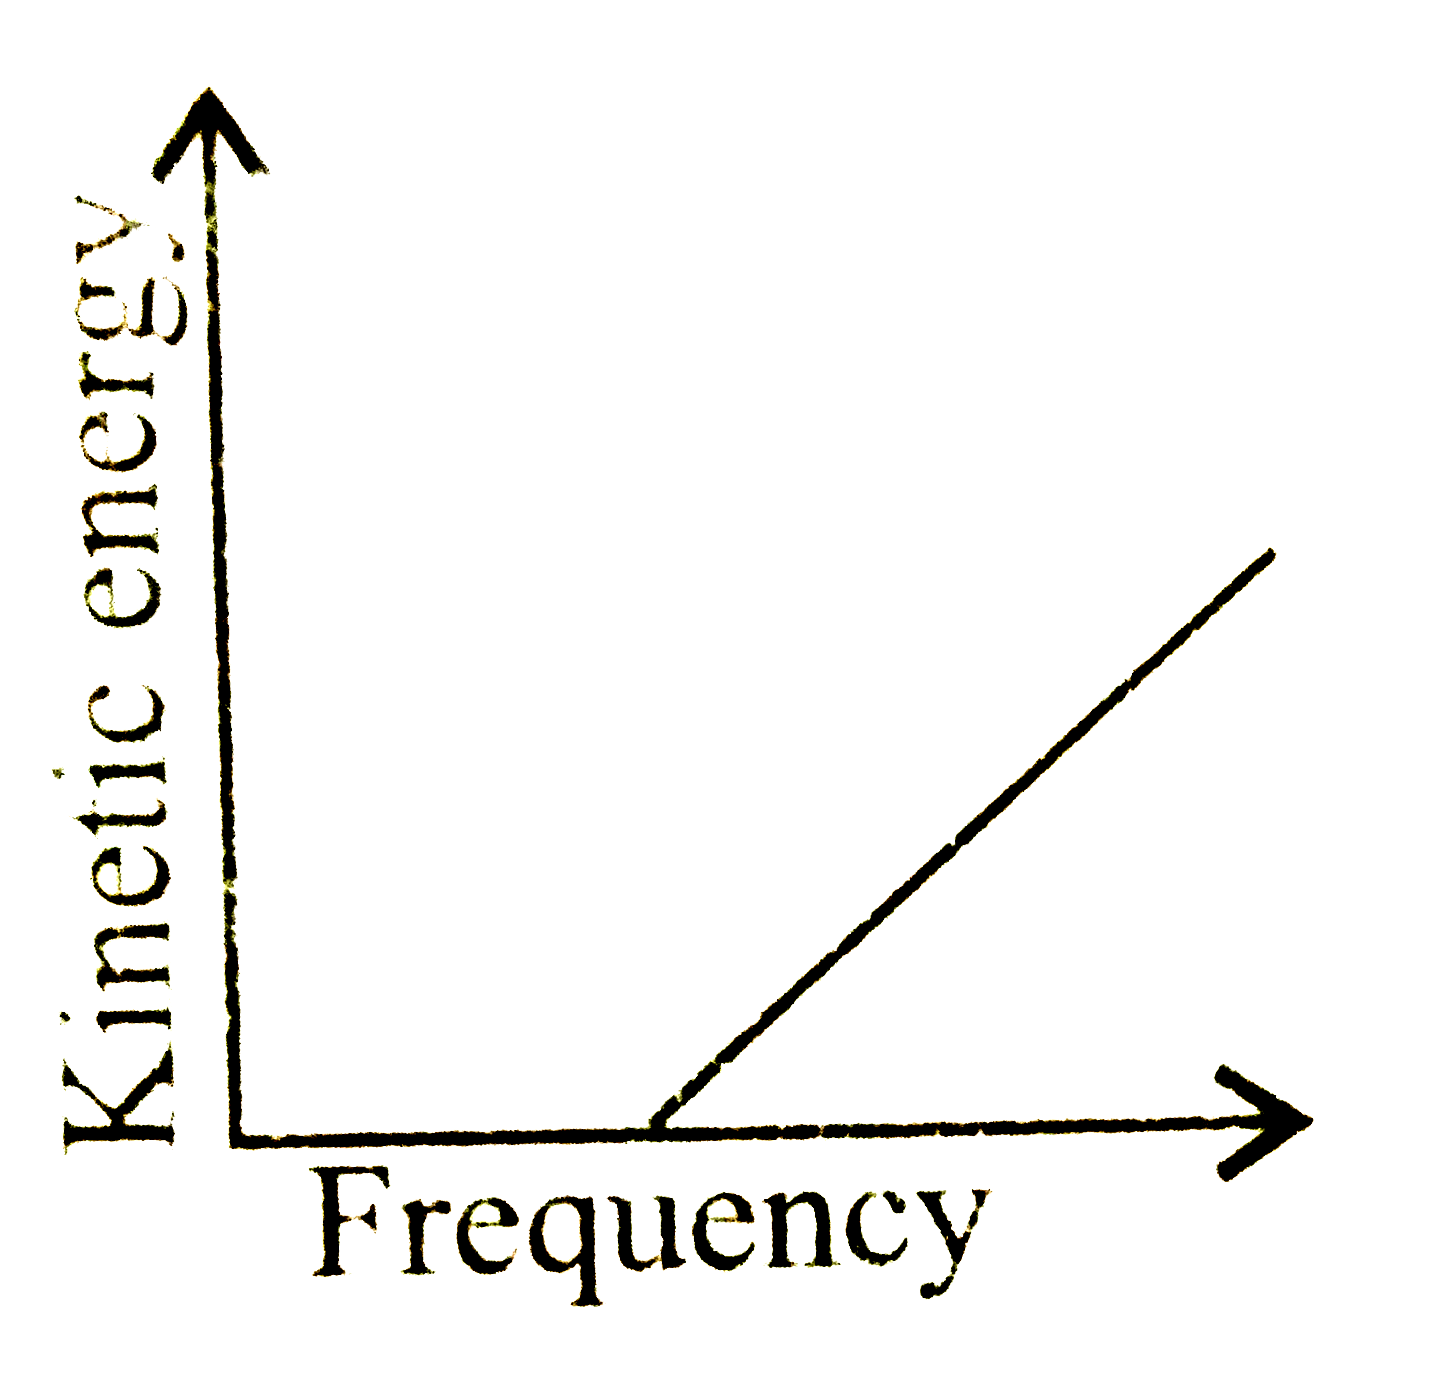
- Question 2 - Select One
According to Einstein's photoelectric equation, the graph between the kinetic energy of photoelectrons ejected and the frequency of incident radiation is
A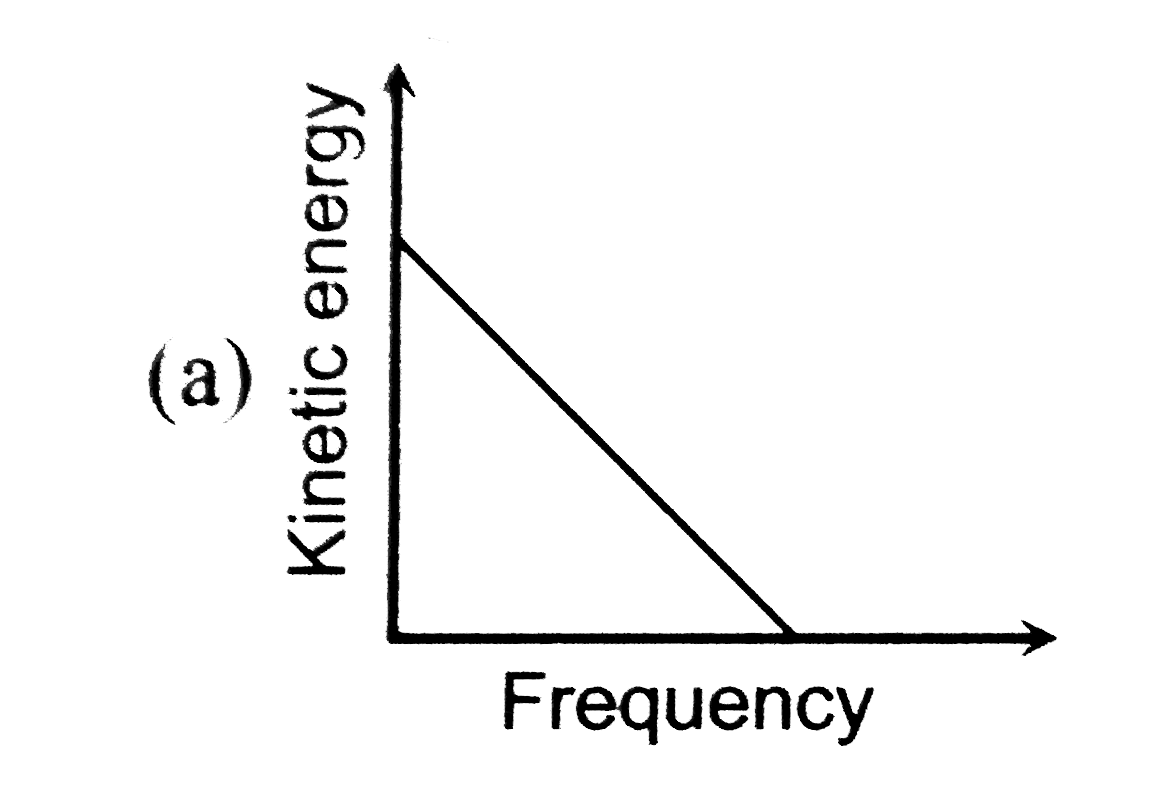 B
B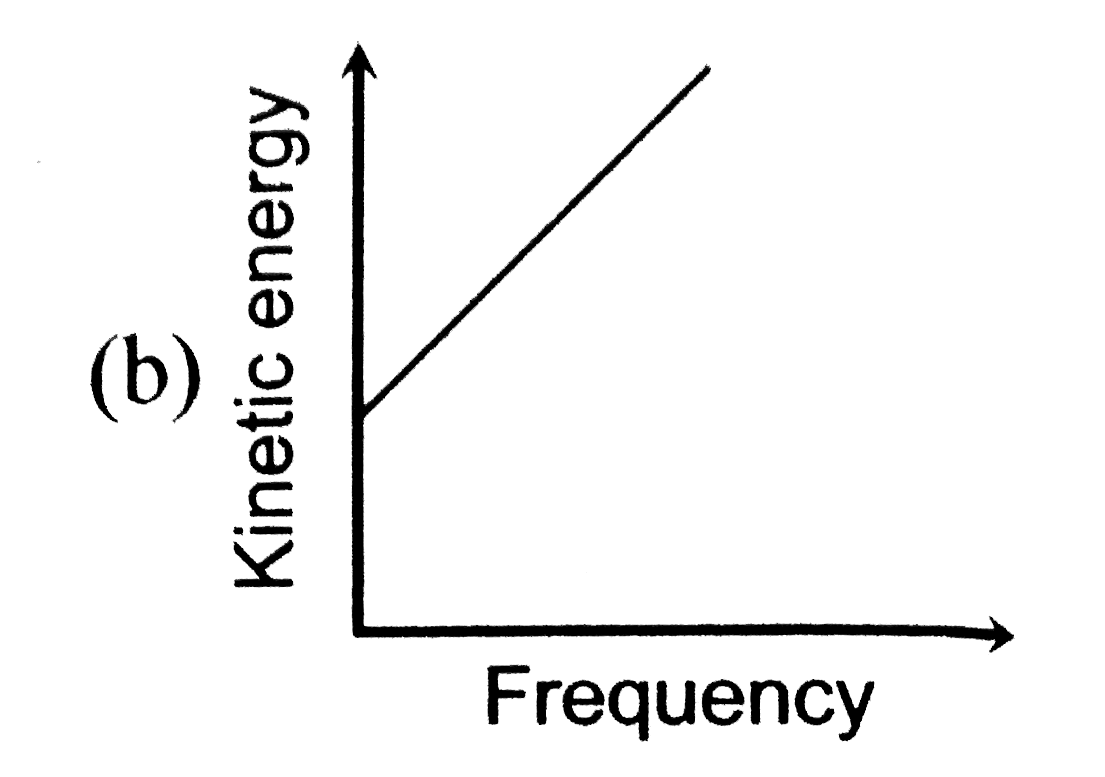 C
C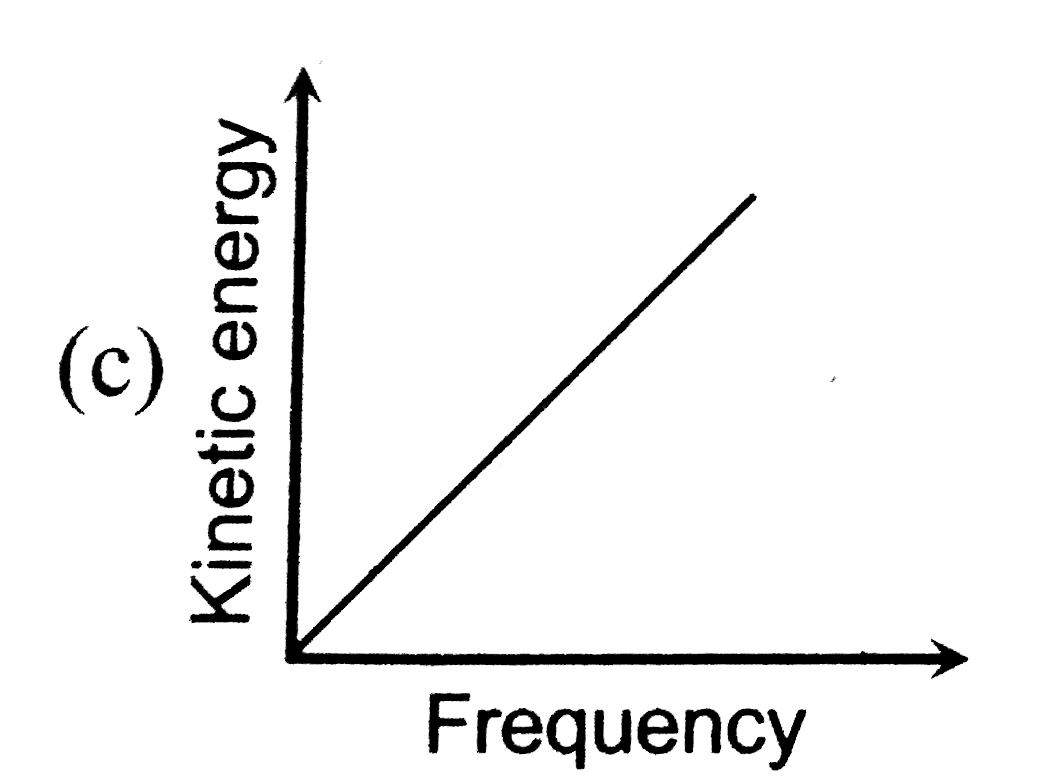 D
D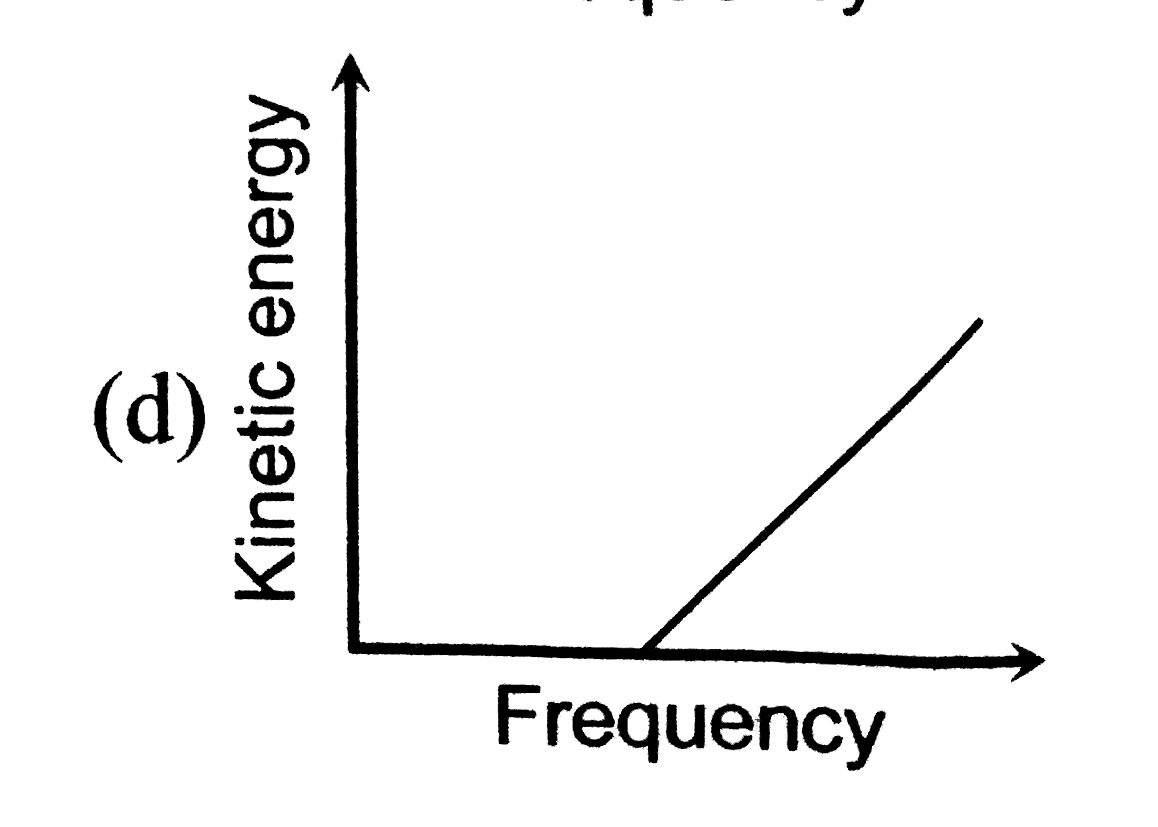
- Question 3 - Select One
For the photoelectric effect, the maximum kinetic energy Ek of the emitted photoelectrons is plotted against the frequency ν of the incident photons as shown in the figure. The slope of the curve gives
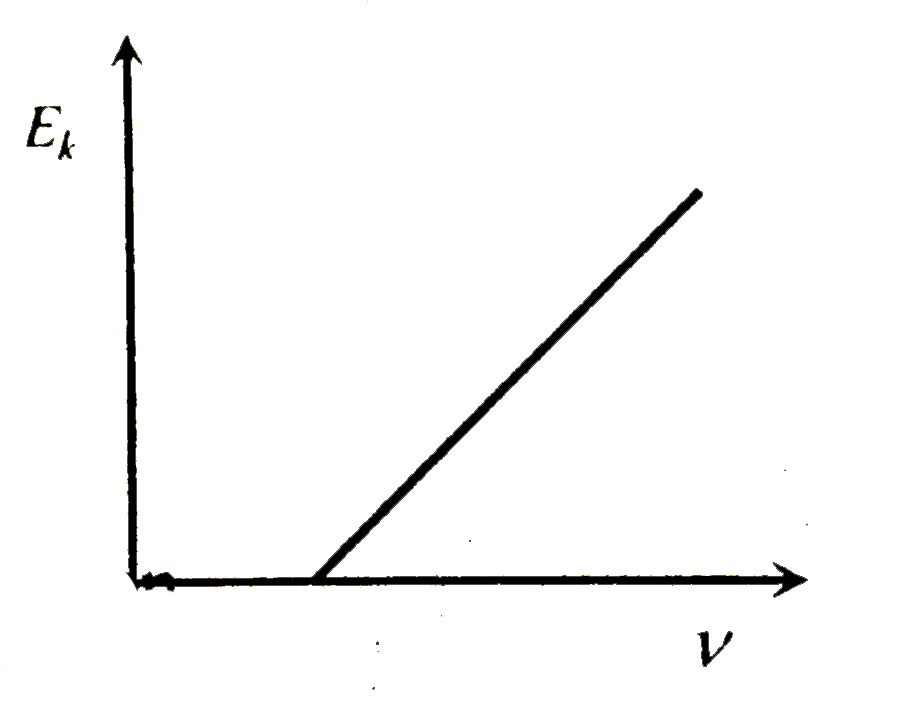 ACharge of the electronBWork function of the metalCPlanck's constantDRatio of the Planck’s constant to electronic charge
In an experiment of photo-electric effect, the graph of maximum kinetic energy Ek of the emitted photoelectrons versus the frequency v of the incident light is a straight line AB as shown in figure below :
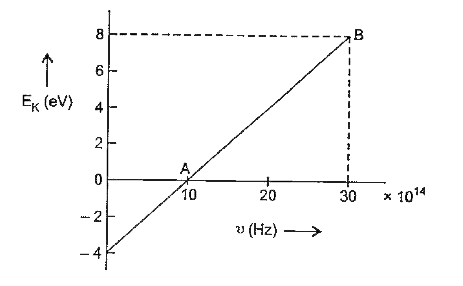
Work function of the metal.View SolutionAccording to Einstein's photoelectric equation, the graph between kinetic energy of photoelectrons ejected and the frequency of the incident radiation is :
View SolutionAccording to Einstein's photoelectric equation, the graph between kinetic energy of photoelectrons ejected and the frequency of the incident radiation is :
View SolutionFor the photoelectric effect, the maximum kinetic energy Ek of the emitted photoelectrons is plotted against the frequency of the incident photons as shown in the figure. The slope of the curve gives
 View Solution
If the frequency of light in a photoelectric experiment is double then maximum kinetic energy of photoelectron
View Solution
