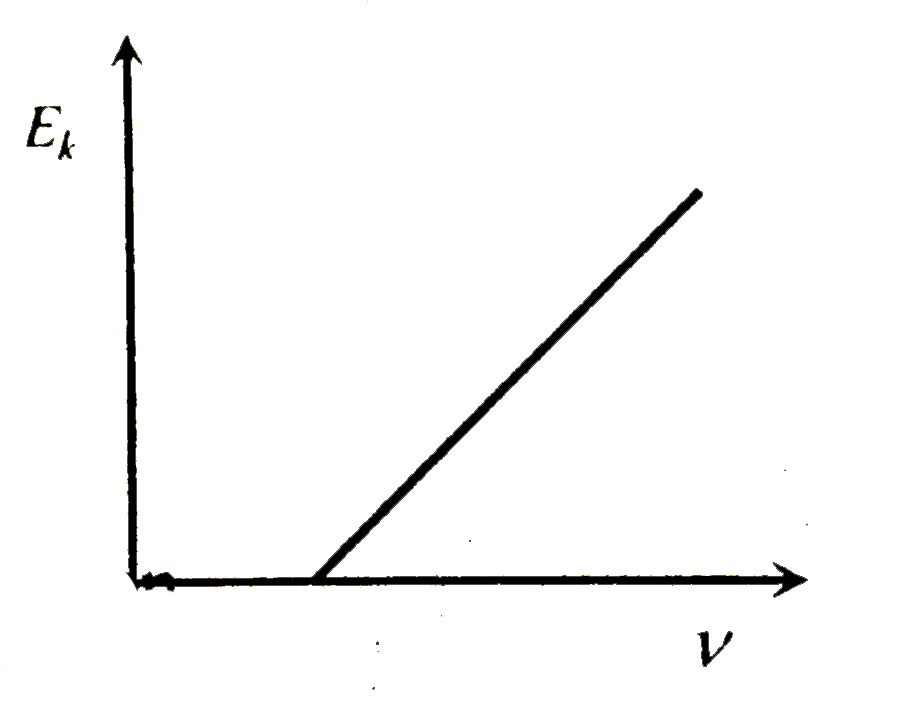
According to Einstein's photoelectric equation, the graph between kinetic energy of photoelectrons ejected and the frequency of the incident radiation is :
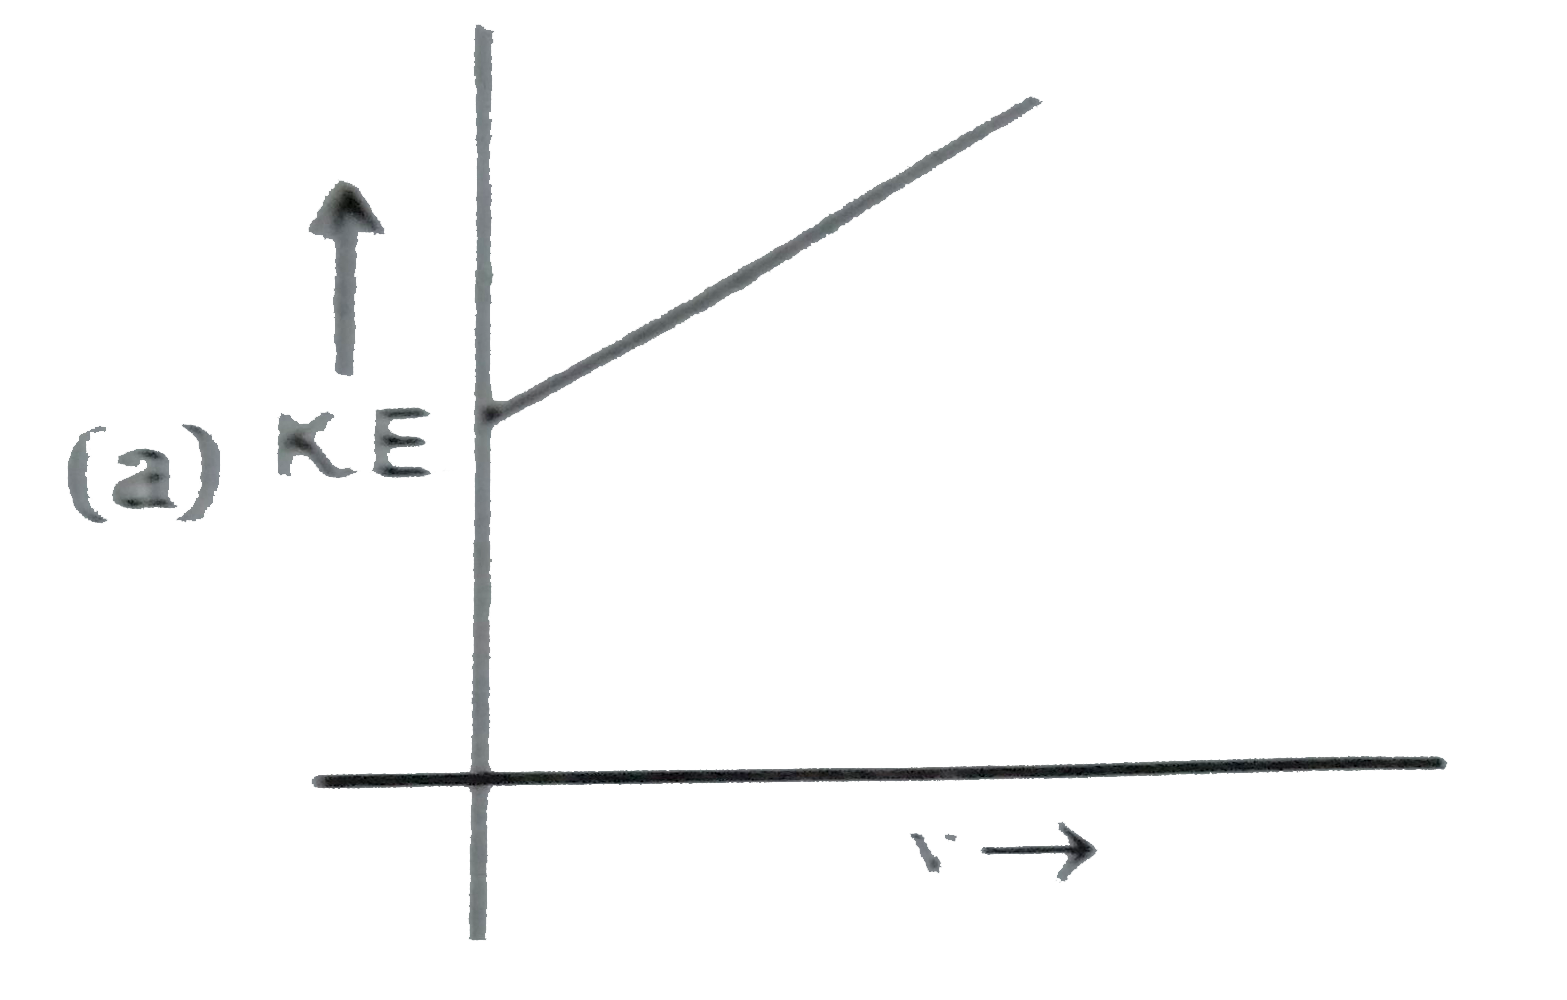
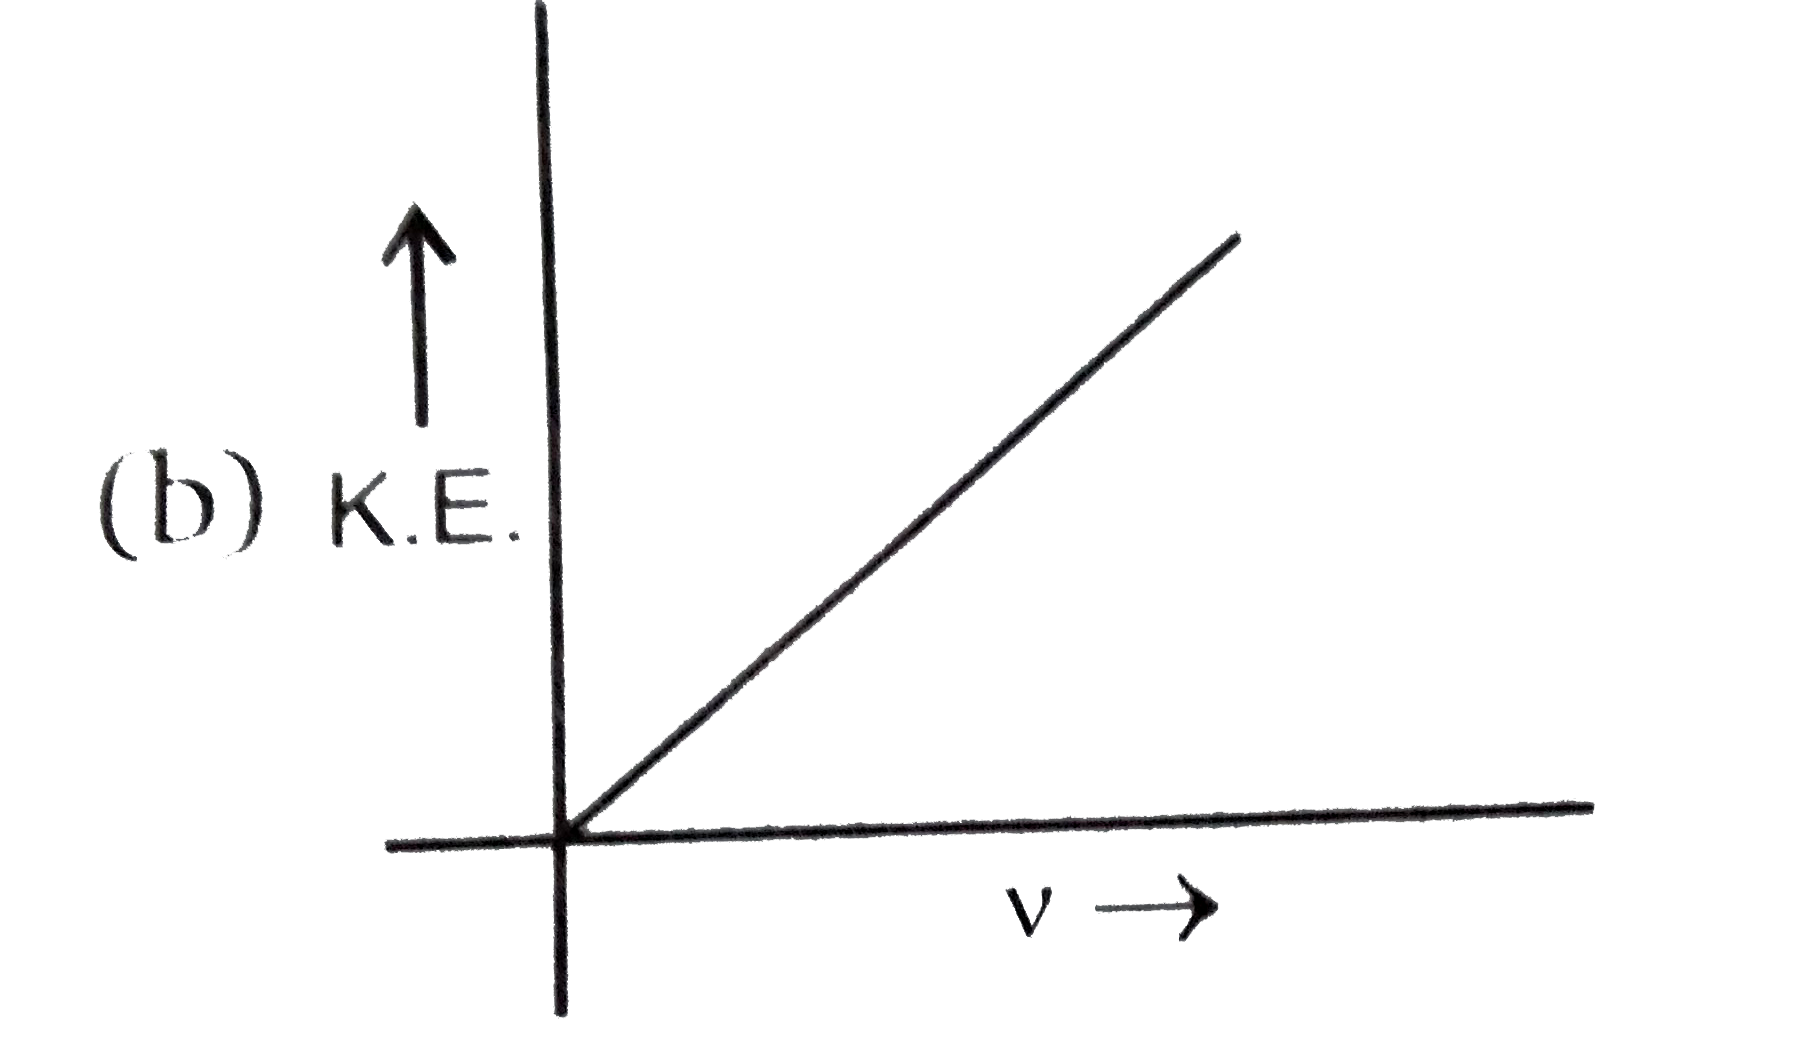
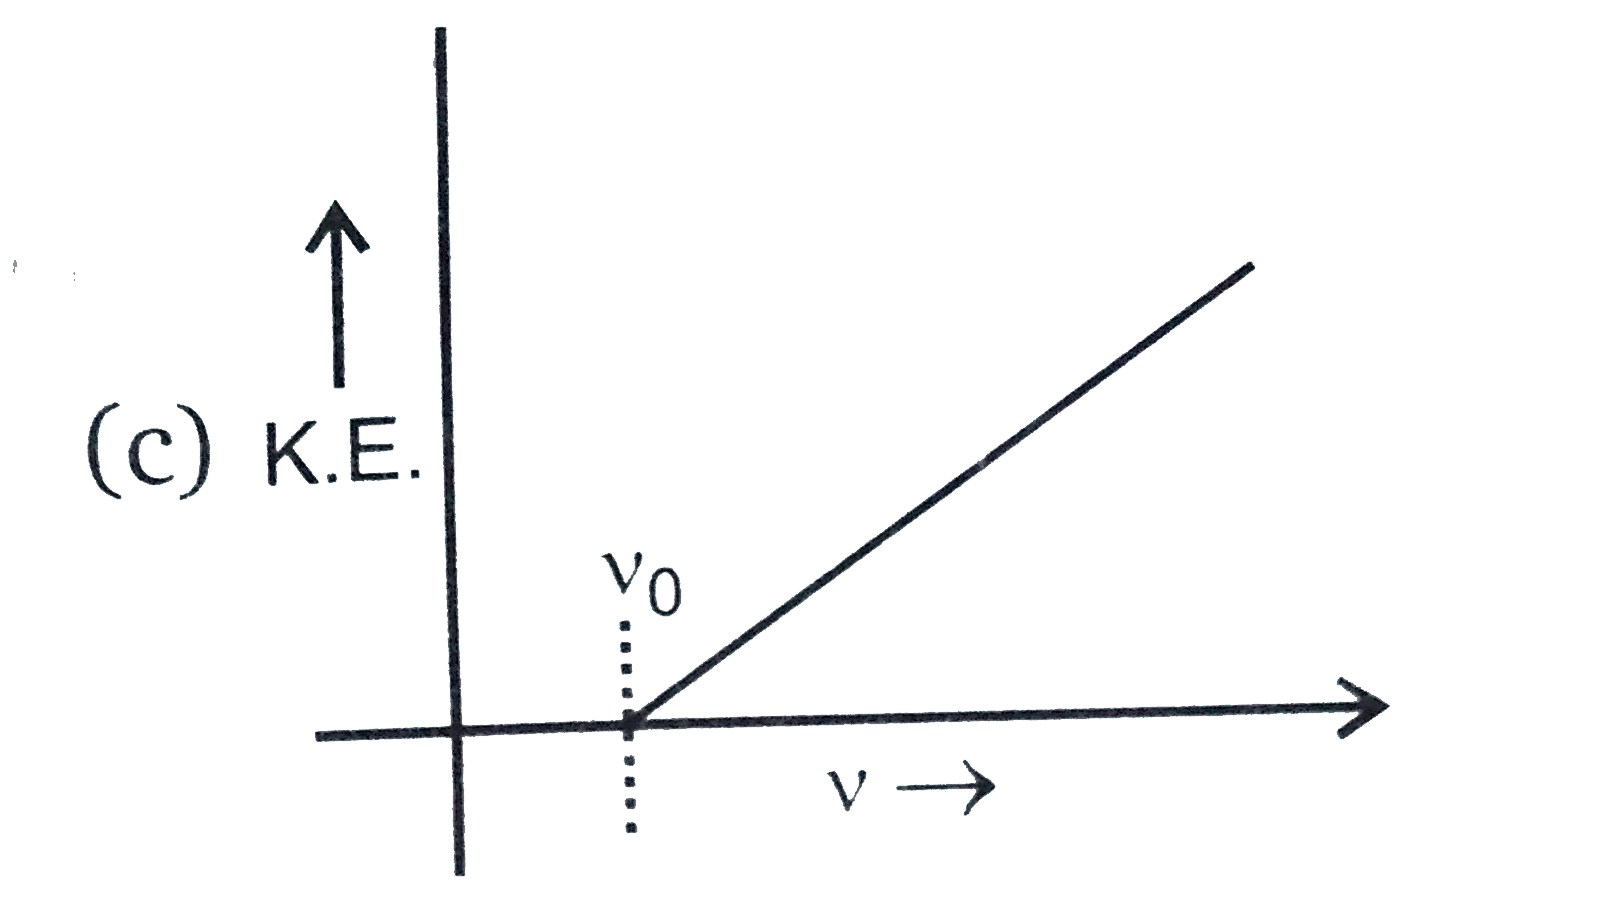
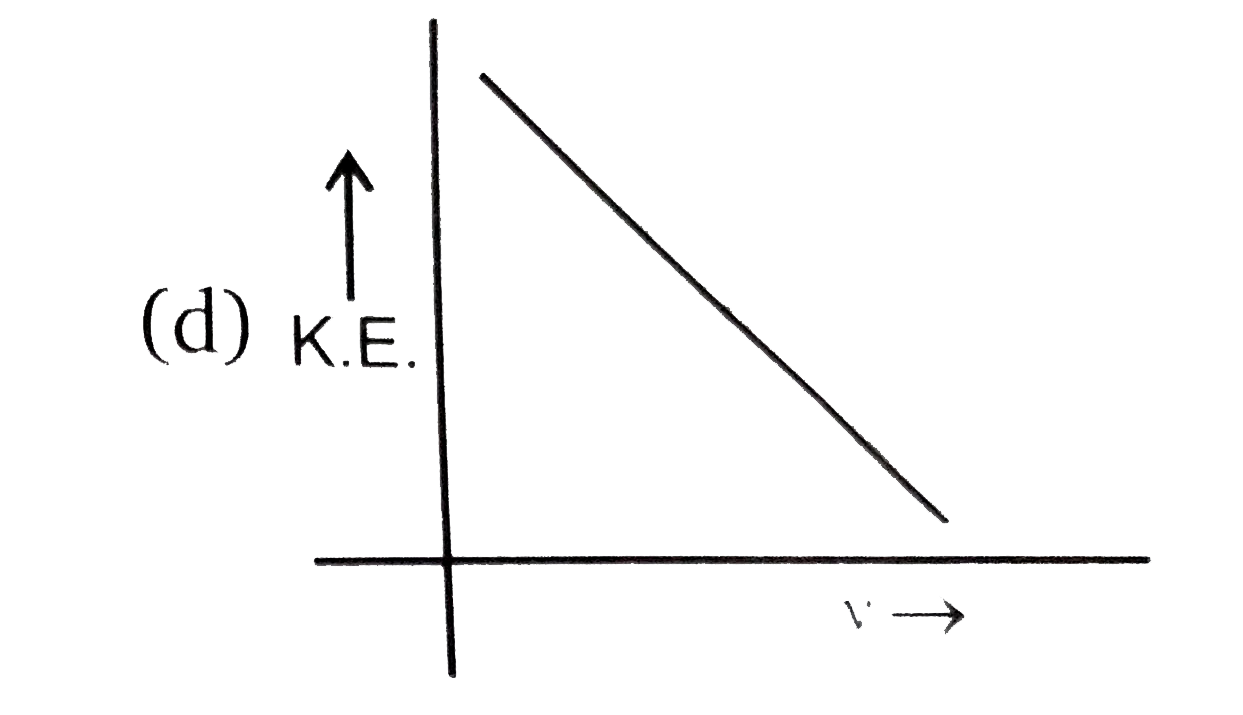
The correct Answer is:C
Step by step video & image solution for According to Einstein's photoelectric equation, the graph between kinetic energy of photoelectrons ejected and the frequency of the incident radiation is : by Chemistry experts to help you in doubts & scoring excellent marks in Class 11 exams.
Updated on:21/07/2023Topper's Solved these Questions
- ATOMIC STUCTUREBOOK - NARENDRA AWASTHI ENGLISHCHAPTER - ATOMIC STUCTUREEXERCISE - level 2
30 Videos
- ATOMIC STUCTUREBOOK - NARENDRA AWASTHI ENGLISHCHAPTER - ATOMIC STUCTUREEXERCISE - Level 3 (Passage 1)
3 Videos
- CHEMICAL EQUILIBRIUMBOOK - NARENDRA AWASTHI ENGLISHCHAPTER - CHEMICAL EQUILIBRIUMEXERCISE - Match the column
1 Videos
Similar Questions
Knowledge Check
According to Einstein's photoelectric equation , the graph between the kinetic energy of photoelectrons ejected and the frequency of incident radiation is
A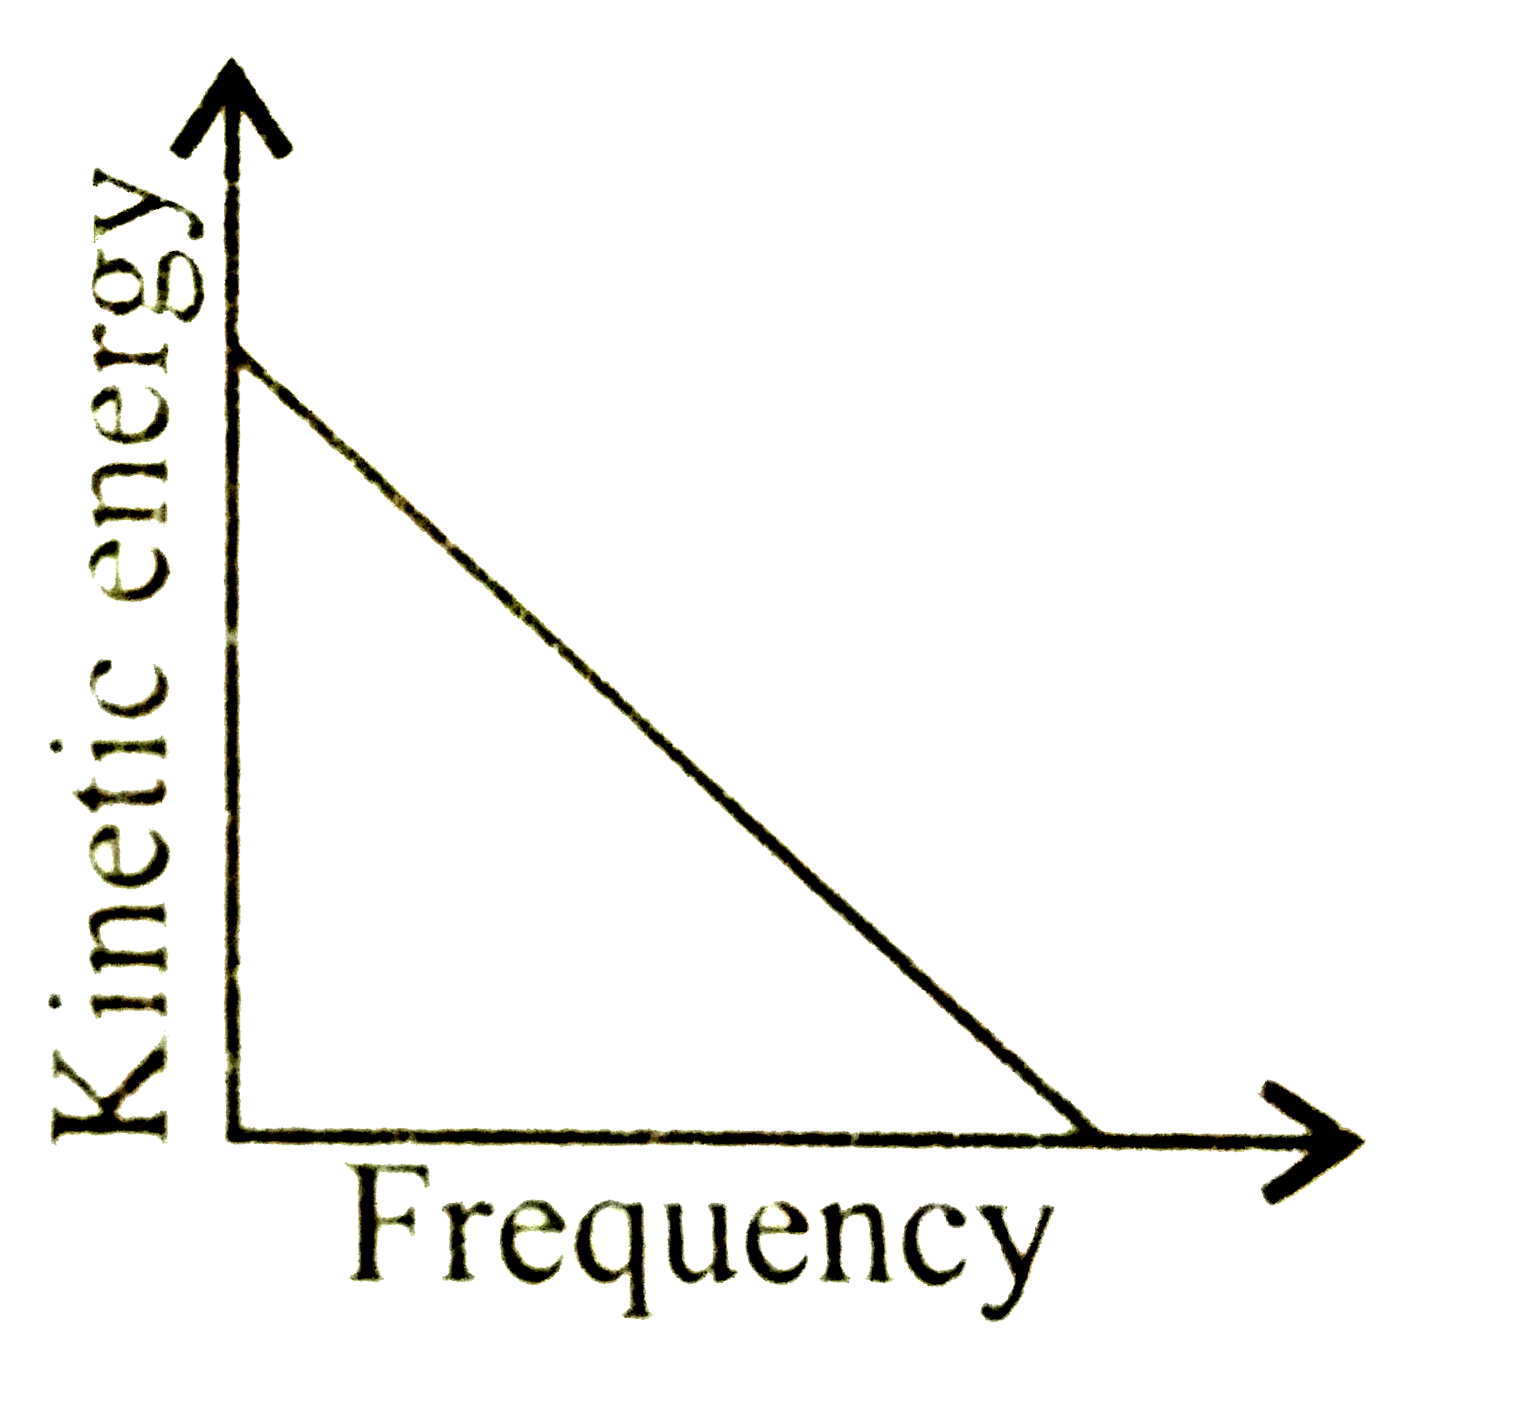 B
B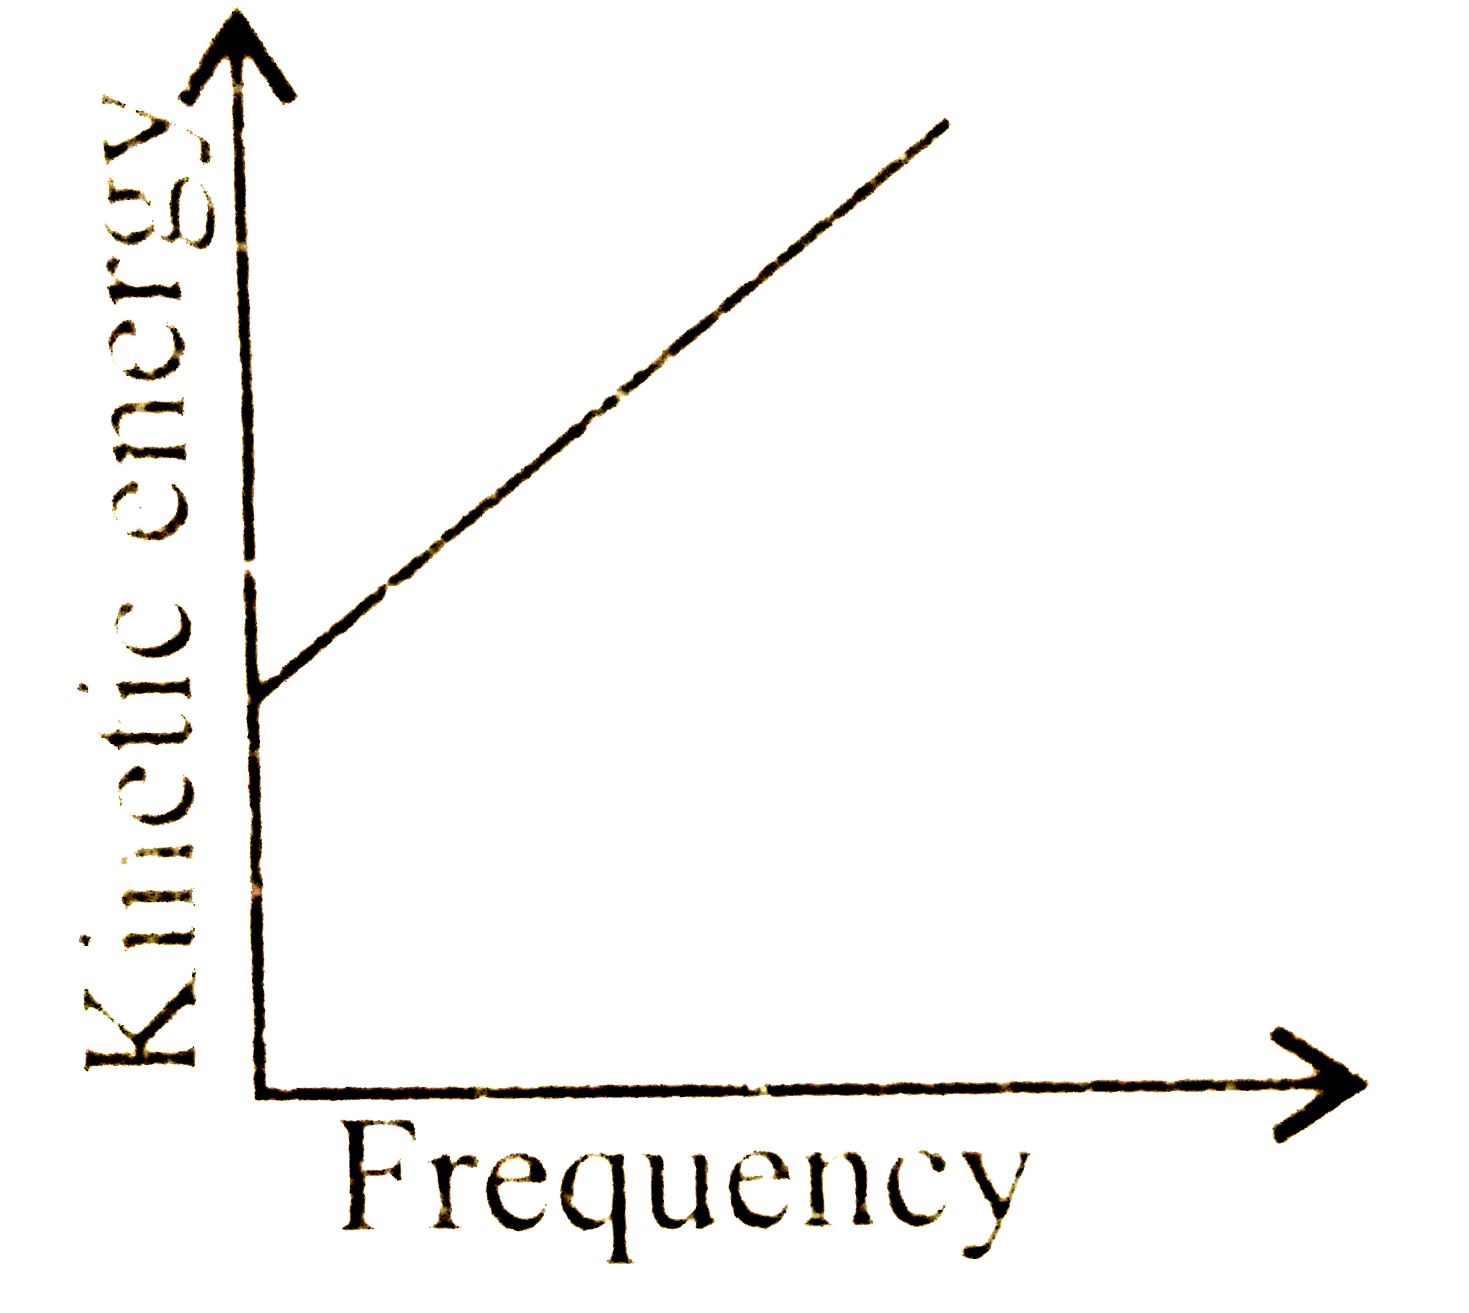 C
C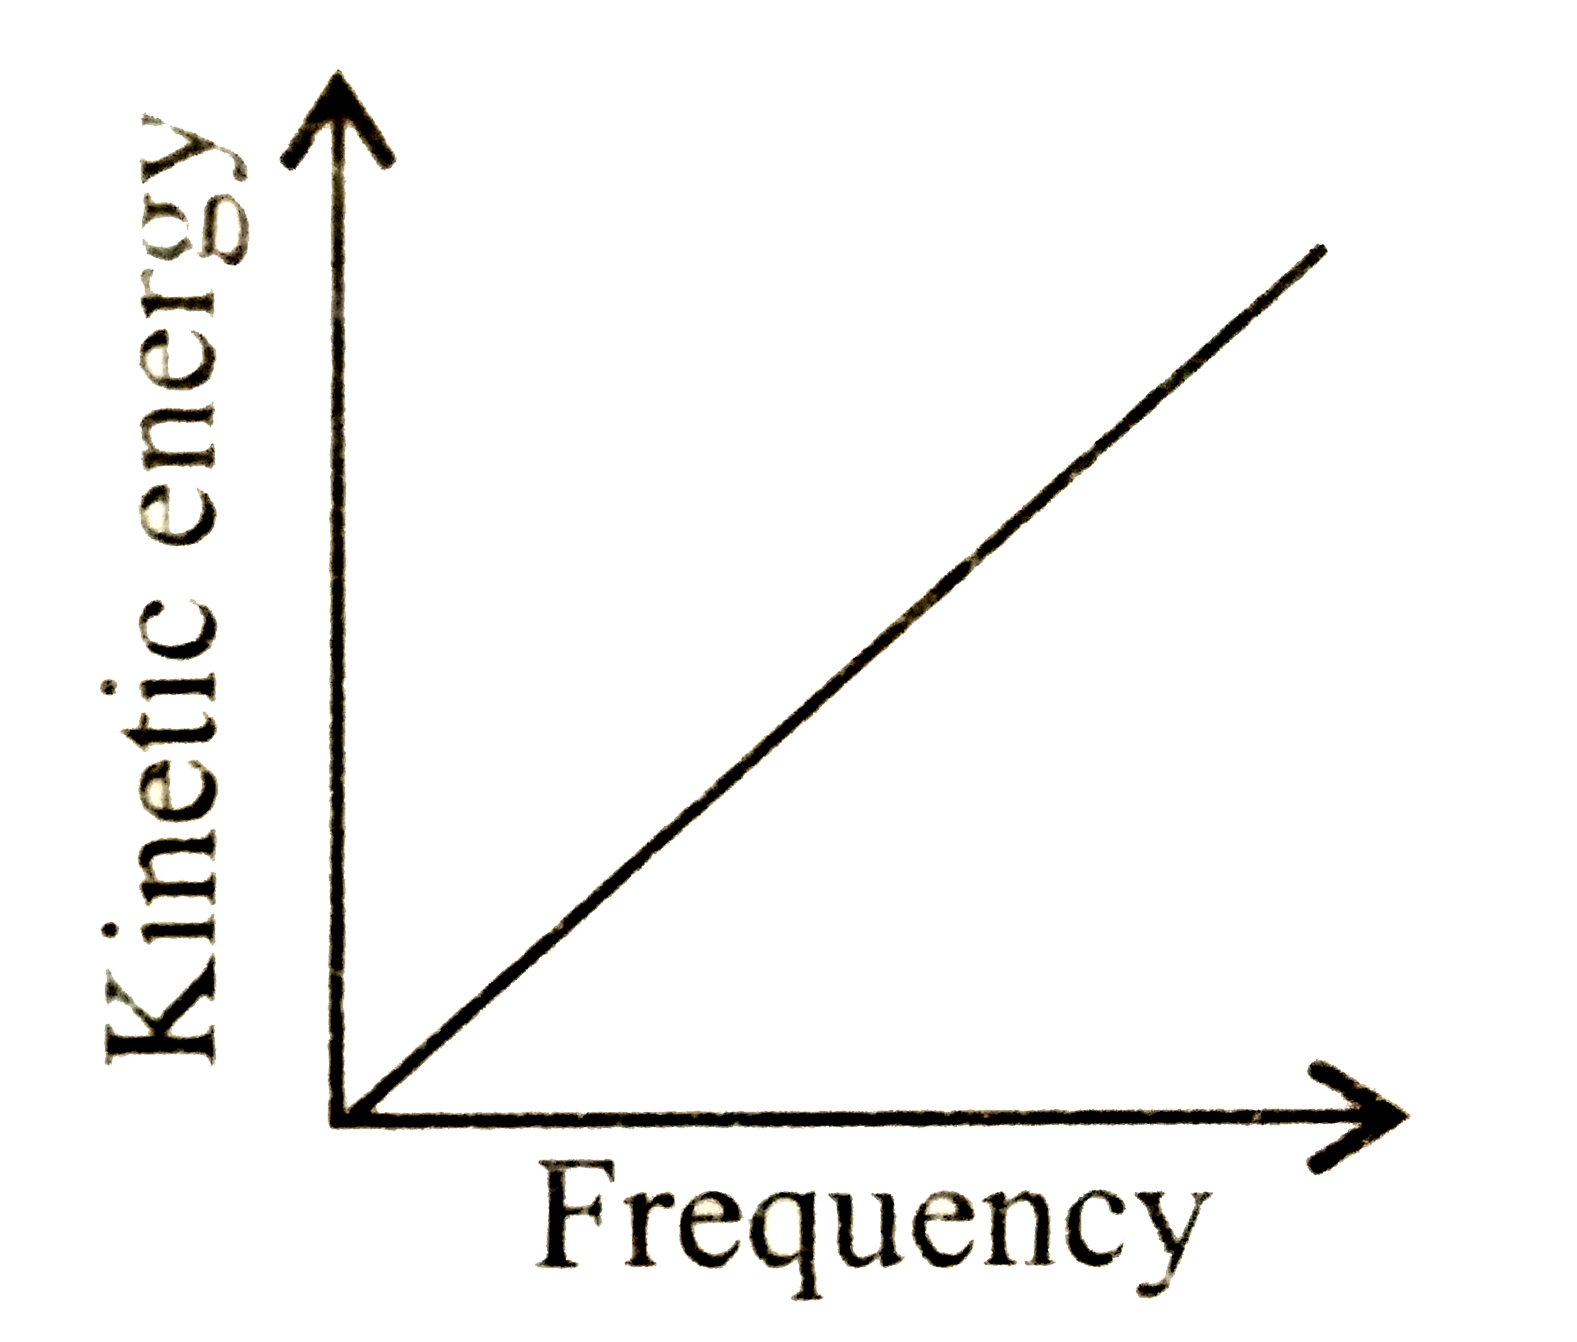 D
D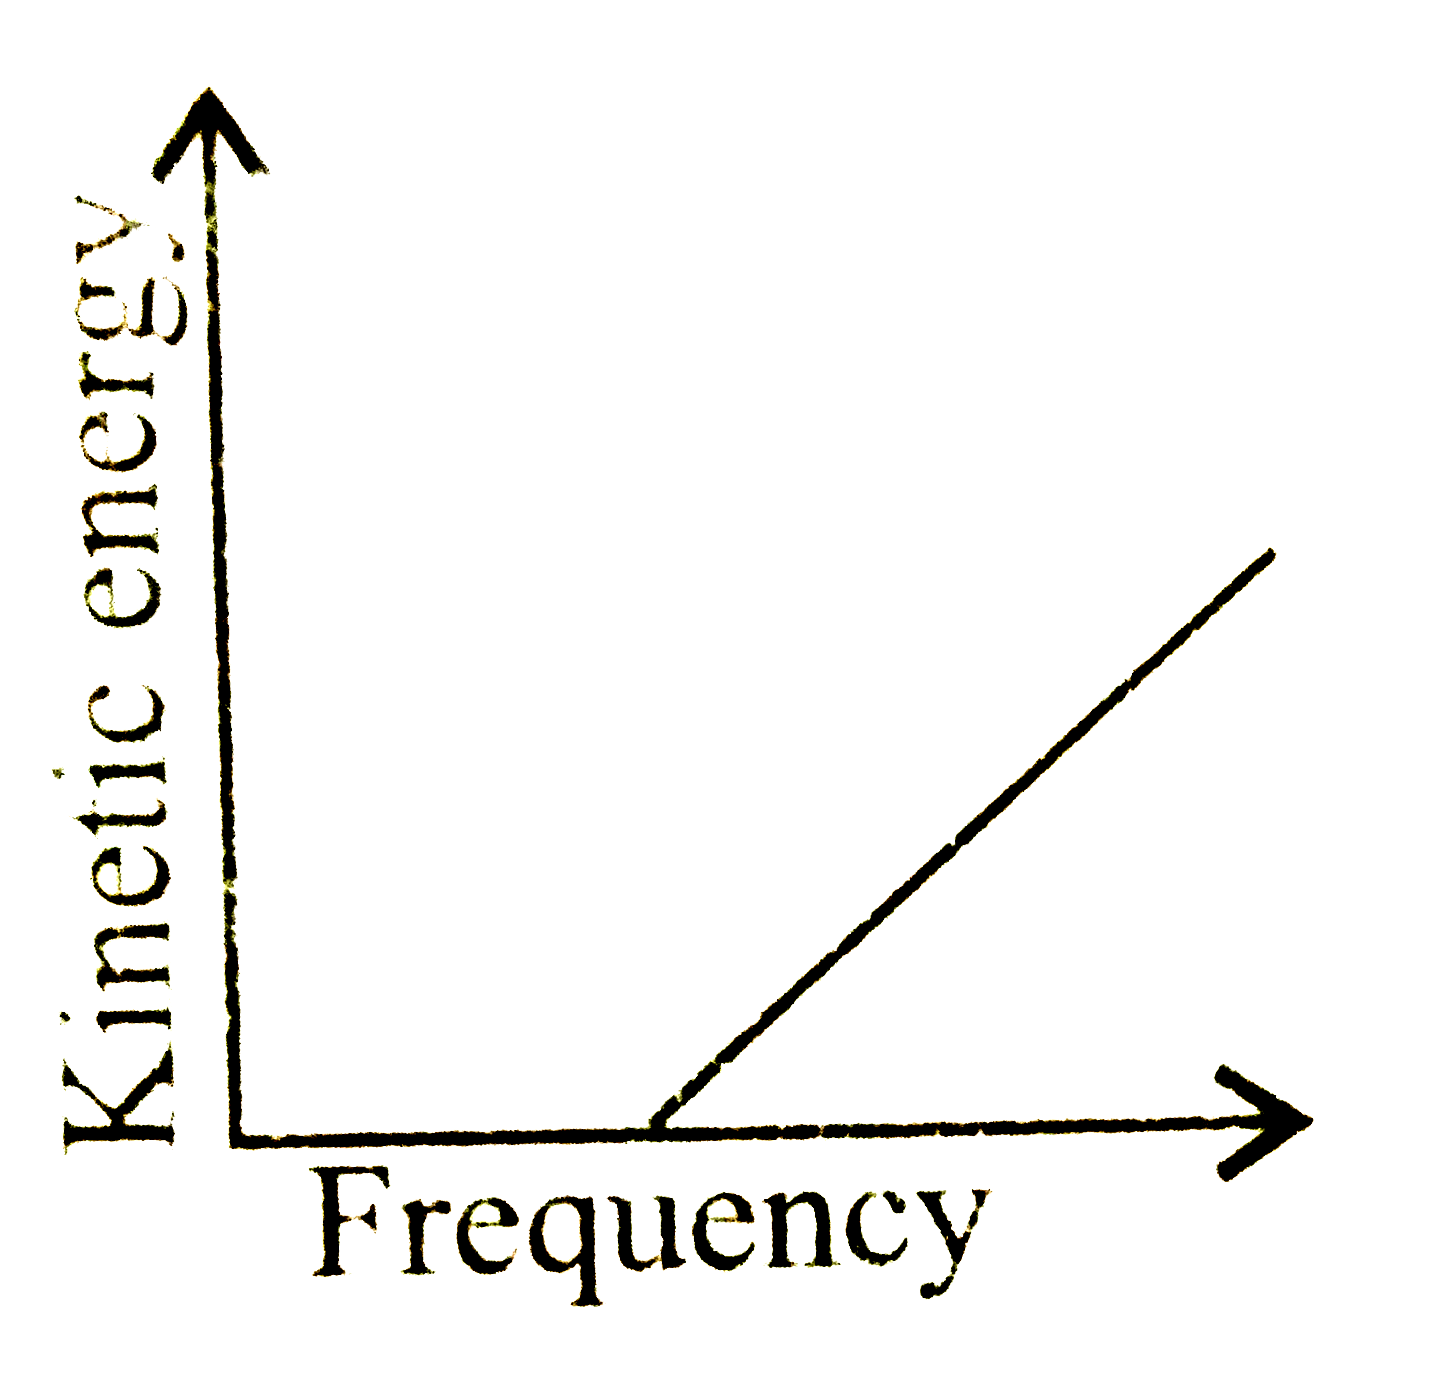
According to Einstein's photoelectric equation, the plot of the maximum kinetic energy of the emitted photoelectrons from a metal versus frequency of the incident radiation gives a straight line whose slope
Adepends on the intensity of incident radiation.Bdepends on the nature of the metal and also on the intensity of incident radiation.Cis same for all metals and independent of the intensity of the incident radiation.Ddepends on the nature of the metal.
Maximum kinetic energy (Ek) of a photoelectron varies with the frequency (v) of the incident radiation as
View SolutionKinetic energy of photoelectrons is independent on-------- of incident radiation.
View SolutionAccording to Einstein's photoelectric equation (symbols have their usual meaning)
View SolutionThe maximum kinetic energy of the photoelectrons veries
View SolutionFor the photoelectric effect, the maximum kinetic energy Ek of the emitted photoelectrons is plotted against the frequency of the incident photons as shown in the figure. The slope of the curve gives
View SolutionIn an experiment of photo-electric effect, the graph of maximum kinetic energy Ek of the emitted photoelectrons versus the frequency v of the incident light is a straight line AB as shown in figure below :
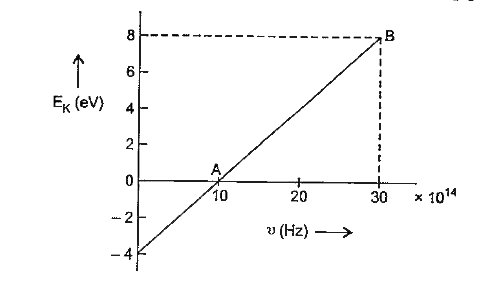
Threshold frequency of the metal.
View Solution
