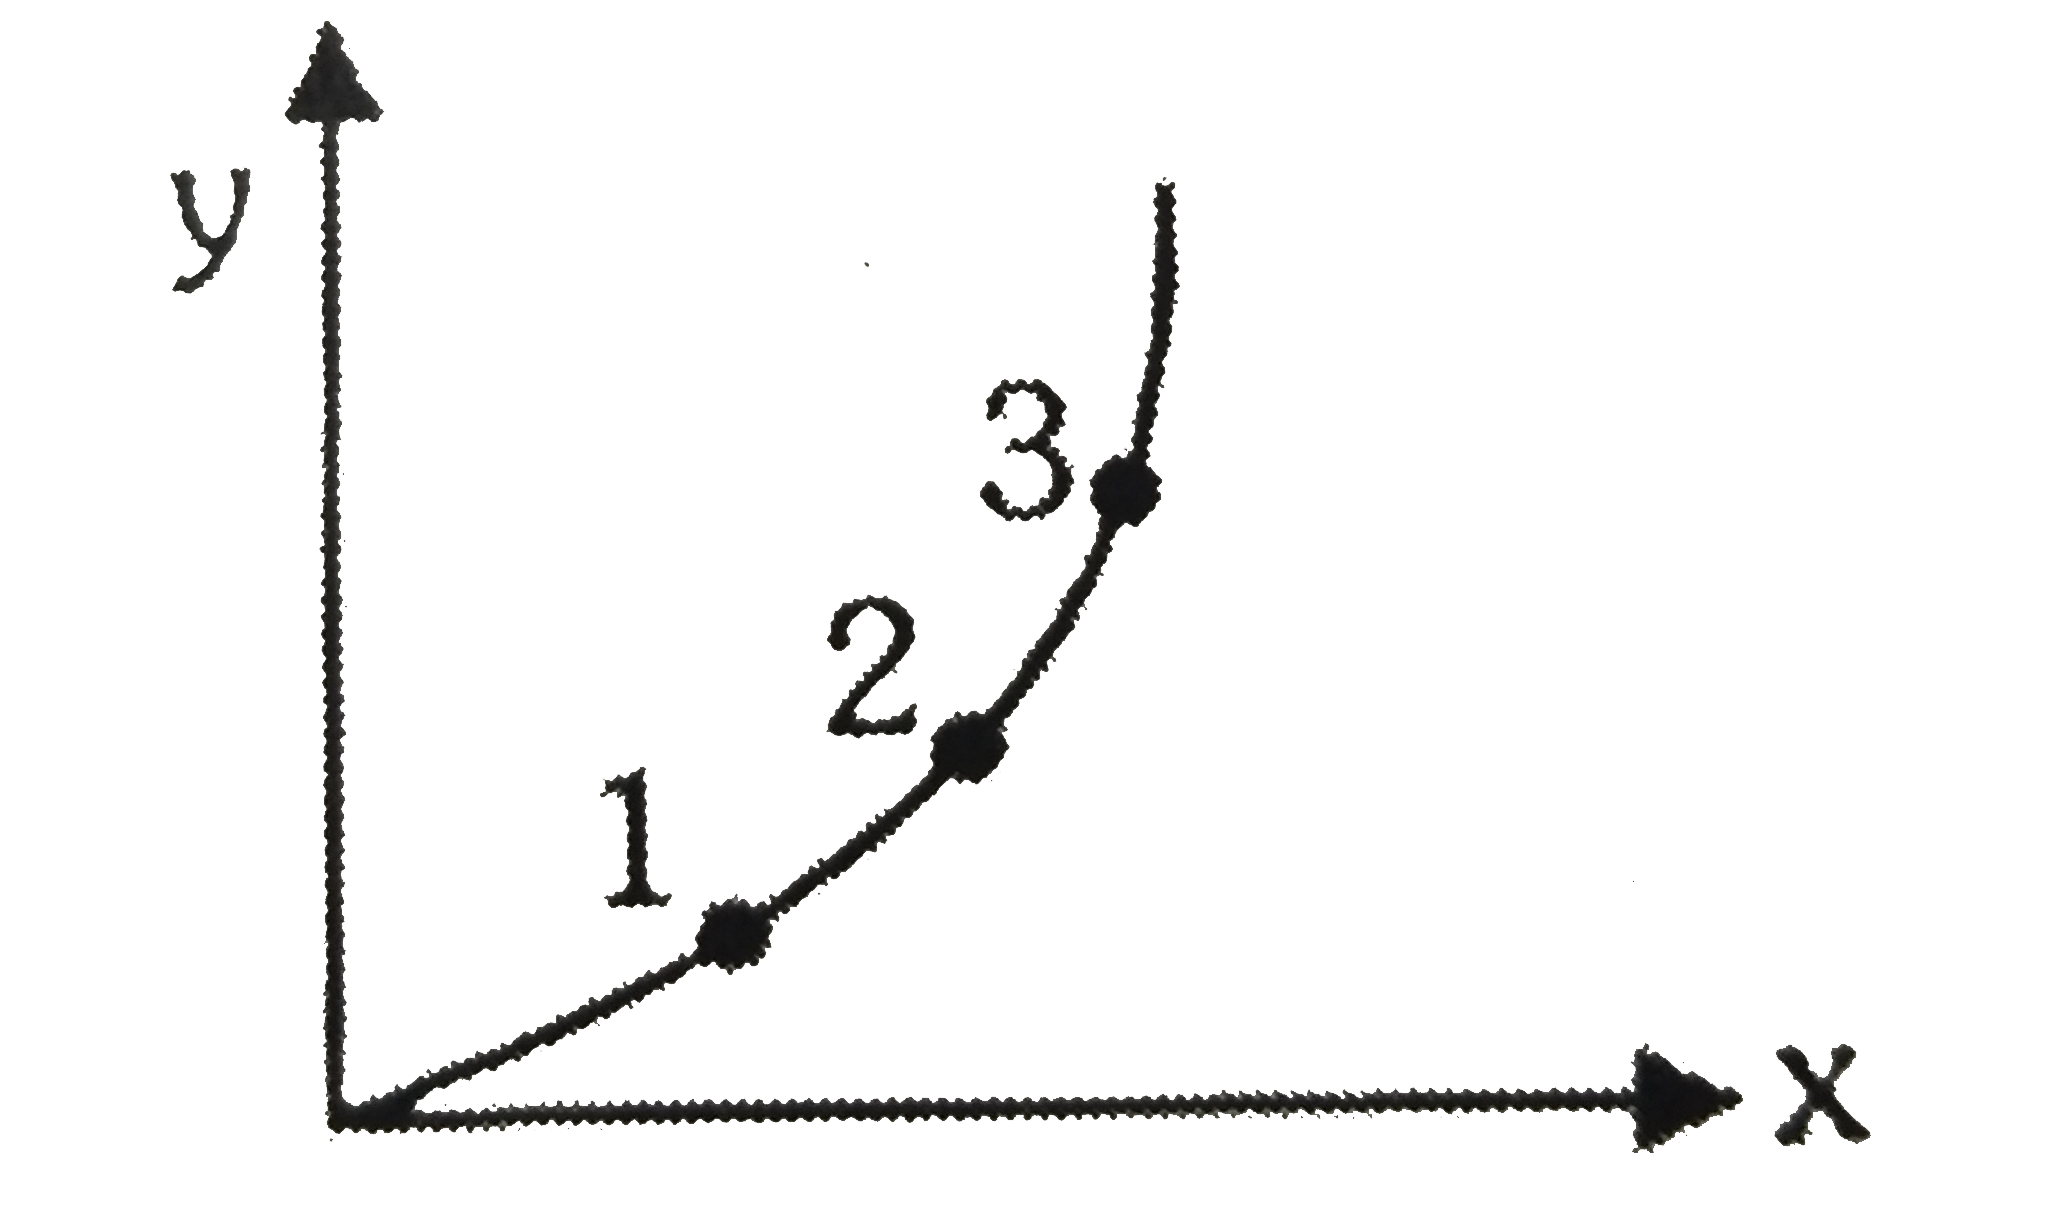
The slope of graph as shown in figure at points 1, 2 and 3 is m1,m2andm3 respectively then

m1>m2>m3
m1<m2<m3
m1=m2=m3
m1=m3>m2
The correct Answer is:B
From point 1 to point 3.
θ is acute and increases.
∴(tanθ) will be increased
as slope (m) = tanθ
therefore sope will increase from point 1 to point 3.
Topper's Solved these Questions
- BOOK - ALLENCHAPTER - BASIC MATHEMATICS USED IN PHYSICS &VECTORS EXERCISE - GEOMETRY7videos
BASIC MATHEMATICS USED IN PHYSICS &VECTORS
- BOOK - ALLENCHAPTER - BASIC MATHEMATICS USED IN PHYSICS &VECTORS EXERCISE - DEFINITION & TYPES OF VECTOR6videos
BASIC MATHEMATICS USED IN PHYSICS &VECTORS
- BOOK - ALLENCHAPTER - BASIC MATHEMATICS USED IN PHYSICS &VECTORS EXERCISE - BEGINNER S BOX 124videos
BASIC MATHEMATICS USED IN PHYSICS &VECTORS
- BOOK - ALLENCHAPTER - CENTRE OF MASSEXERCISE - EXERCISE-V B19videos
CENTRE OF MASS
Similar Questions
Three blocks are placed as shown in figure. Mass of A, B and C are m1,m2,and m3respectively. The force exerted by block 'C' on 'B' is :-
 View Solution
The slope of the line y=2020 is m1 and the slope of the line joining the points (−5,1) and (3,−5) is m2, and the x-intercept of line 2x−3y+5=0 is a, then the value of (m1×m2)a=
View Solution
Knowledge Check
- Question 1 - Select One
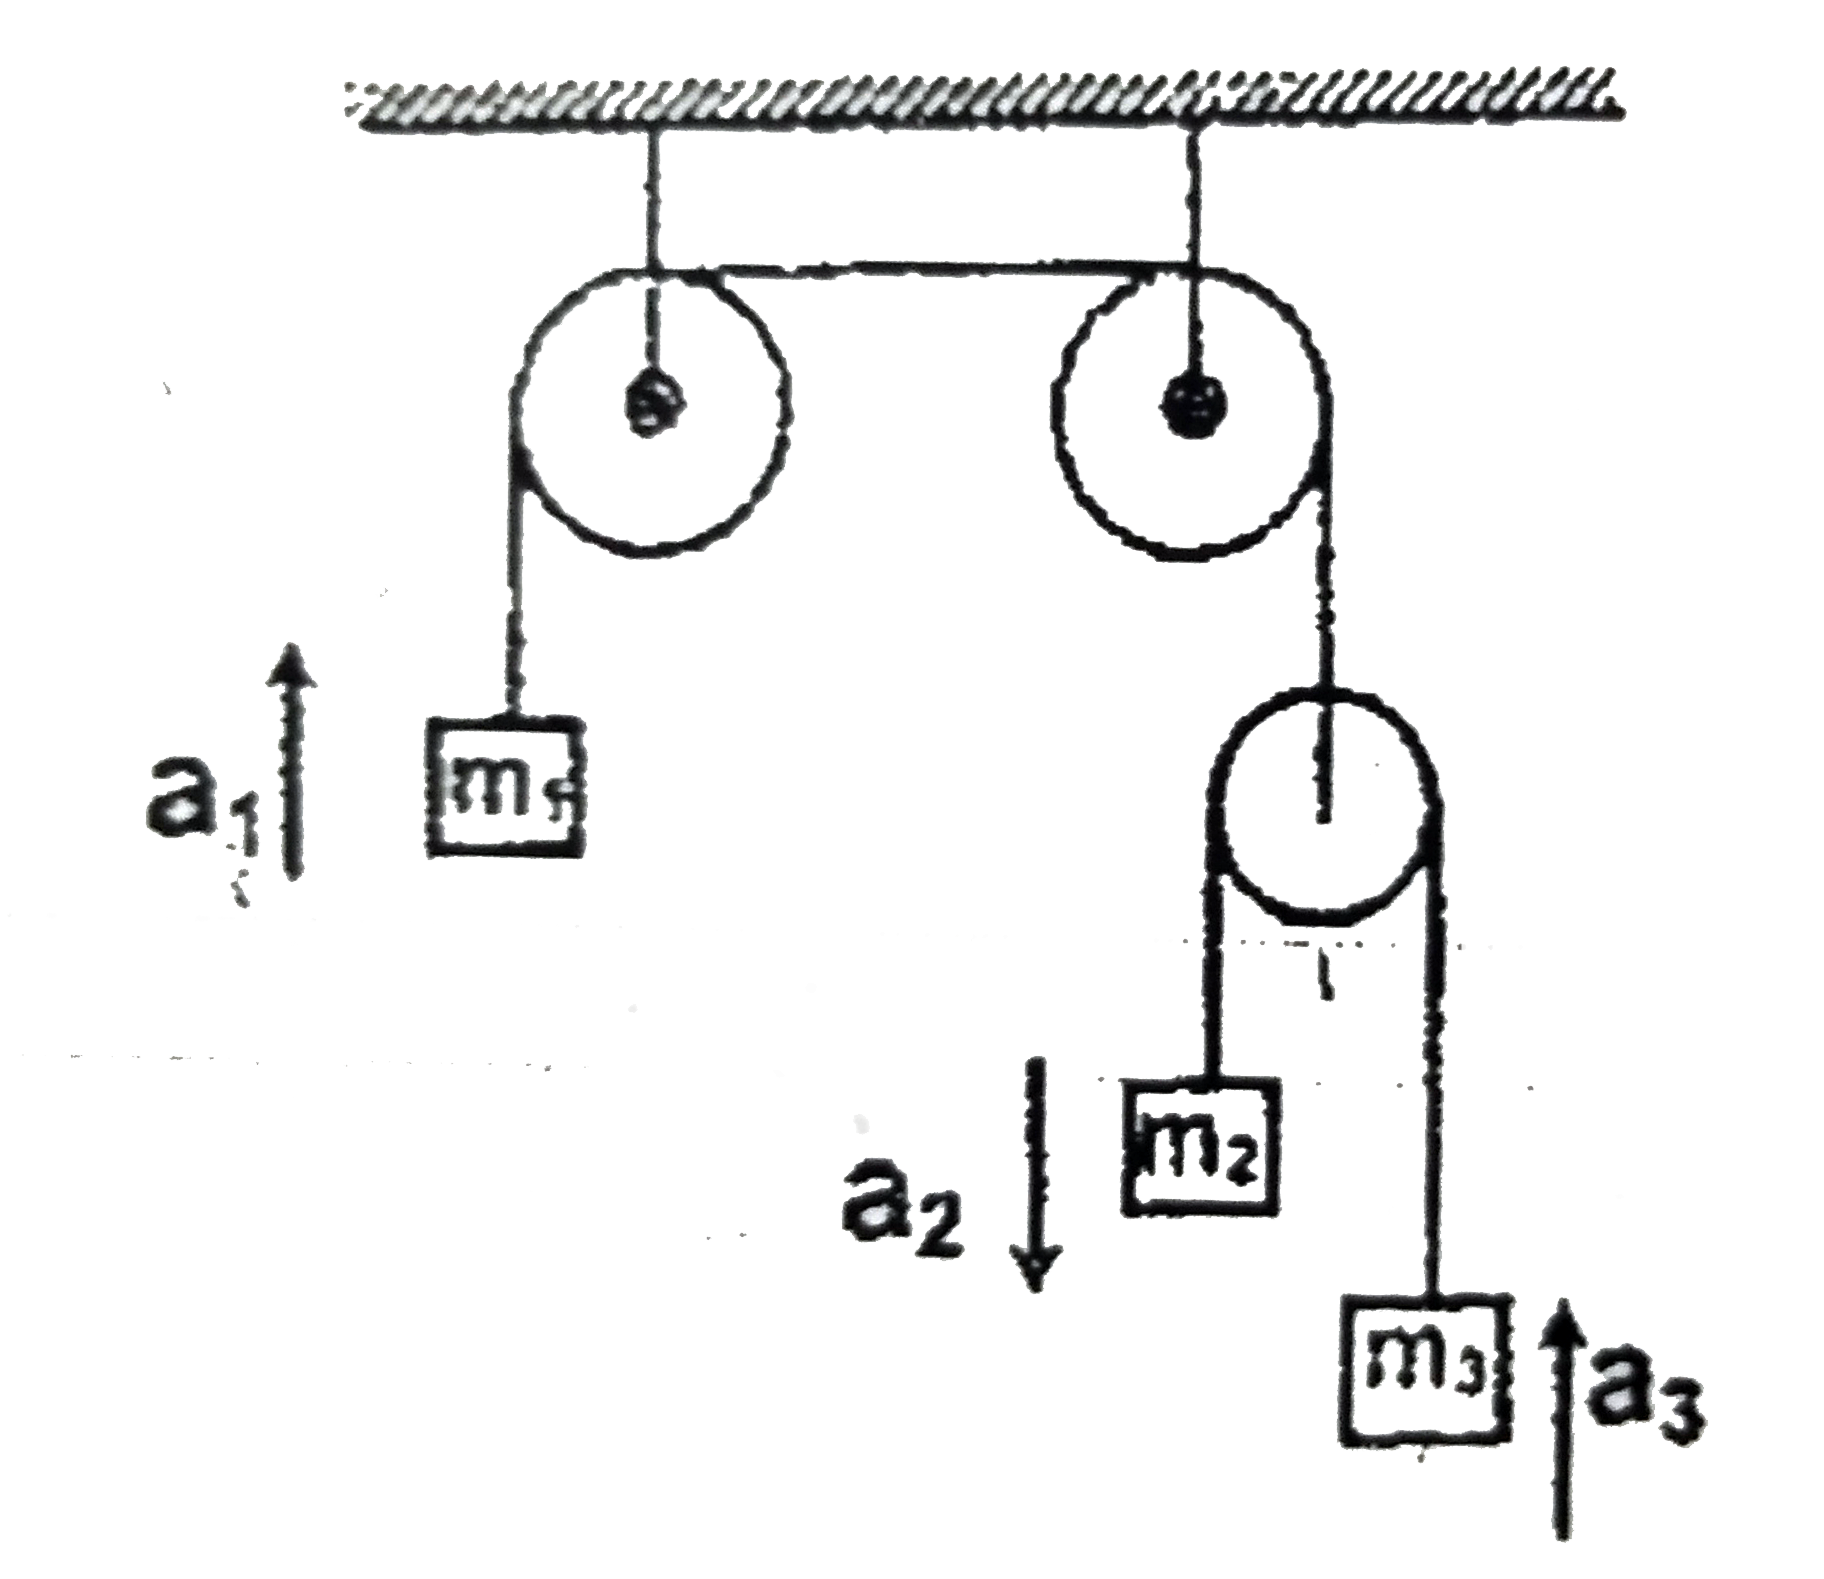
A pulley-block arrangement is shown in the adjacent figure, if acceleration of m1,m2 and m3 are a1,a2 and a3 respectively, then relation between a1,a2 and a3 is ( All string and pulleys are ideal . )
 Aa2−a3+10a1=0Ba3−a2+10a1=0Ca2−2a3+10a1=0D2a2+a3+5a1=0
 - Question 2 - Select One or More
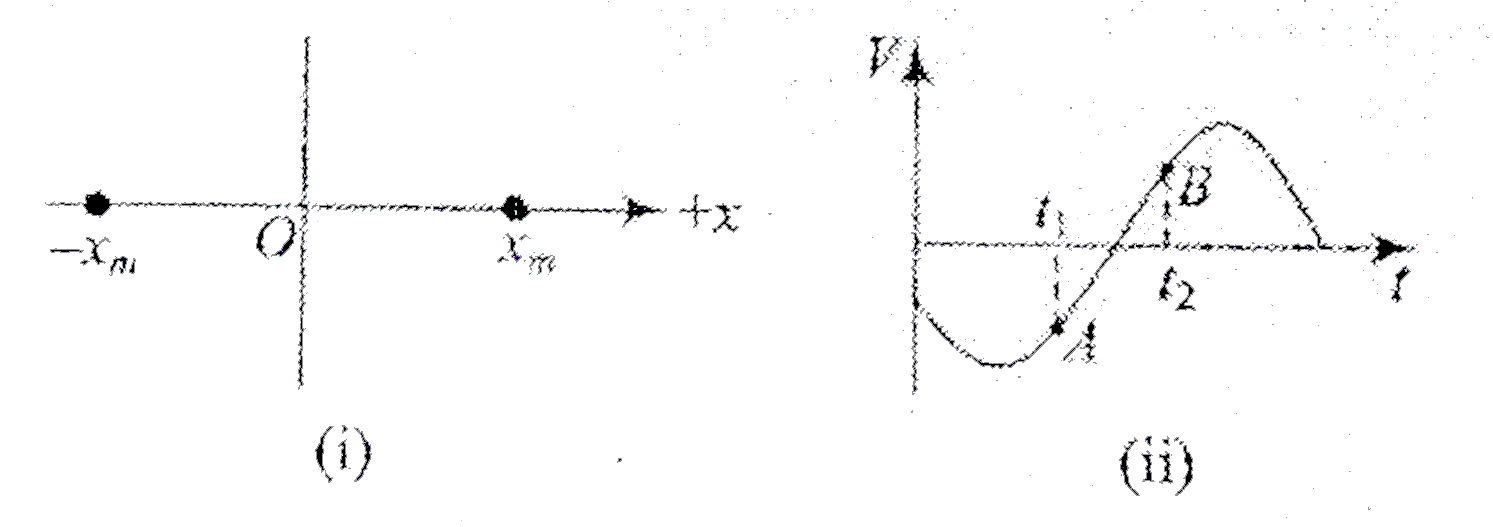
A particle is executing SHM between points-XmandXm, as shown in figure(i). The velocity V(t) of the particle is partially graphed and shown in figure (ii). Two points A and B corresponding to time t1 and time t2 respectively are marked on the V(t) curve.
 AAt time t1, it ios going towards Xm.BAt time t1, its speed is decreasingCAt time t2, its position lies in between −Xm and ODThe phase difference Δϕ between points A and B must be expressed as 90∘<Δϕ<180∘.
 - Question 3 - Select One
Two bodies of mass 2 kg and 5 kg have position (1 m, 2 m, 1 m) and (3 m, 2 m, -1 m) respectively. The position vector of centre of mass is
A(177ˆi+2ˆj−37ˆk)mB(17ˆi+14ˆj−3ˆk)mC(2ˆi+177ˆj−37ˆk)mD(14ˆi+17ˆj−3ˆk)m
Two point charges 3μC and 2.5μC are placed at point A (1, 1, 2)m and B (0, 3, -1)m respectively. Find out electric field intensity at point C(3, 3, 3)m.
View SolutionShown in the figure is a system of three particles having masses m1=1kg,m2=2kgand m1=4kg respectively connected by two springs. The accelartion of A, B and C at any instant are 1m/sec2,2m/sec2 and 1/2msec2 respectively directed as shown in the figure. the external force in N acting on the system is. . . ..
 View Solution
In the adjacent figure, all the pulleys are frictioniess and massless, all the stringes are also massless. The relation between a1,a2 and a3 is (where a1,a2 and a3 are the acceleration of masses m1,m2 and m3 respectively in the direction as shown in the figure)
 View Solution
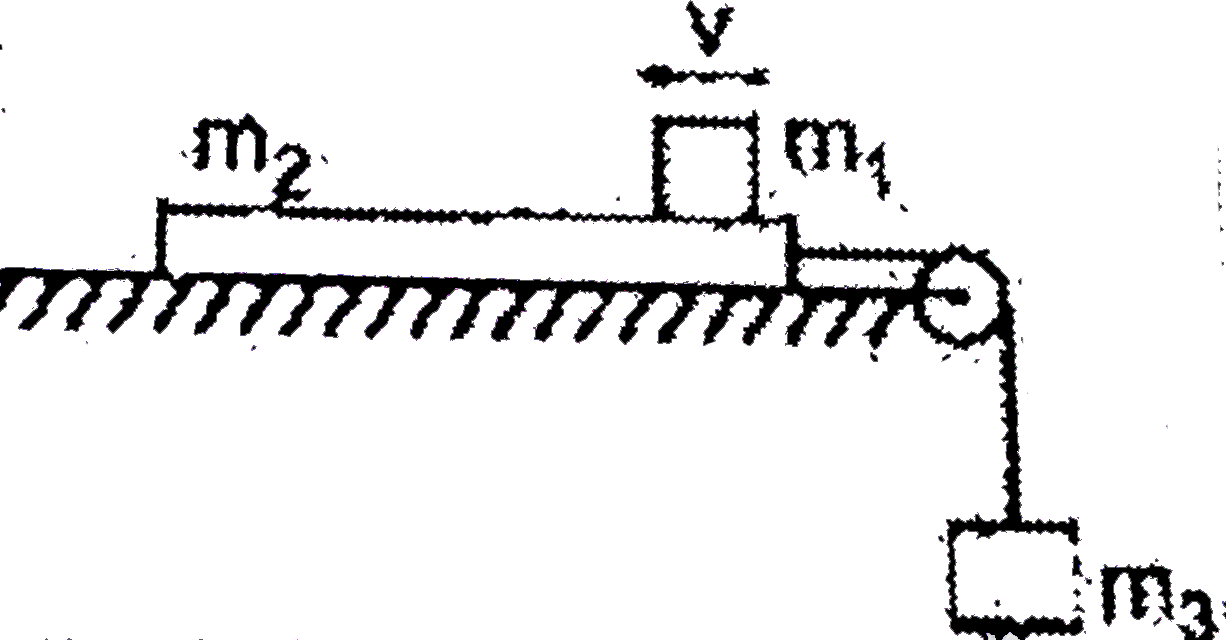
In the shown diagram m1=m2=4kg and m3=2kg. Coefficient of friction between m1andm2 is 0.5. The mass m1 is given a velocity v and it just stops at the other end of the mass m1 in 1 sec. Let a1anda2anda3 be the acceleration m1,m2andm3 respectively, then :
 View Solution
If p1,p2,p3 be the length of perpendiculars from the points (m2,2m),(mm',m+m') and (m'2,2m') respectively on the line xcosα+ysinα+sin2αcosα=0 then p1,p2,p3 are in:
View Solution
