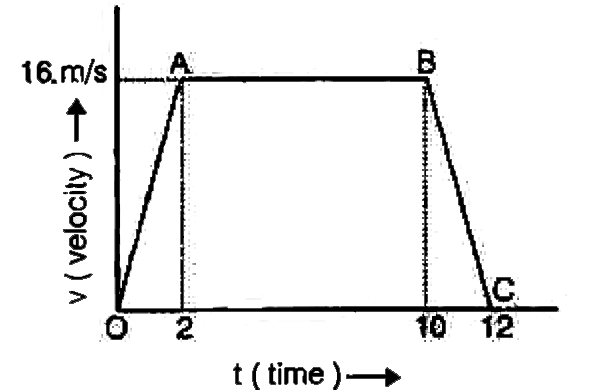
A particle moves on straight line according to the velocity-time graph shown in fig. Calculate -
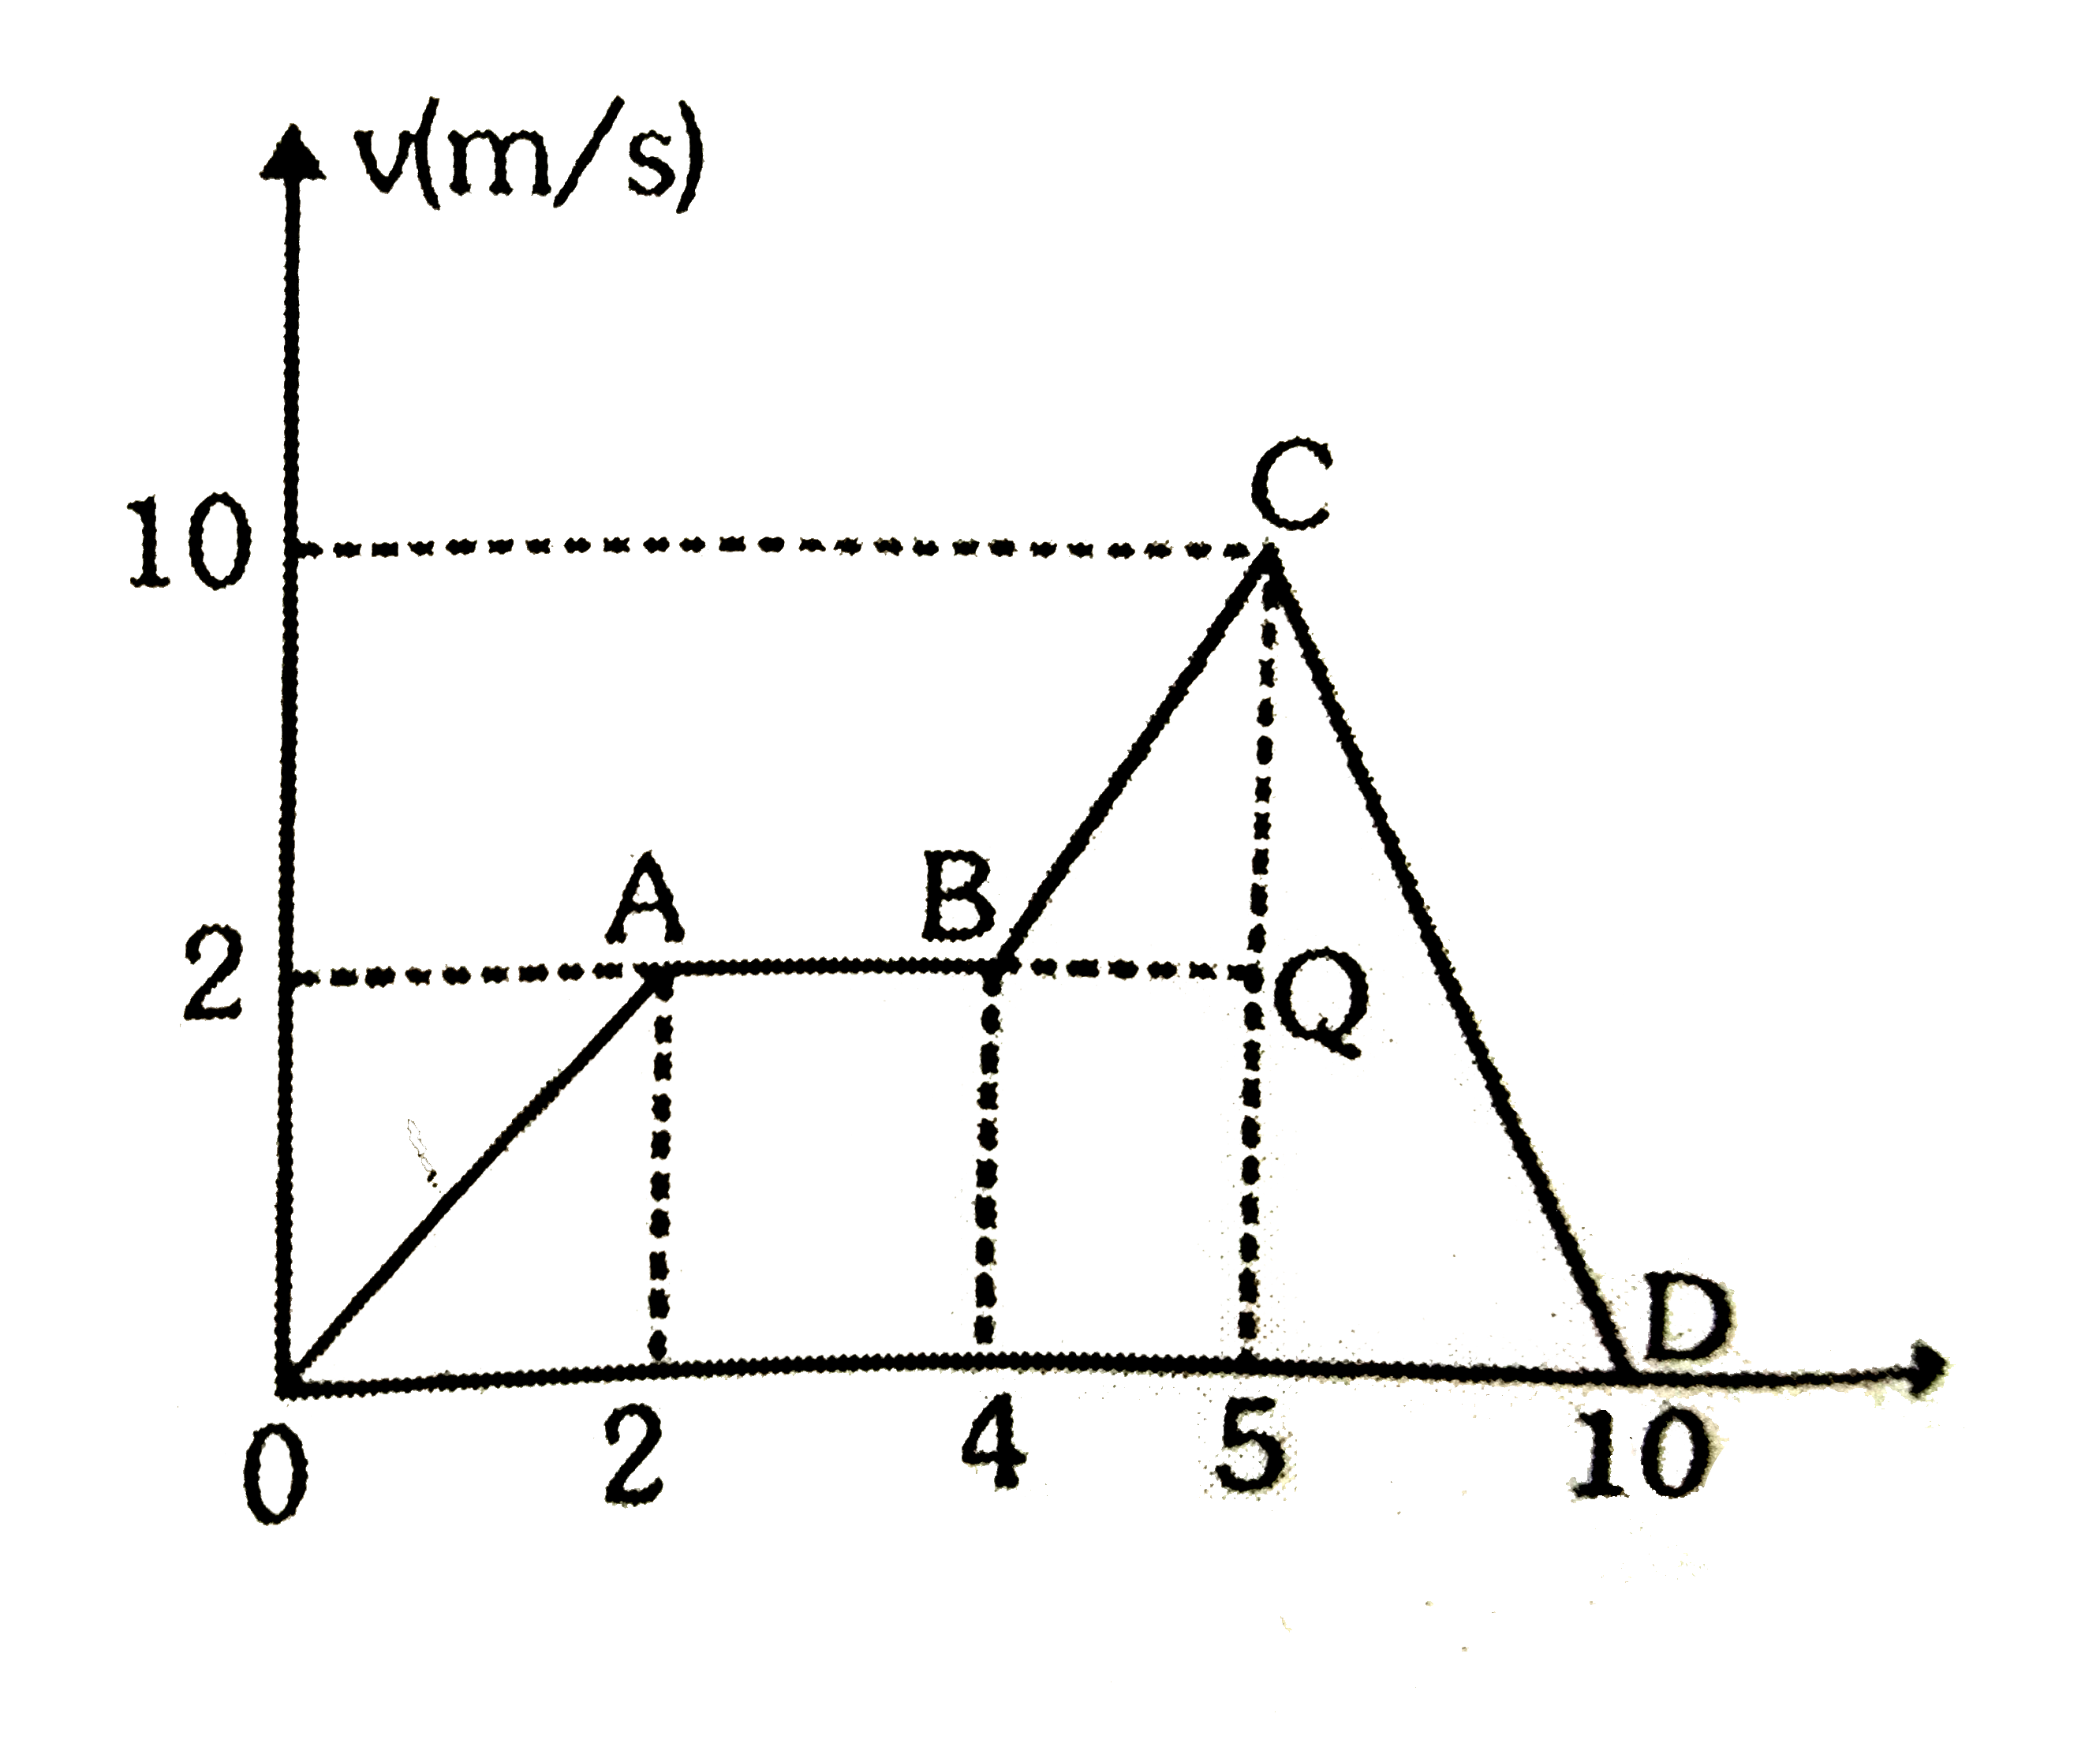
(i) Total distance covered
(ii) Average speed
(iii) In which part of the graph the acceleration is maximum and also find its value.
(iv) Retardation
(i) Total distance covered = Area under v - t curve
=12(2×2)+2(4−2)+12(10+2)×1
12×5×10=37 m
(ii) Average speed = Total distanceTotal time=3710=3.7m/s
(iii) Acceleration = Slope of v-t curve
So maximum acceleration will be in the part where the slope will be maximum i.e. BC
amax=aBC=10−21=8m/s2
(iv) Retardation = Slope of CD (As it is negative)
=∣∣∣0−105∣∣∣=|−2|=2m/s2
Topper's Solved these Questions
- BOOK - ALLENCHAPTER - KINEMATICS (MOTION ALONG A STRAIGHT LINE AND MOTION IN A PLANE)EXERCISE - BEGINNER S BOX-69videos
KINEMATICS (MOTION ALONG A STRAIGHT LINE AND MOTION IN A PLANE)
- BOOK - ALLENCHAPTER - KINEMATICS (MOTION ALONG A STRAIGHT LINE AND MOTION IN A PLANE)EXERCISE - BEGINNER S BOX-78videos
KINEMATICS (MOTION ALONG A STRAIGHT LINE AND MOTION IN A PLANE)
- BOOK - ALLENCHAPTER - KINEMATICS (MOTION ALONG A STRAIGHT LINE AND MOTION IN A PLANE)EXERCISE - BEGINNER S BOX-46videos
KINEMATICS (MOTION ALONG A STRAIGHT LINE AND MOTION IN A PLANE)
- BOOK - ALLENCHAPTER - KINEMATICSEXERCISE - Integer Type Question3videos
KINEMATICS
- BOOK - ALLENCHAPTER - MISCELLANEOUSEXERCISE - SUBJECTIVE QUESTION9videos
MISCELLANEOUS
Similar Questions
Knowledge Check
- Question 1 - Select One or More
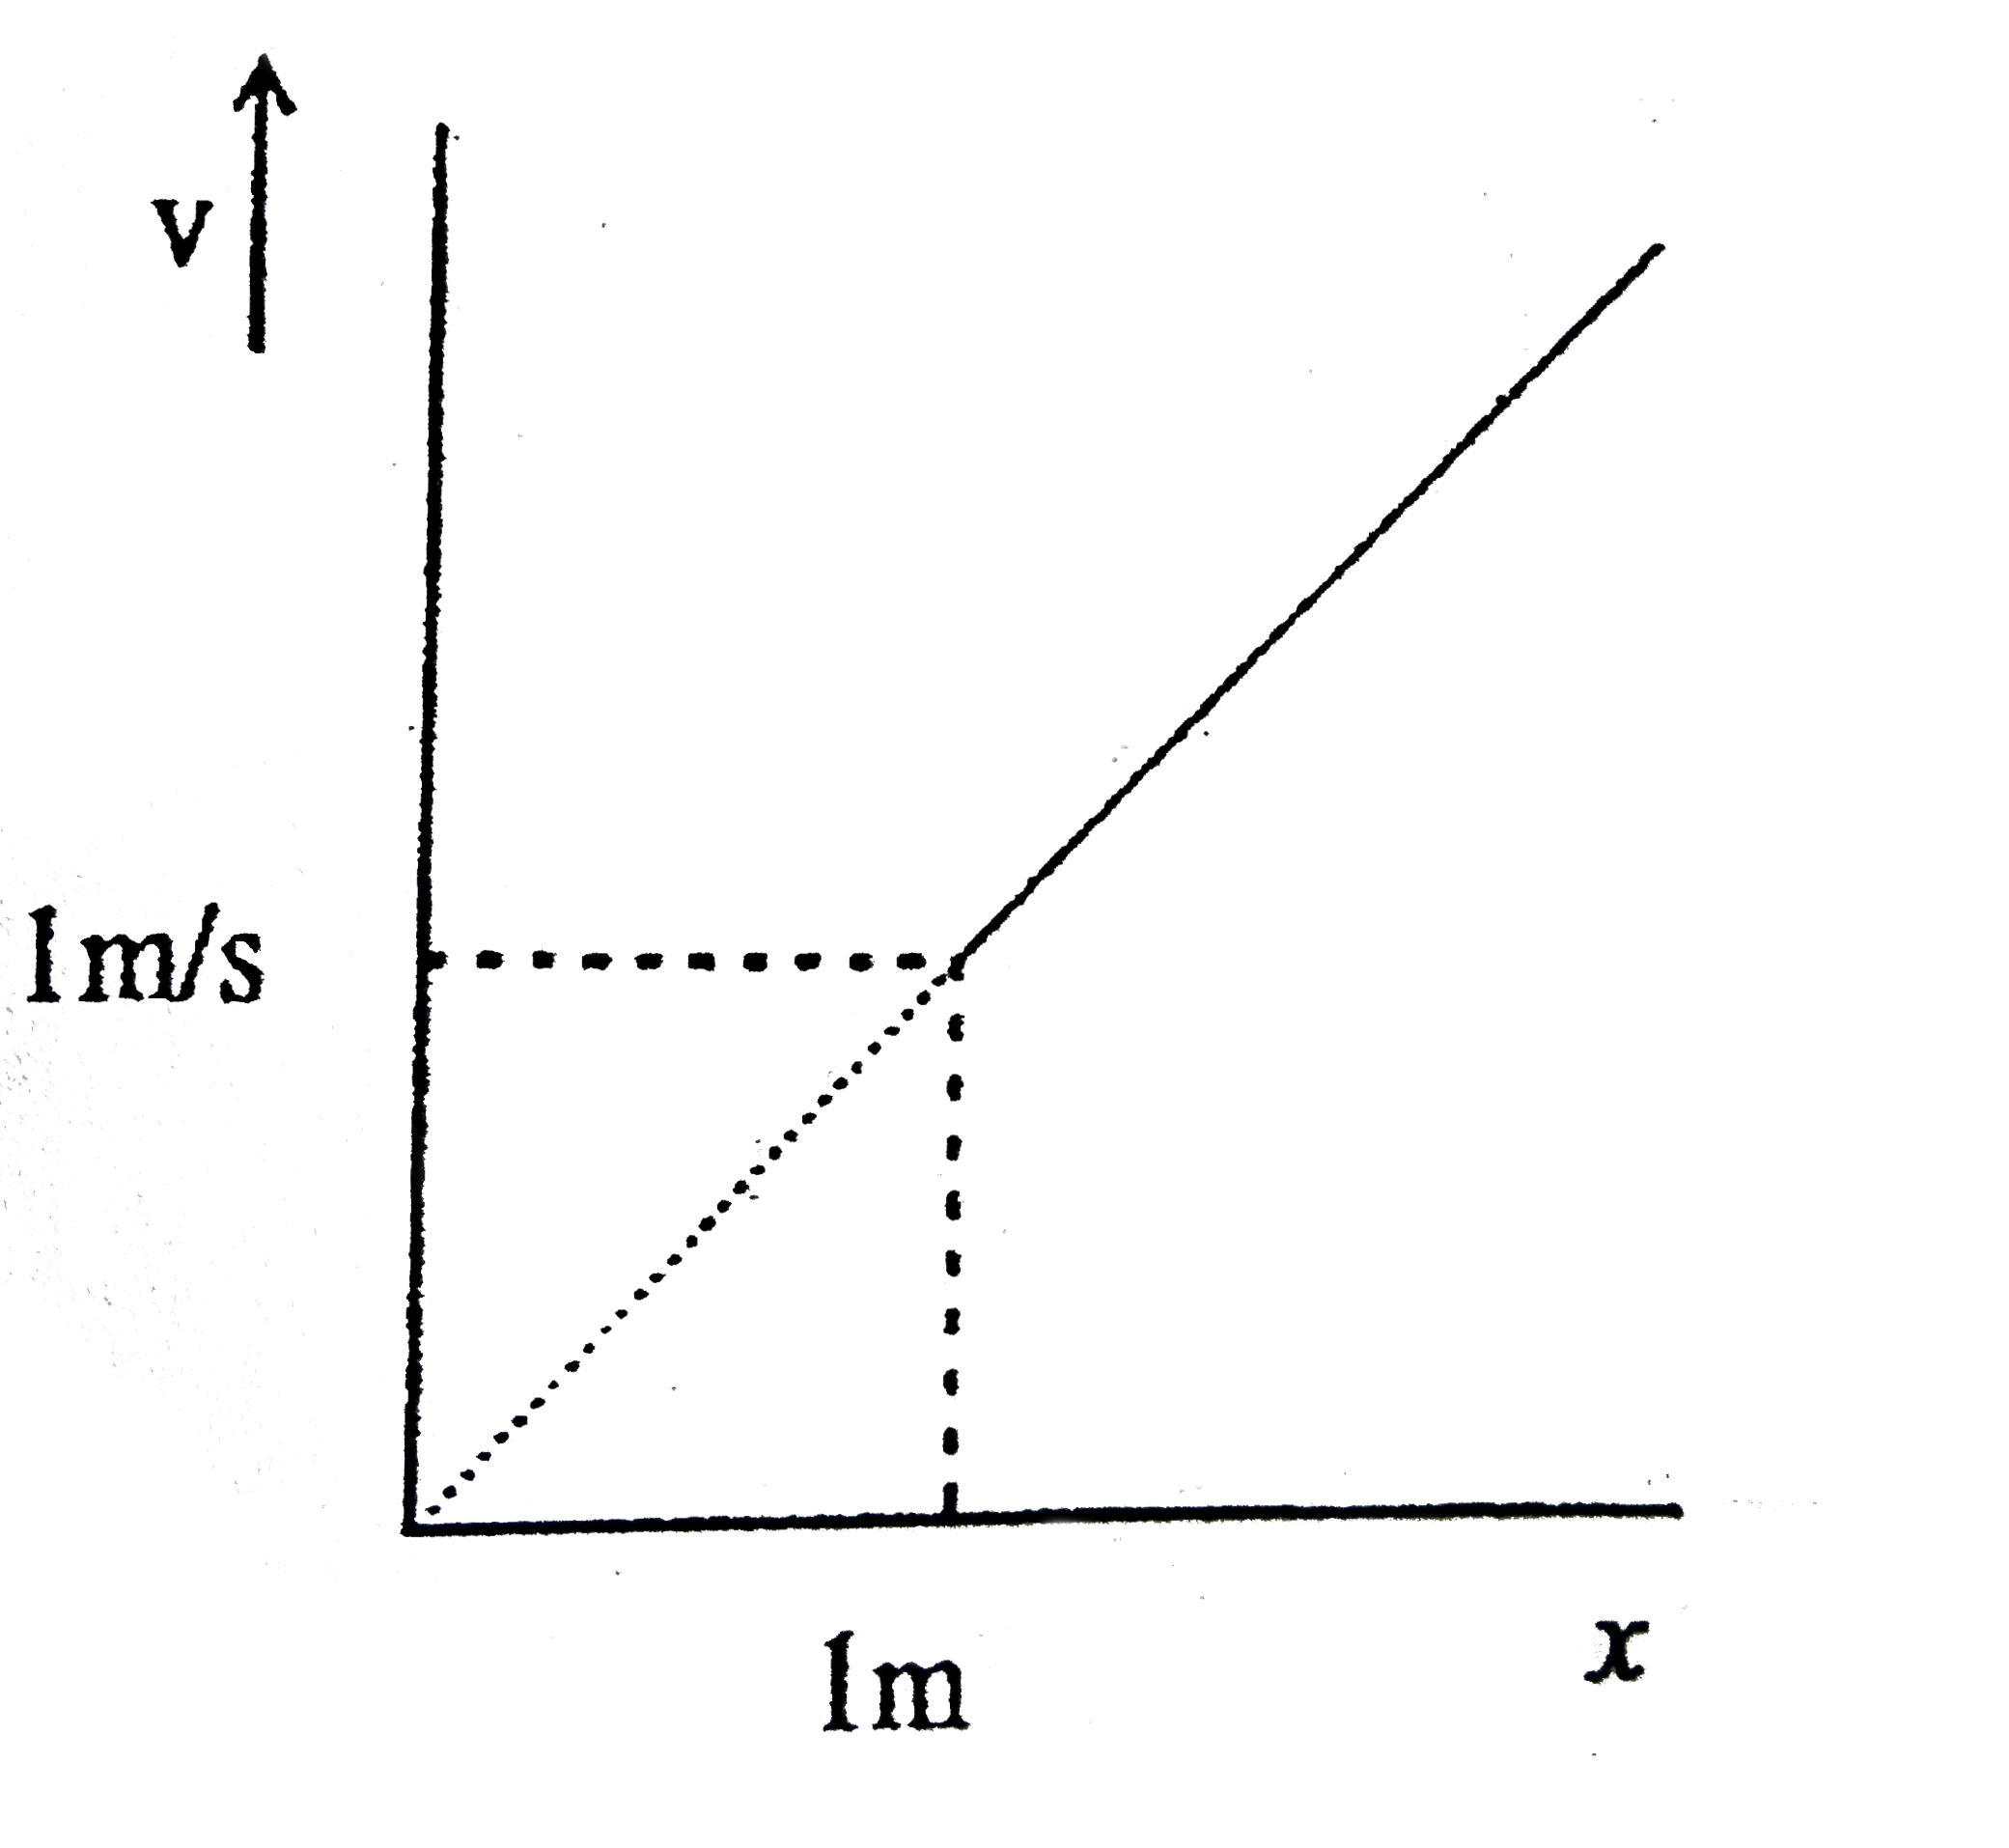
A particle is moving in a straight line according to graph given below : (a is acceleration, v is velocity, x is position, t is time) :
 A
A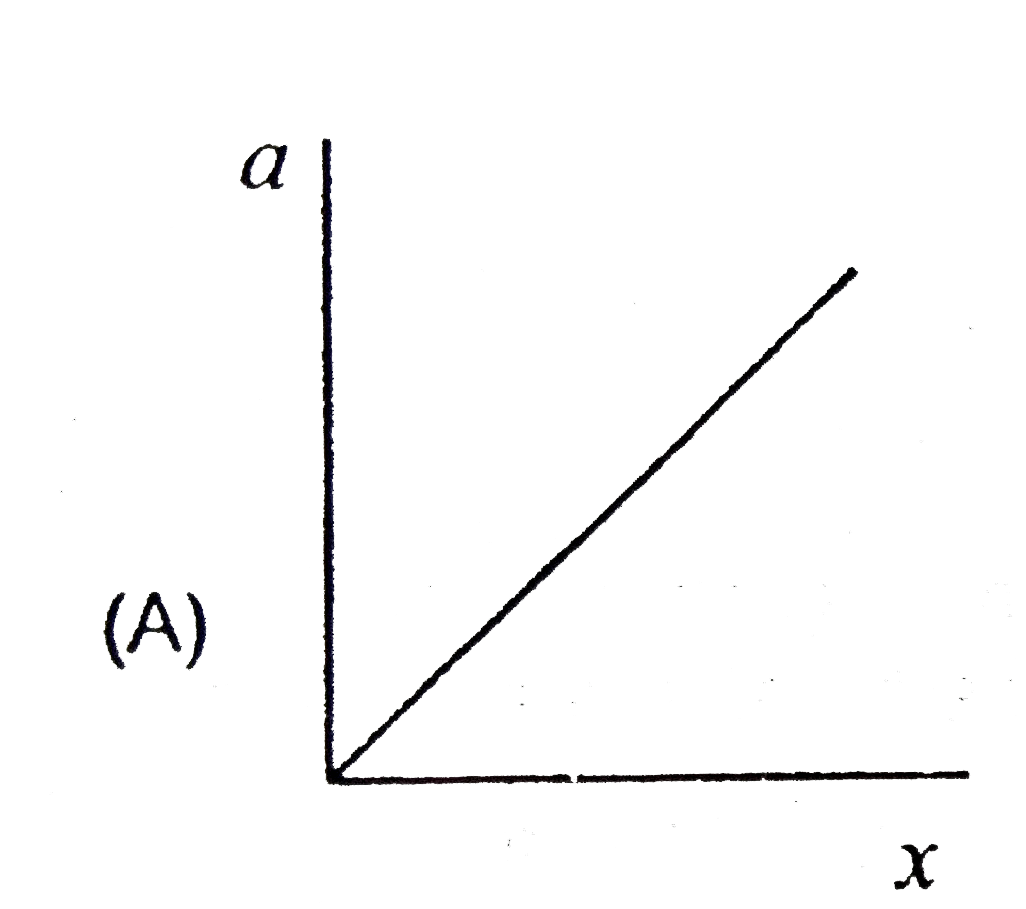 B
B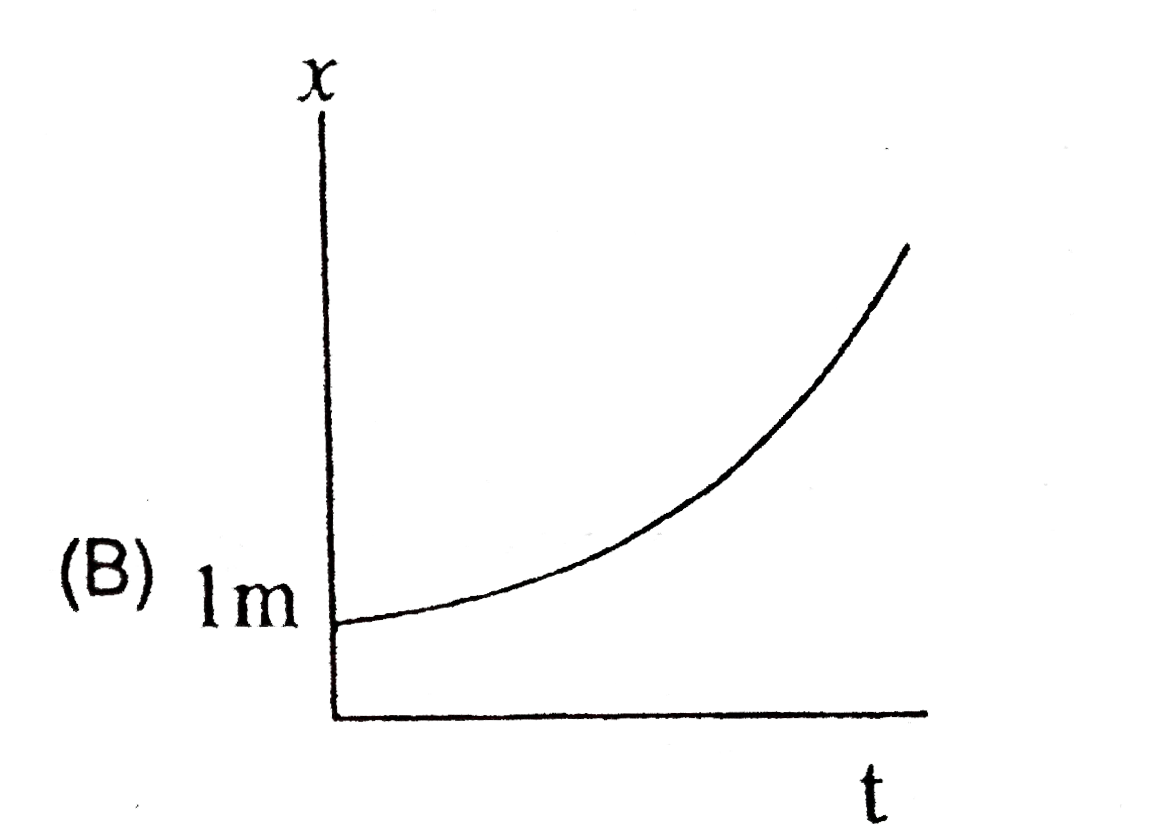 C
C D
D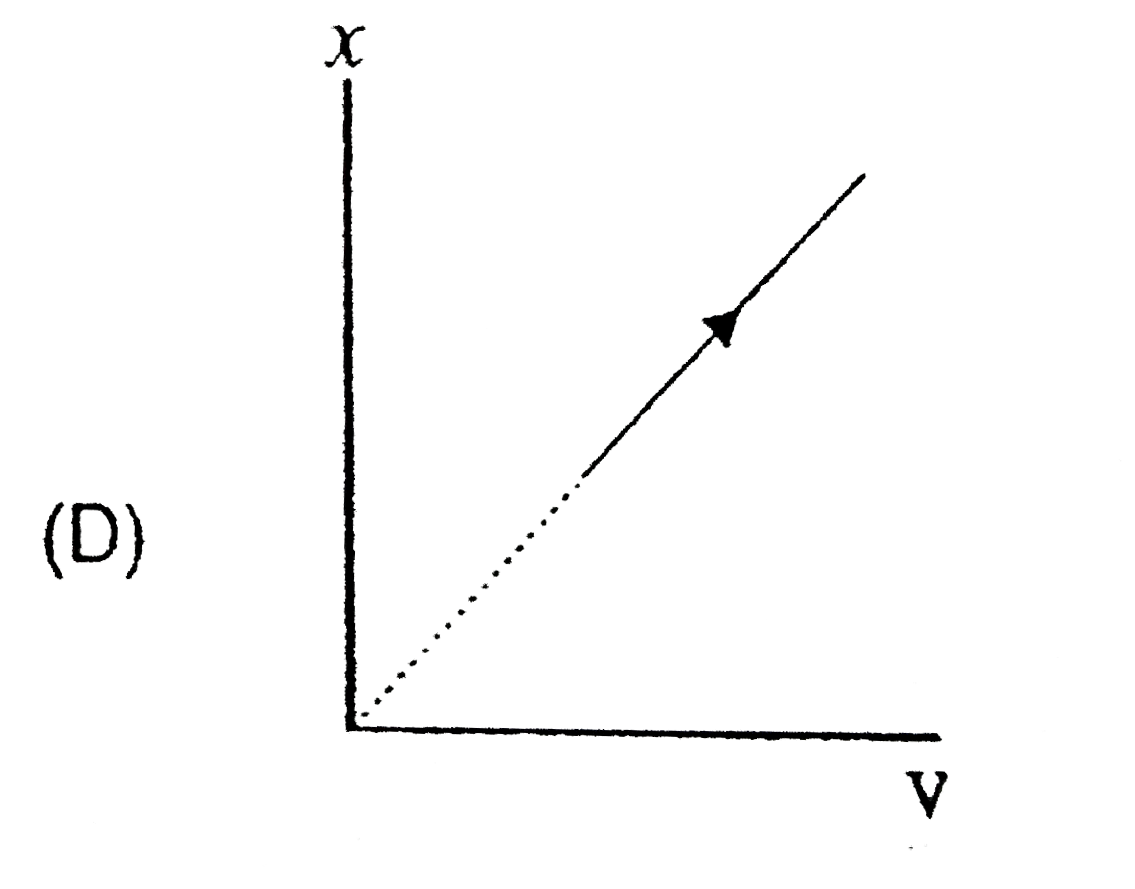
- Question 2 - Select One
The velocity-time graph of a particle is not a straight line. Its acceleration is
AzeroBconstantCnegativeDvariable
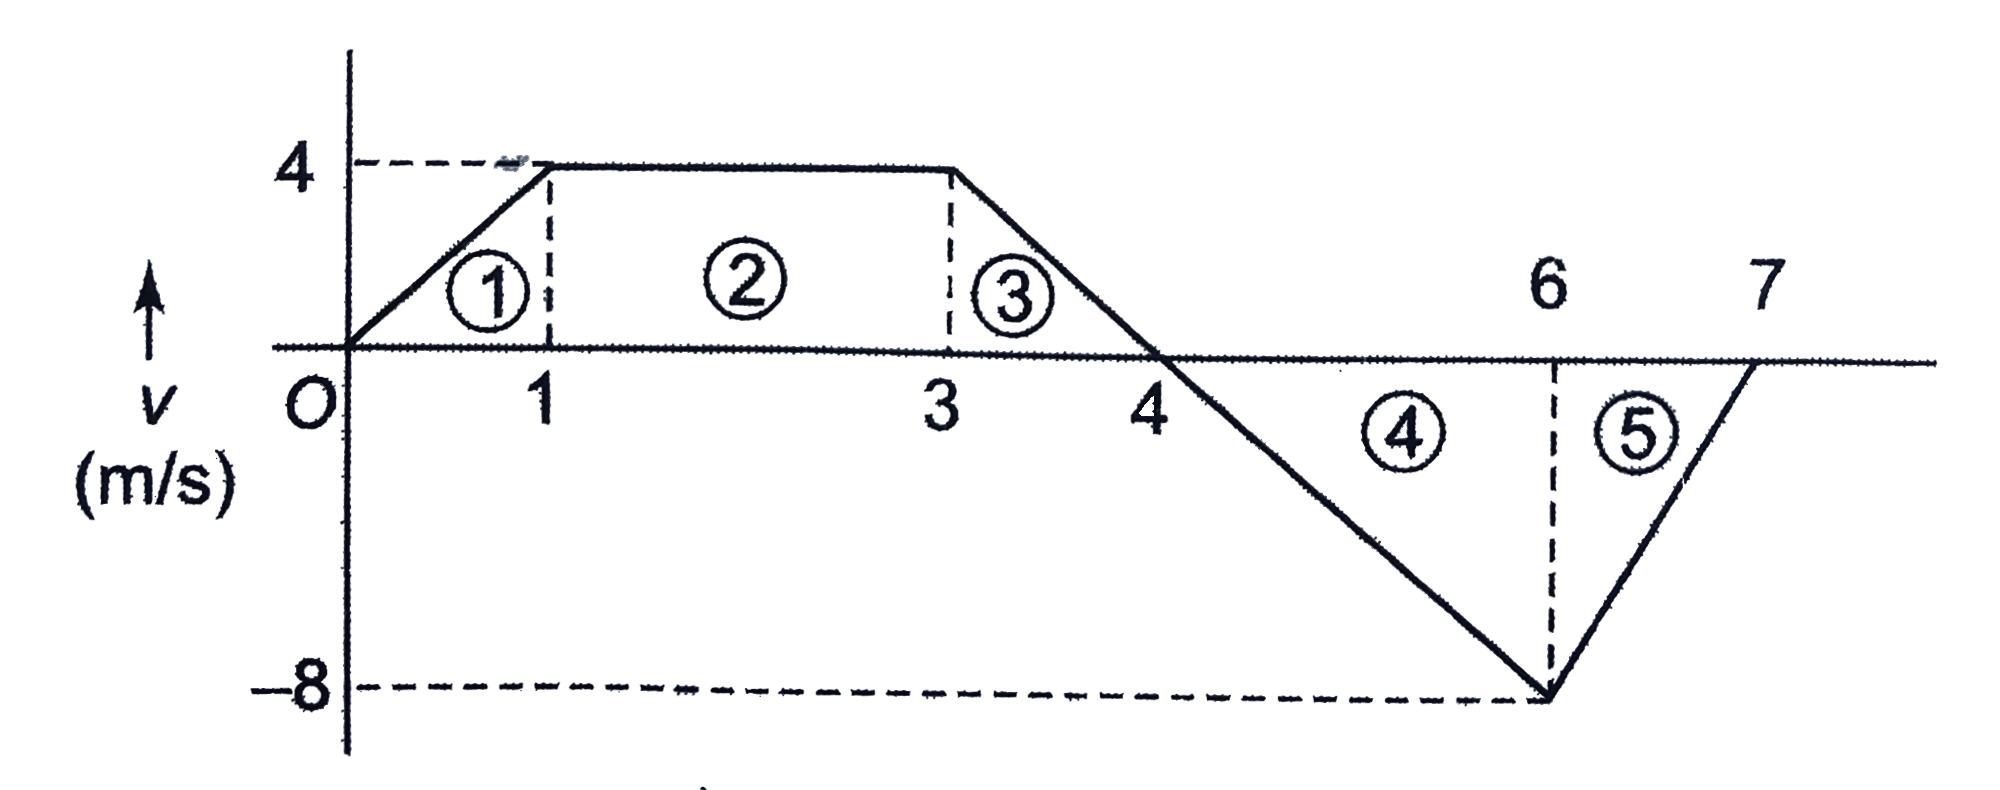
A particle is moving in a straight line along the xaxis. Its velocity-time graph is as shown. Sketch the displacement-time and distance-time grapgs.
 View Solution
A particle moves along a horizontal line and its velocity changes with time as shown in the figure.
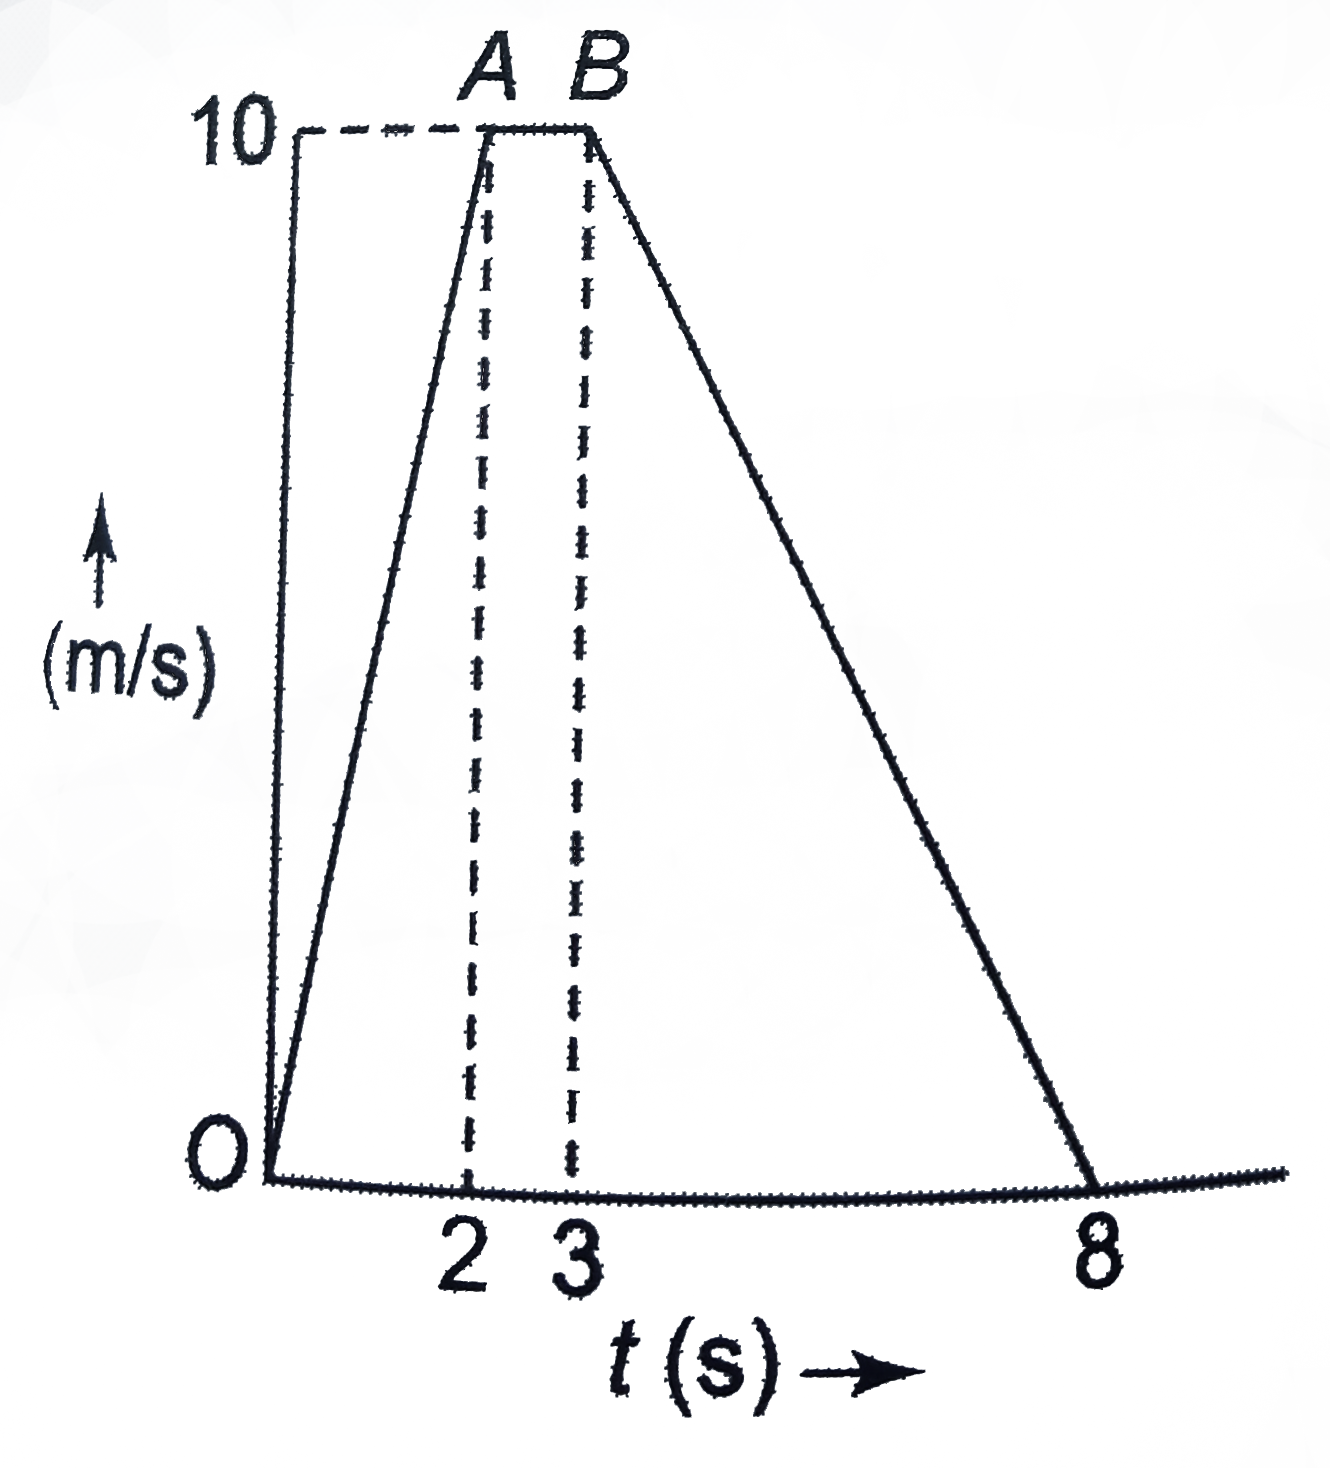
Calculate (i)initial acceleration, (ii)total distance described . Plot the x-t graph of the motion.View SolutionFor a particle moving in a straight line, the velocity-time graph is as shown in the figure. Find the acceleration at time t=1s2.5s and 5s. Sketch the acceleration time graph.
 View Solution
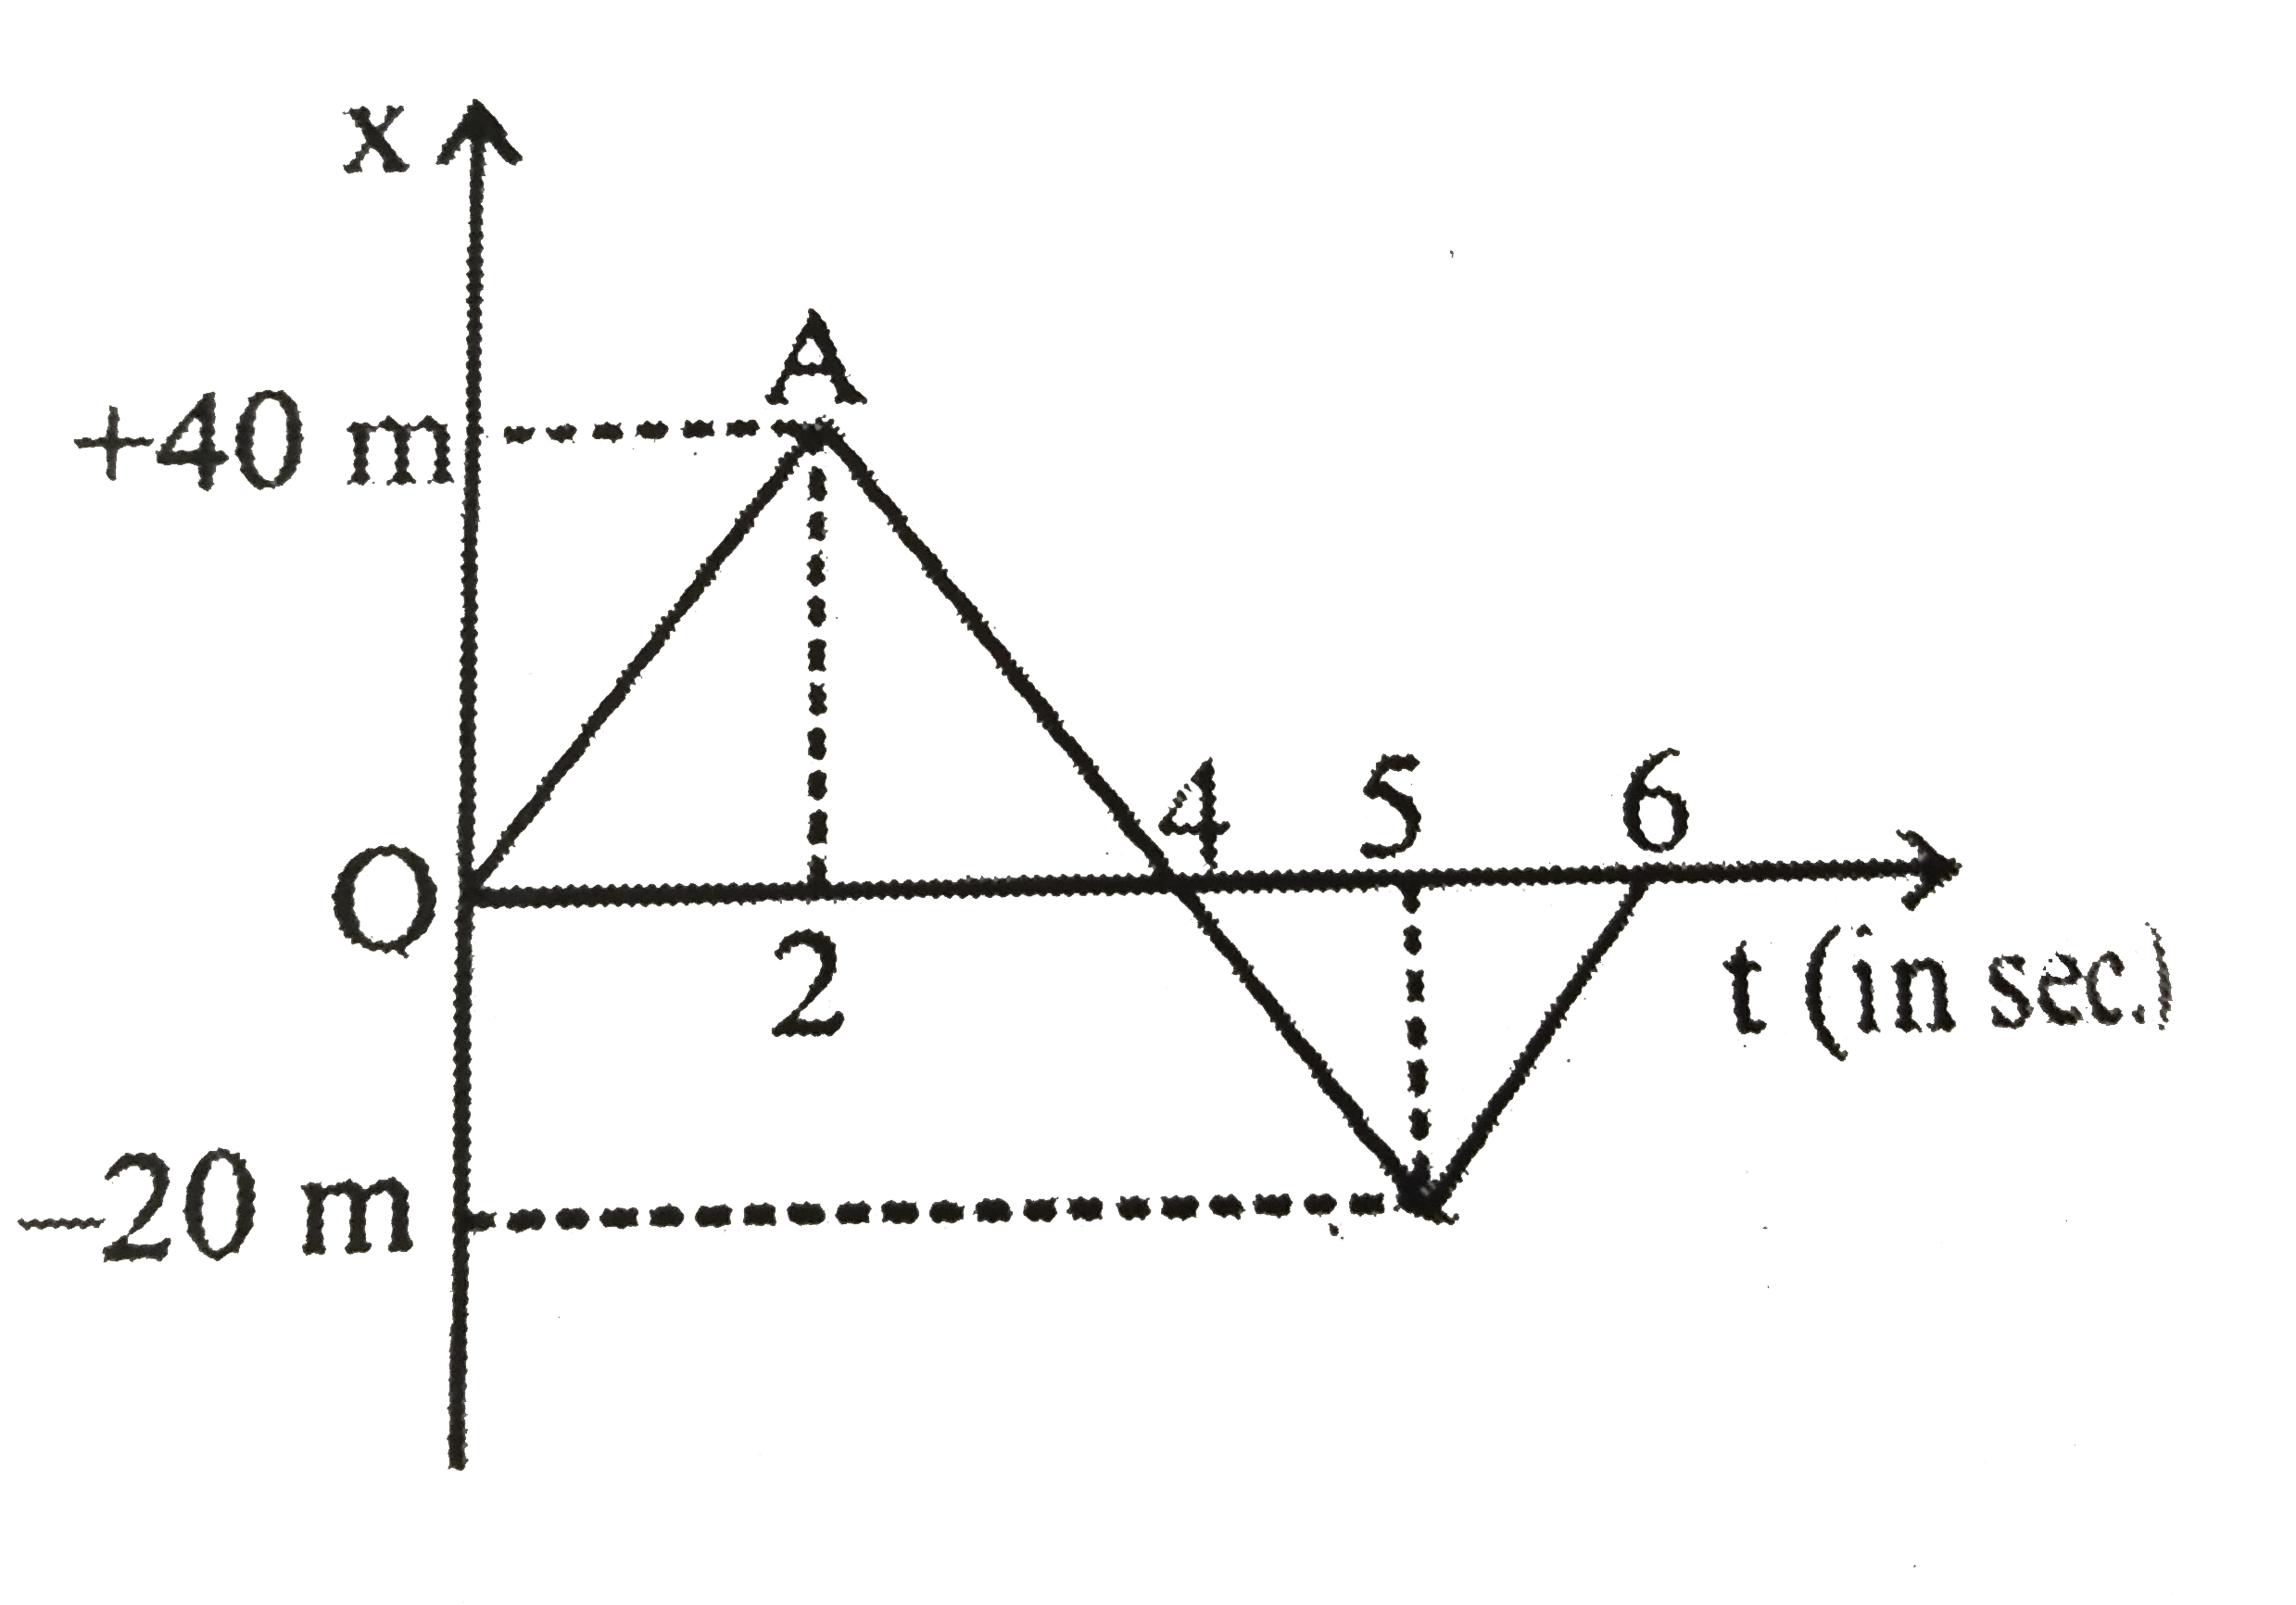
s-t graph of a particle in motion is shown in Fig. Calculate
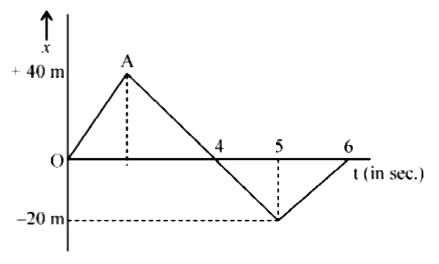
Total covered distanceView SolutionA particle moving in straight line,1v versus displacement graph is shown in figure. Find average speed of particle for given 4 m.
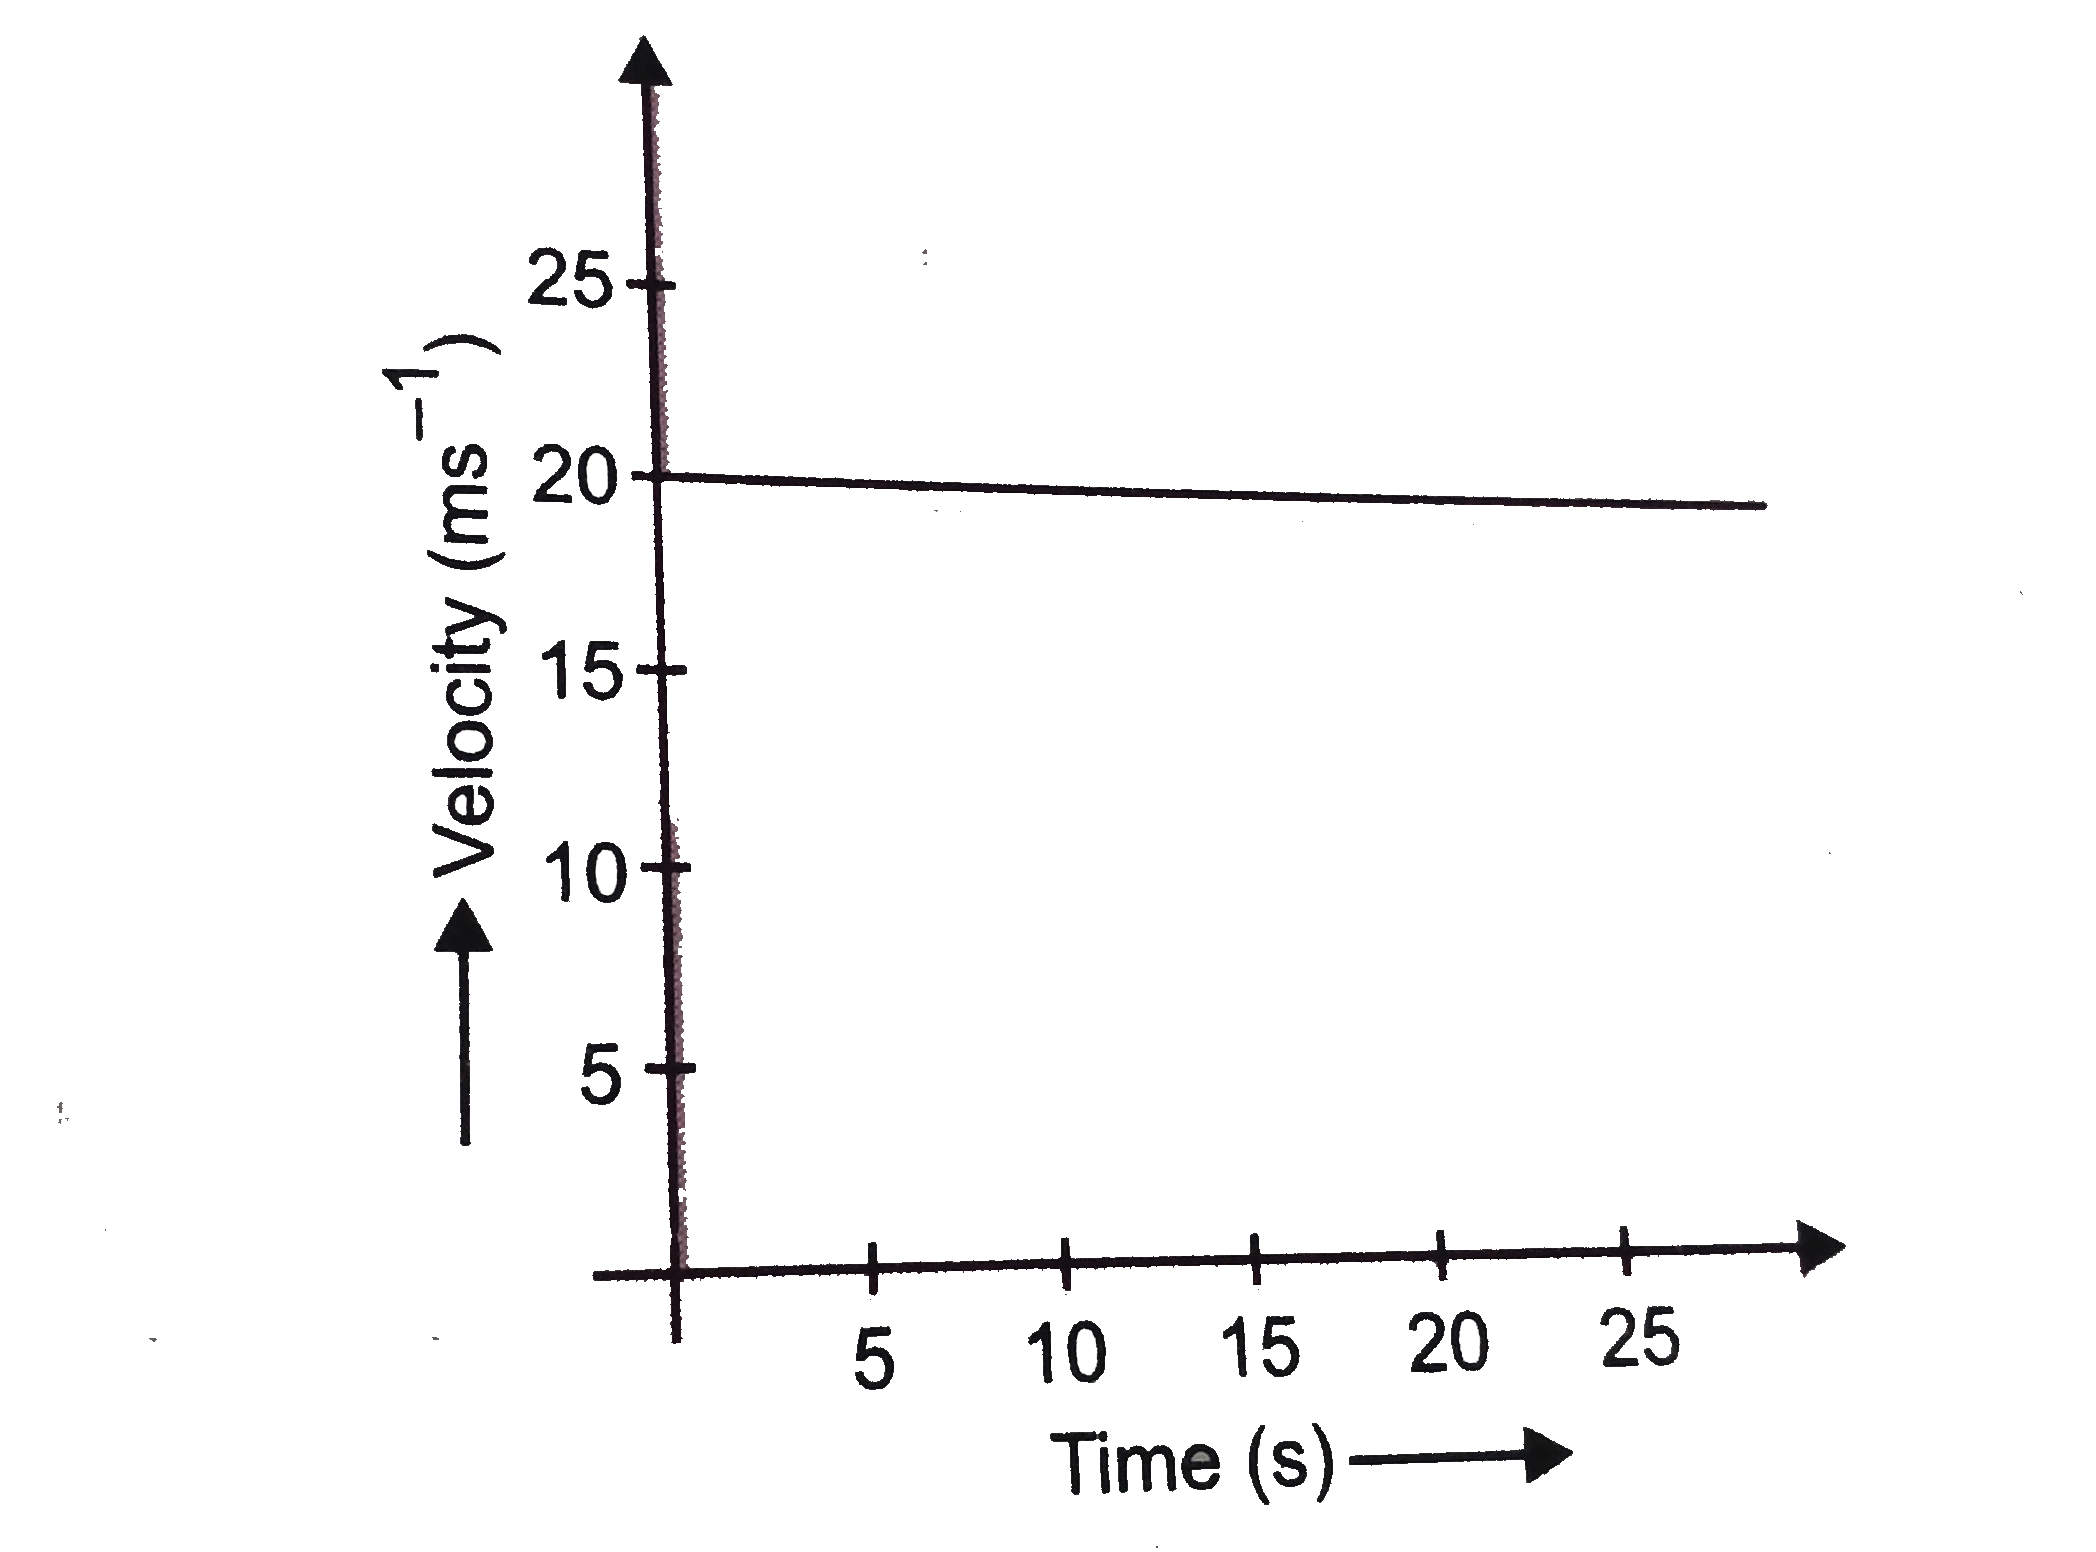
View SolutionThe velocity-time graph shows the motion of a cyclist. Find (i) its acceleration (ii) its velocity and (iii) the distance covered by the cyclist in 15 seconds.
 View Solution


