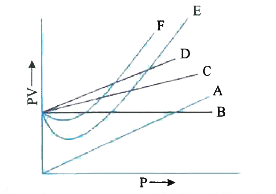
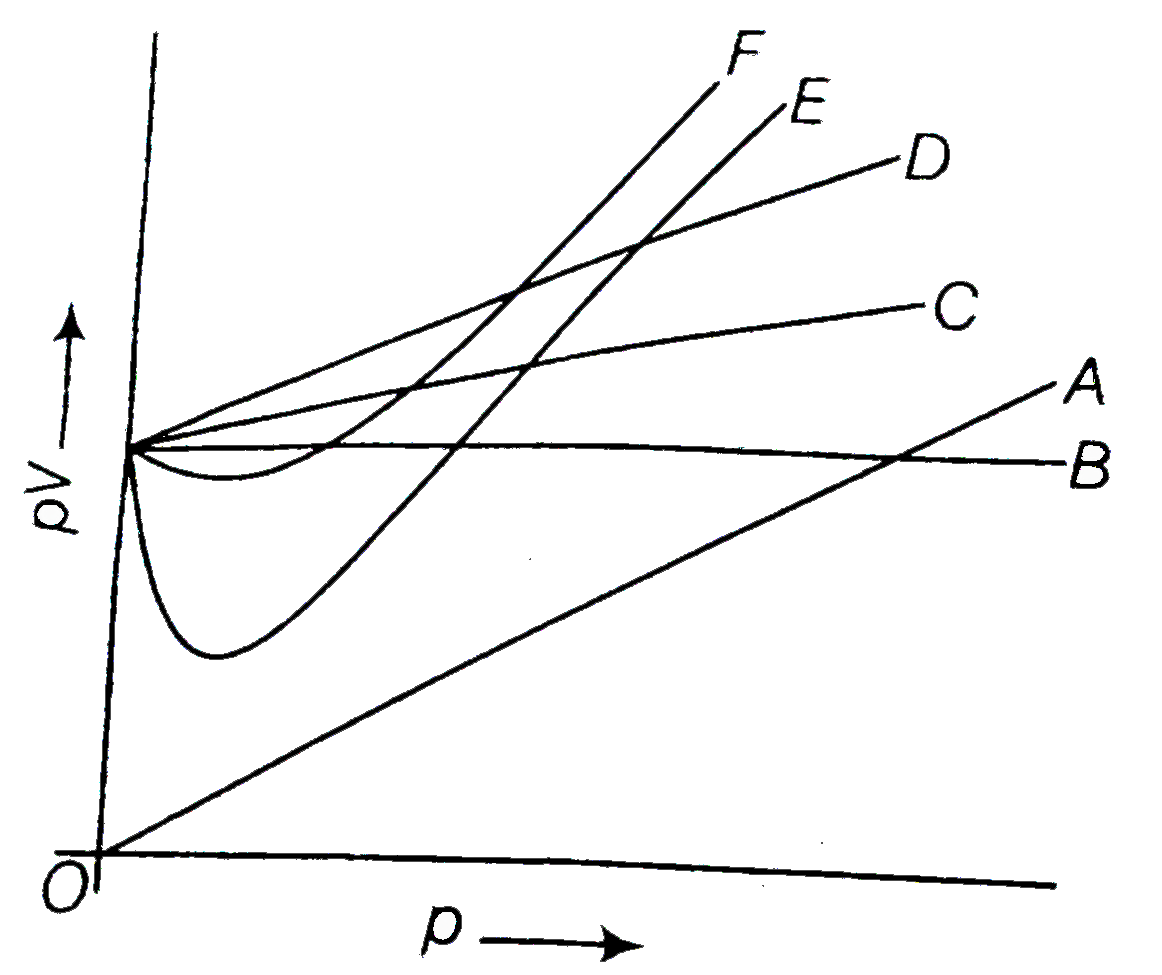
Which curve in the following graph represents the curve of ideal gas ?
A
B only
B
C and D only
C
E and F only
D
A and B only
Text Solution
The correct Answer is:A
For an ideal gas graph between P and PV is straight line parallel to the pressure axis .
|
Topper's Solved these Questions
- STATES OF MATTERBOOK - NARAYNACHAPTER - STATES OF MATTEREXERCISE - A & R TYPE QUESTIONS
16 Videos
- STATES OF MATTERBOOK - NARAYNACHAPTER - STATES OF MATTEREXERCISE - EXERCISE - 3
32 Videos
- SOME BASIC PRINCIPLES AND TECHNIQUESBOOK - NARAYNACHAPTER - SOME BASIC PRINCIPLES AND TECHNIQUESEXERCISE - EXERCISE -IV (QUALITATIVE AND QUANTITATIVE ANALYSIS OF ORGANIC OF COMPOUNDS)
8 Videos
- STRUCTURE OF ATOMBOOK - NARAYNACHAPTER - STRUCTURE OF ATOMEXERCISE - EXERCISE - IV EXEMPLAR PROBLEMS
24 Videos
Similar Questions
Knowledge Check
Which of the following graphs represent the behaviour of an ideal gas ?
A1.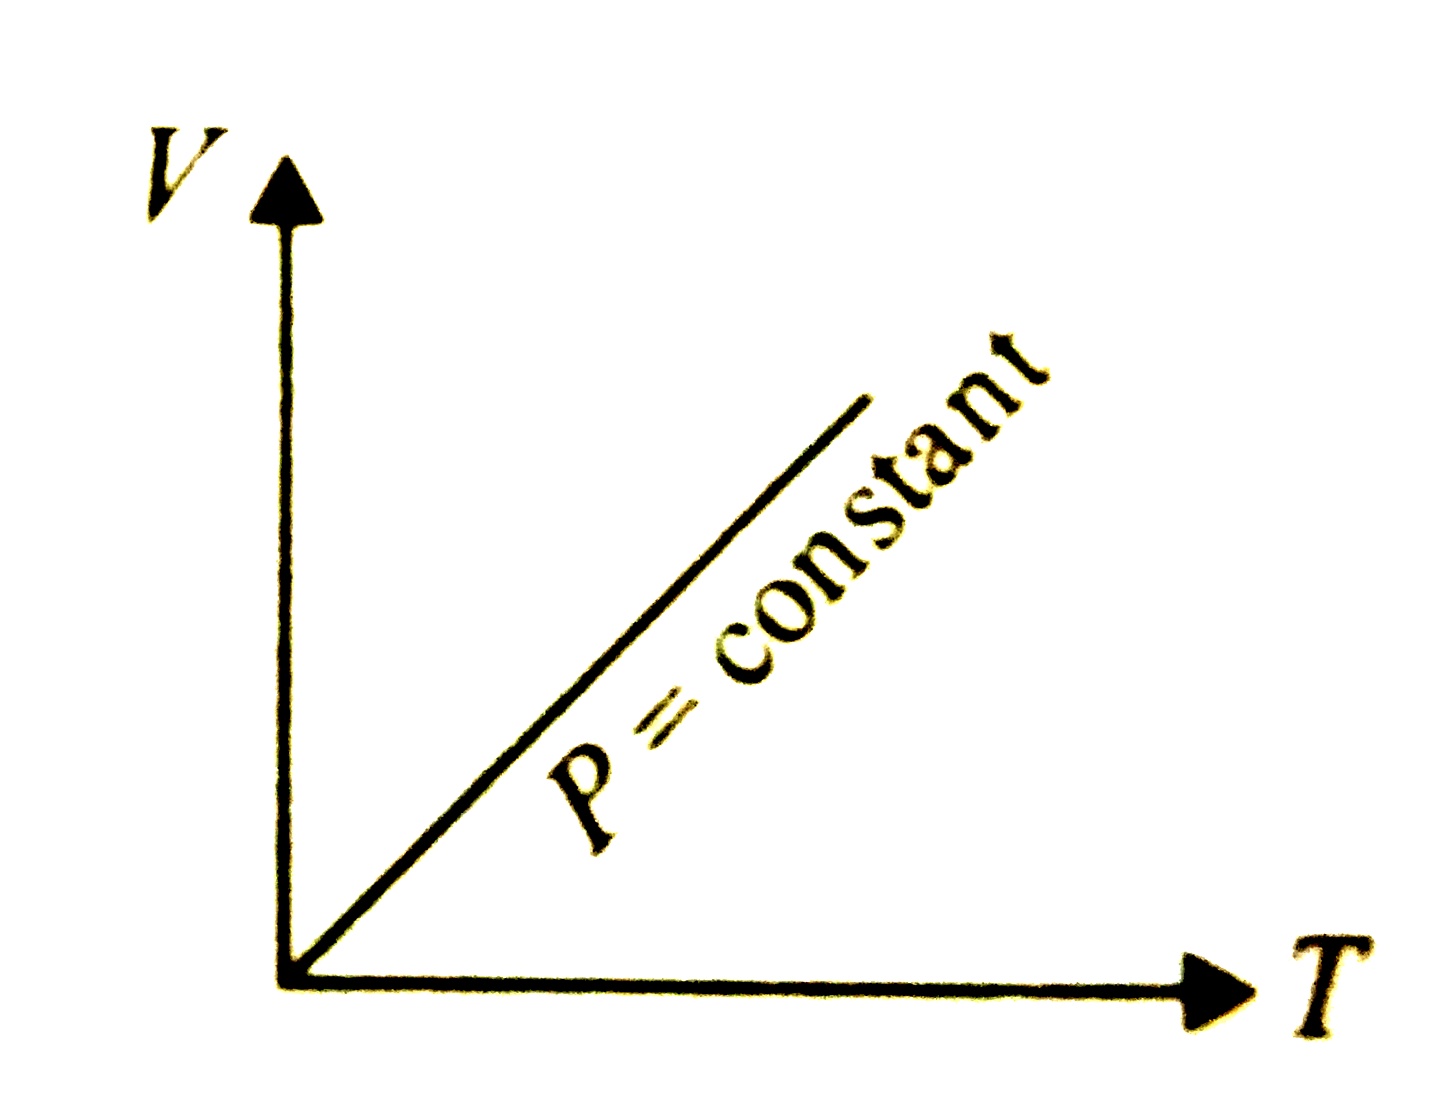 B2.
B2.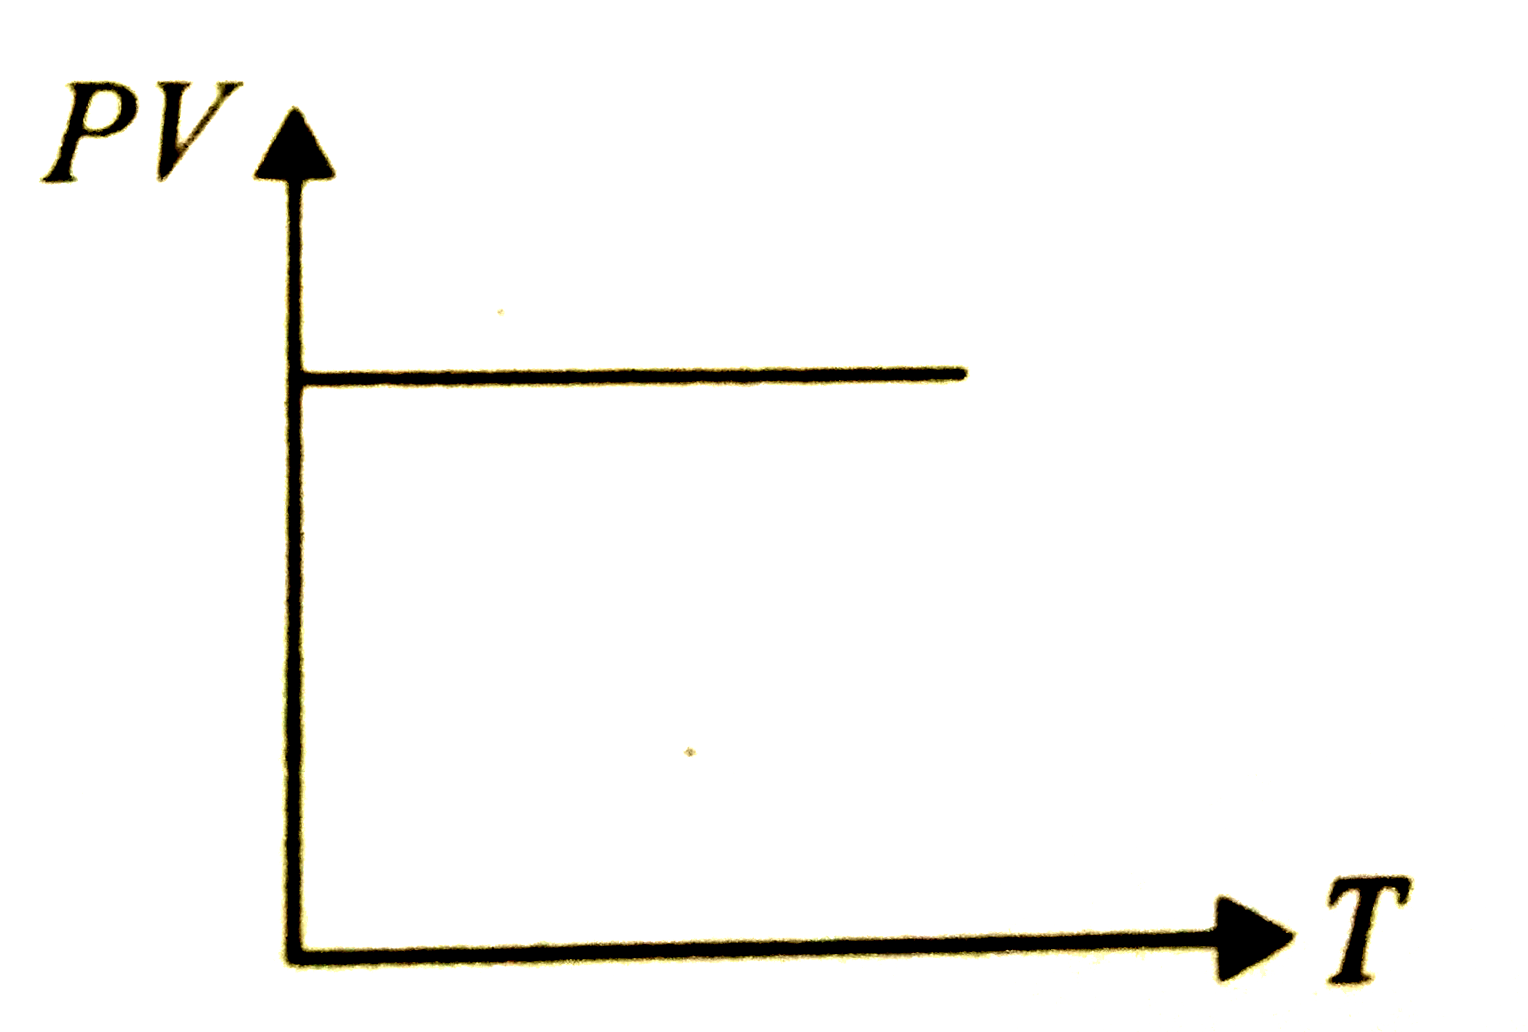 C3.
C3.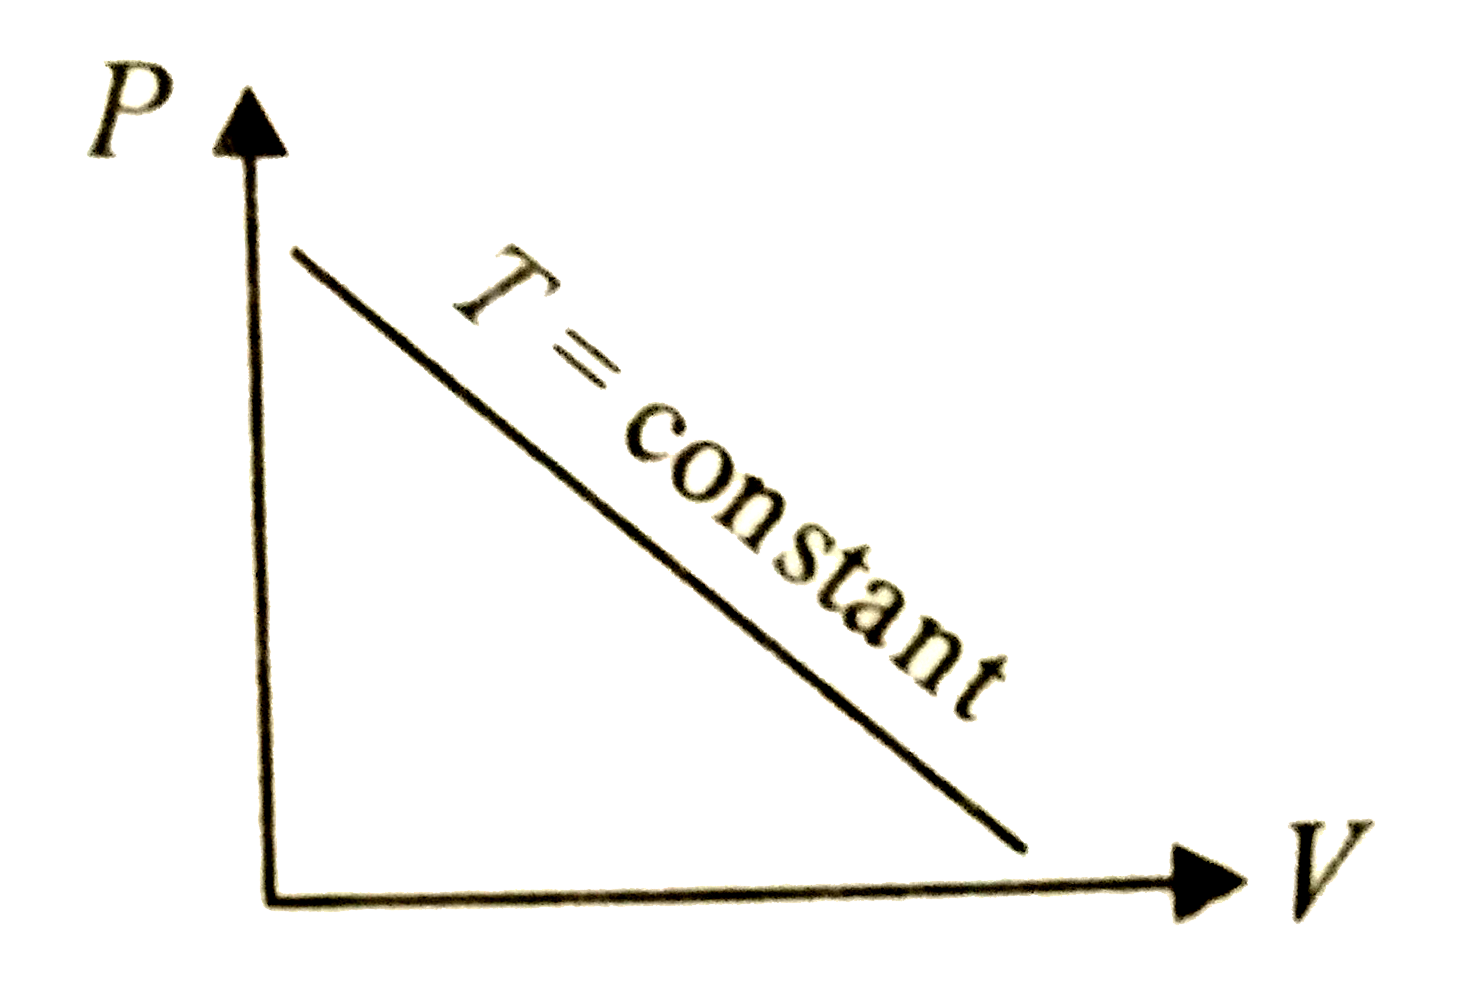 D4.
D4.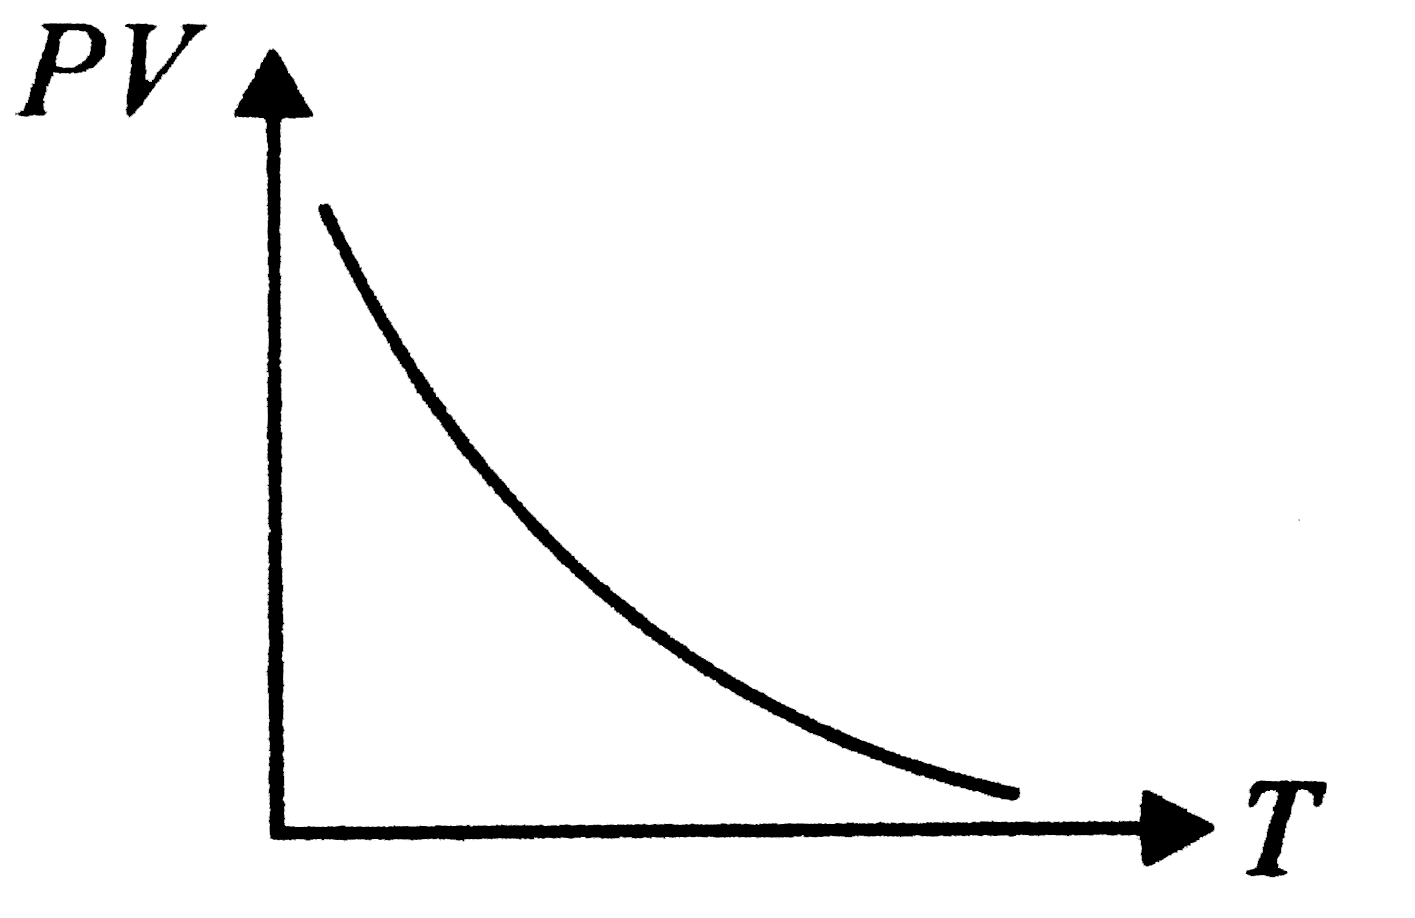
Which of the following graphs represent the behaviour of an ideal gas ?
A B
B C
C D
D
Which curve in figure represents the curve of ideal gas ?
 AOnly BBC and DCE and FDA and B
Which of the following represents logistic growth curve?
View SolutionThe following curves represents the equations of

View SolutionWhich curve in figure represents the curve of ideal gas?

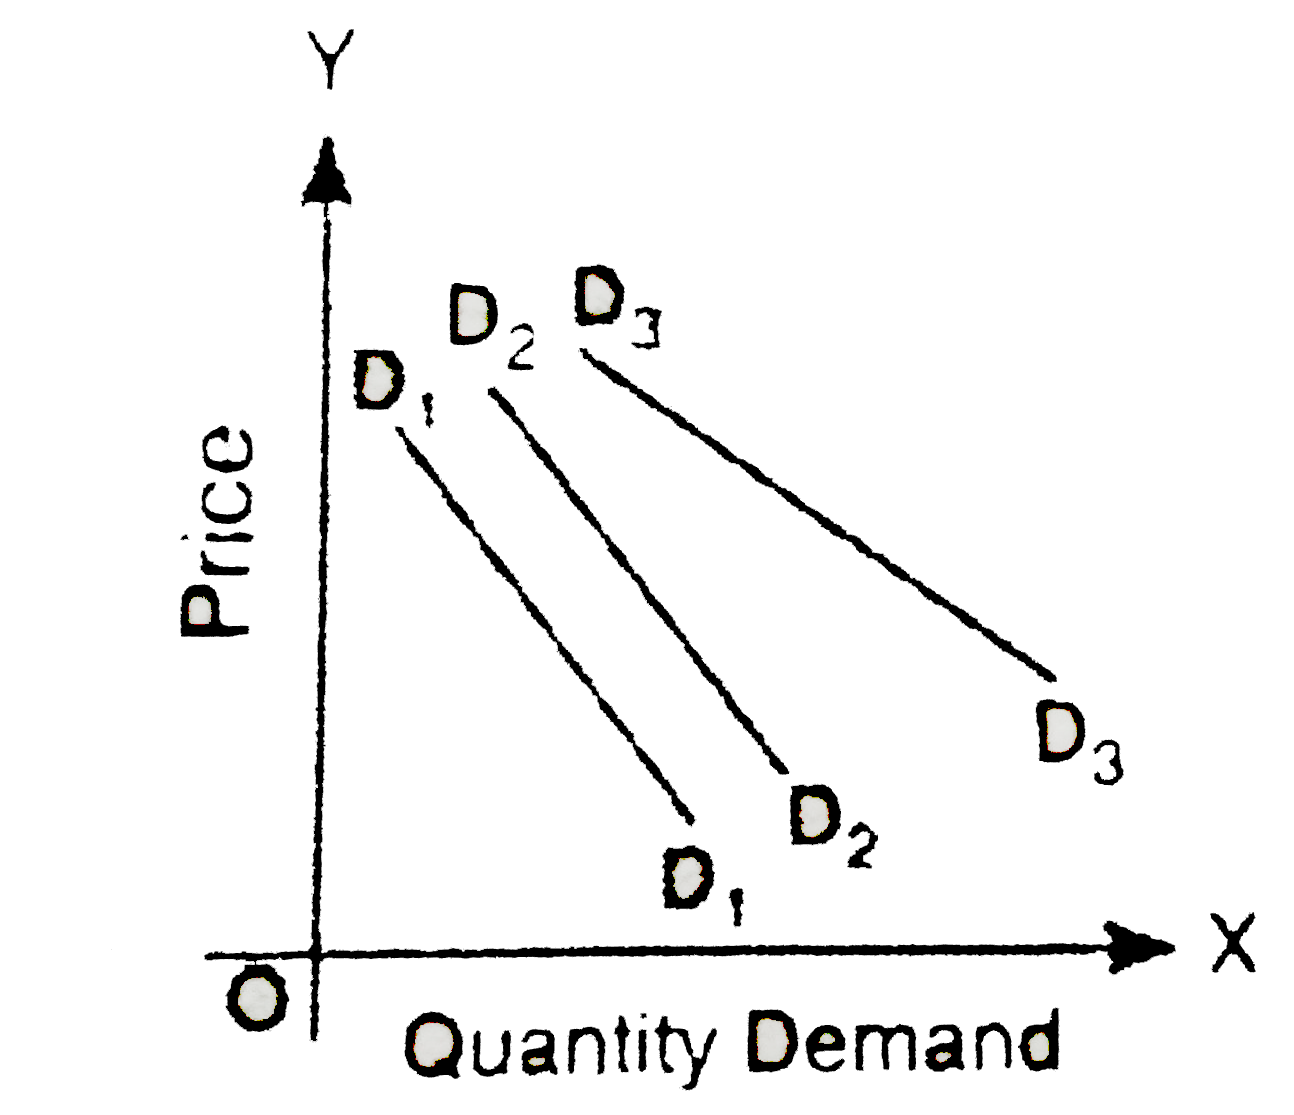
View SolutionWhich of the following represents market demand curve ?
View SolutionWhich of the following curves represents the Henry's law ?
View Solution
