Which of the following represents logistic growth curve?
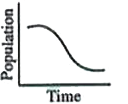
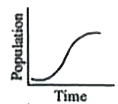


The correct Answer is:B
To determine which option represents a logistic growth curve, we need to understand the characteristics of logistic growth. Here’s a step-by-step breakdown:
Step 1: Understand Logistic Growth
Logistic growth is a model that describes how a population grows in an environment with limited resources. It starts with a period of exponential growth, followed by a slowdown as the population reaches the carrying capacity of the environment.
Step 2: Identify the Axes of the Graph
In a logistic growth curve:
- The Y-axis represents the population size.
- The X-axis represents time.
Step 3: Analyze the Shape of the Curve
The logistic growth curve typically has an S-shaped (sigmoidal) curve:
- Initial Phase: Slow growth as the population starts to increase.
- Exponential Phase: Rapid increase in population size.
- Plateau Phase: Growth slows down as it approaches the carrying capacity, resulting in a straight line.
Step 4: Evaluate the Options
Now, we need to evaluate the given options based on the characteristics of logistic growth:
1. Option A: Represents no growth (death type curve) - Not logistic.
2. Option B: Shows an S-shaped curve - This is the correct answer.
3. Option C: Represents a straight line (stationary growth) - Not logistic.
4. Option D: Shows fluctuating growth (increasing and decreasing) - Not logistic.
Conclusion
Based on the analysis, Option B represents the logistic growth curve.
---
Logistic growth is a model that describes how a population grows in an environment with limited resources. It starts with a period of exponential growth, followed by a slowdown as the population reaches the carrying capacity of the environment.
In a logistic growth curve:
- The Y-axis represents the population size.
- The X-axis represents time.
The logistic growth curve typically has an S-shaped (sigmoidal) curve:
- Initial Phase: Slow growth as the population starts to increase.
- Exponential Phase: Rapid increase in population size.
- Plateau Phase: Growth slows down as it approaches the carrying capacity, resulting in a straight line.
Now, we need to evaluate the given options based on the characteristics of logistic growth:
1. Option A: Represents no growth (death type curve) - Not logistic.
2. Option B: Shows an S-shaped curve - This is the correct answer.
3. Option C: Represents a straight line (stationary growth) - Not logistic.
4. Option D: Shows fluctuating growth (increasing and decreasing) - Not logistic.
Based on the analysis, Option B represents the logistic growth curve.
Topper's Solved these Questions
- ORGANISMS AND POPULATIONSBOOK - AAKASH SERIESCHAPTER - ORGANISMS AND POPULATIONSEXERCISE - EXERCISE-II (POPULATION INTERACTIONS)
1 Videos
- ORGANISMS AND POPULATIONSBOOK - AAKASH SERIESCHAPTER - ORGANISMS AND POPULATIONSEXERCISE - EXERCISE-III (PREVIOUS AIPMT/NEET QUESTIONS)
35 Videos
- ORGANISMS AND POPULATIONSBOOK - AAKASH SERIESCHAPTER - ORGANISMS AND POPULATIONSEXERCISE - EXERCISE-II (WATER-RELATED ADAPTIONS)
2 Videos
- NEURAL CONTROL AND COORDINATIONBOOK - AAKASH SERIESCHAPTER - NEURAL CONTROL AND COORDINATIONEXERCISE - EXERCISE-III( PREVIOUS AIPMT / NEET QUESTIONS)
33 Videos
- PHOTOSYNTHESIS IN HIGHER PLANTS BOOK - AAKASH SERIESCHAPTER - PHOTOSYNTHESIS IN HIGHER PLANTS EXERCISE - Exercise - III
27 Videos
Similar Questions
Knowledge Check
Which of the following curves represent electrostatic field lines correctly?
A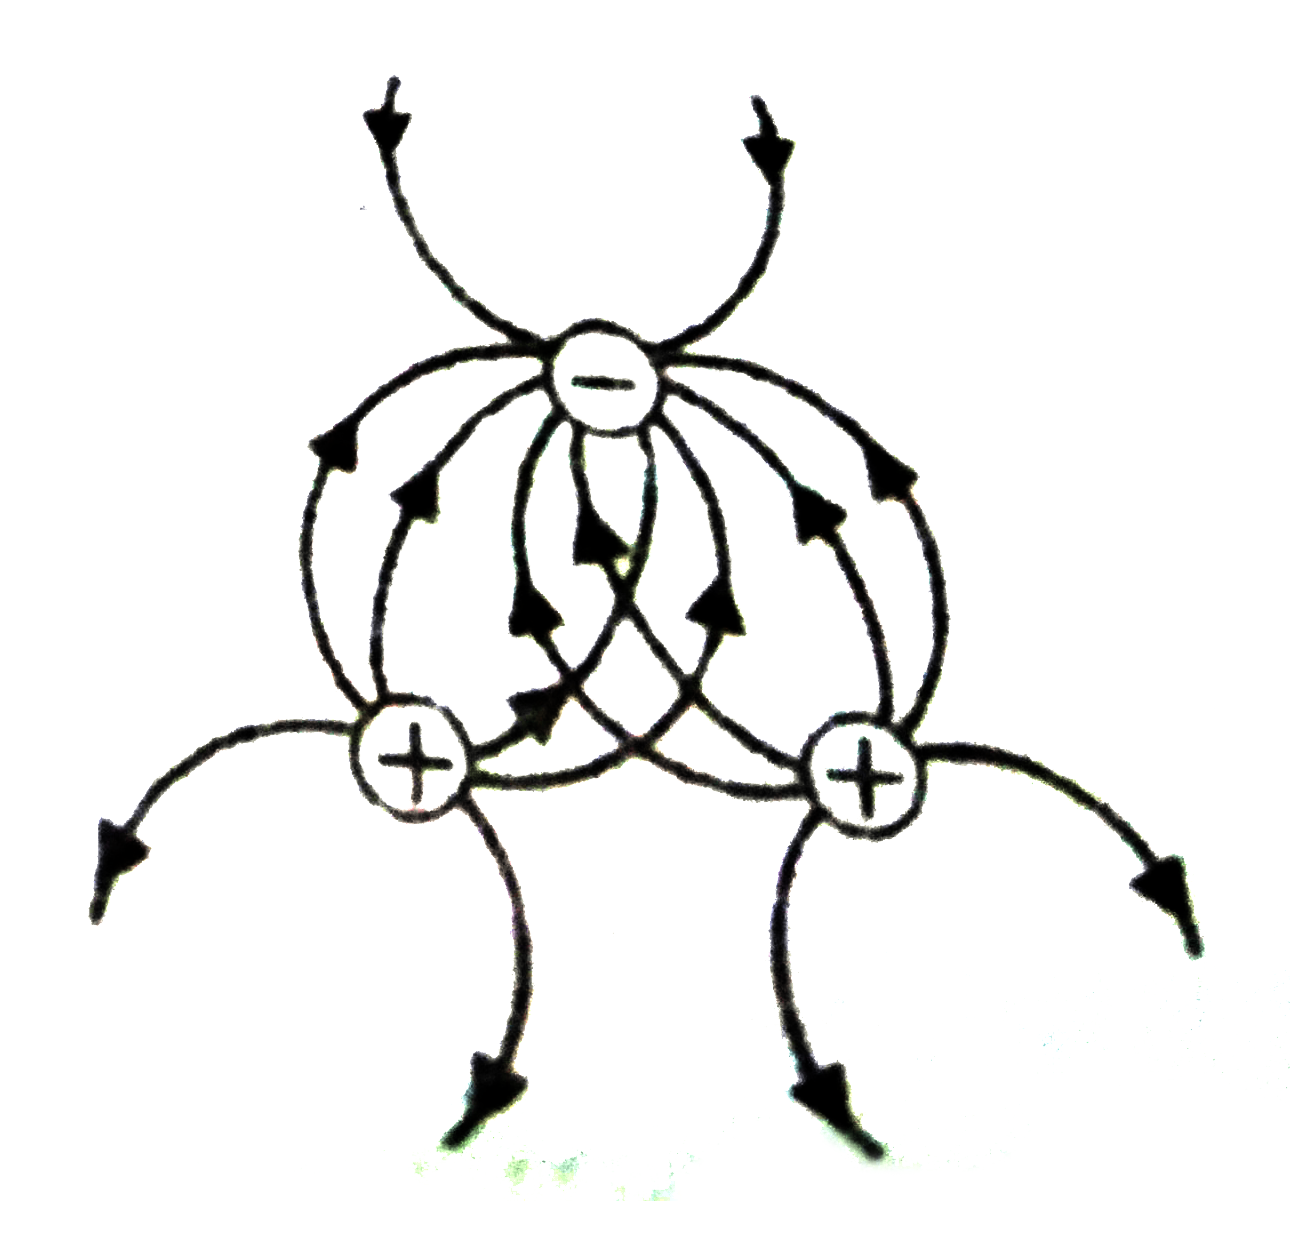 B
B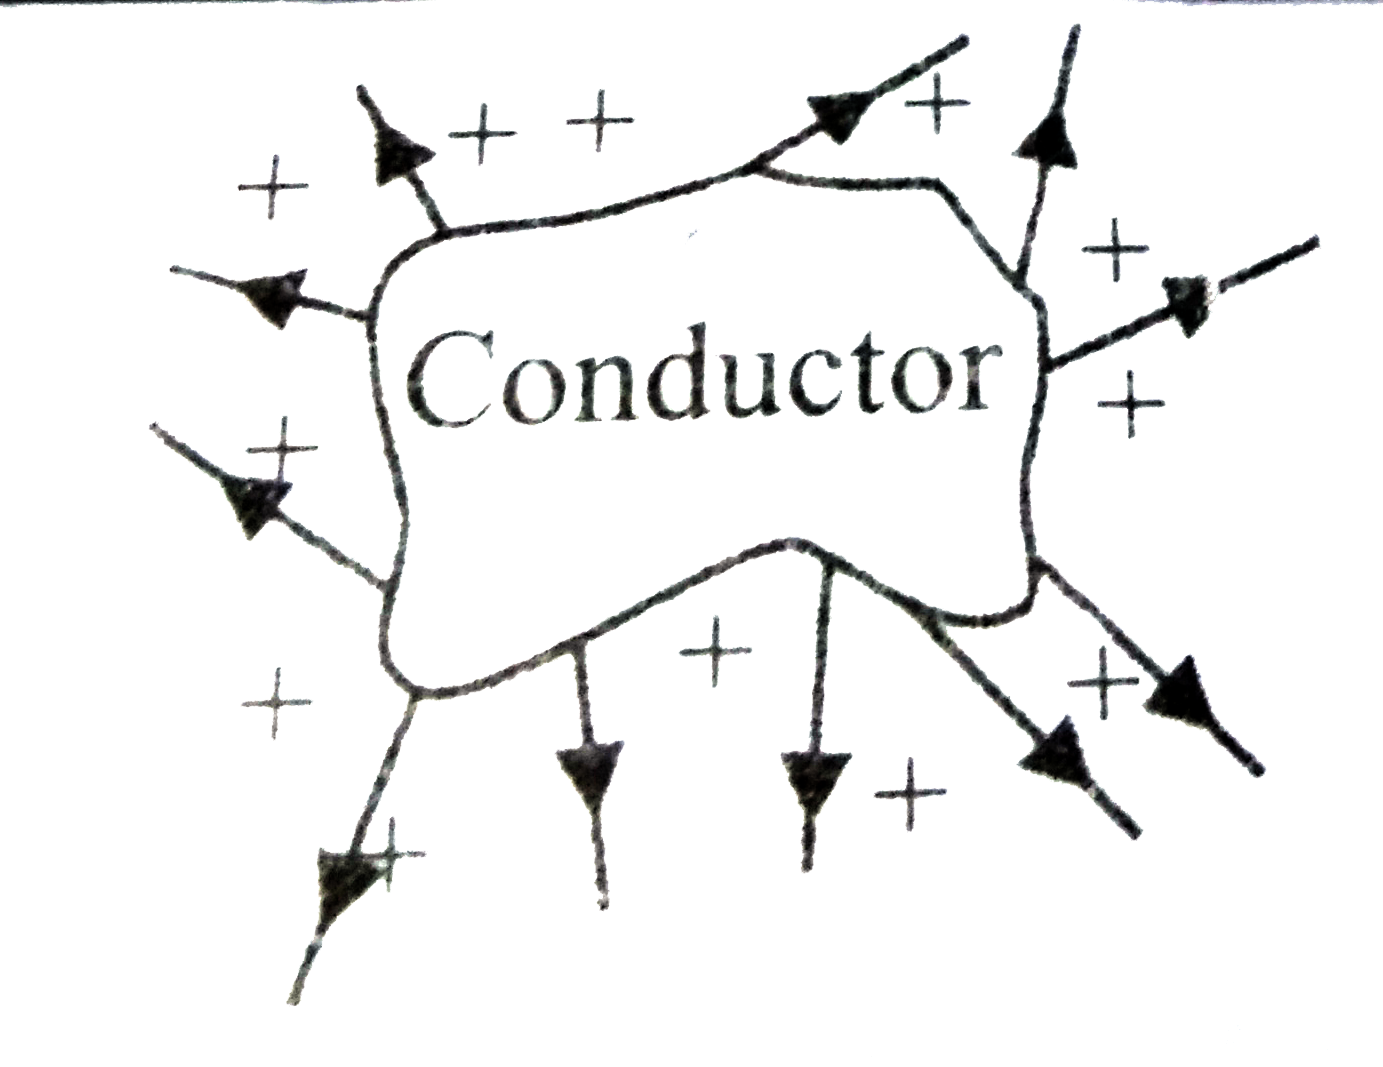 C
C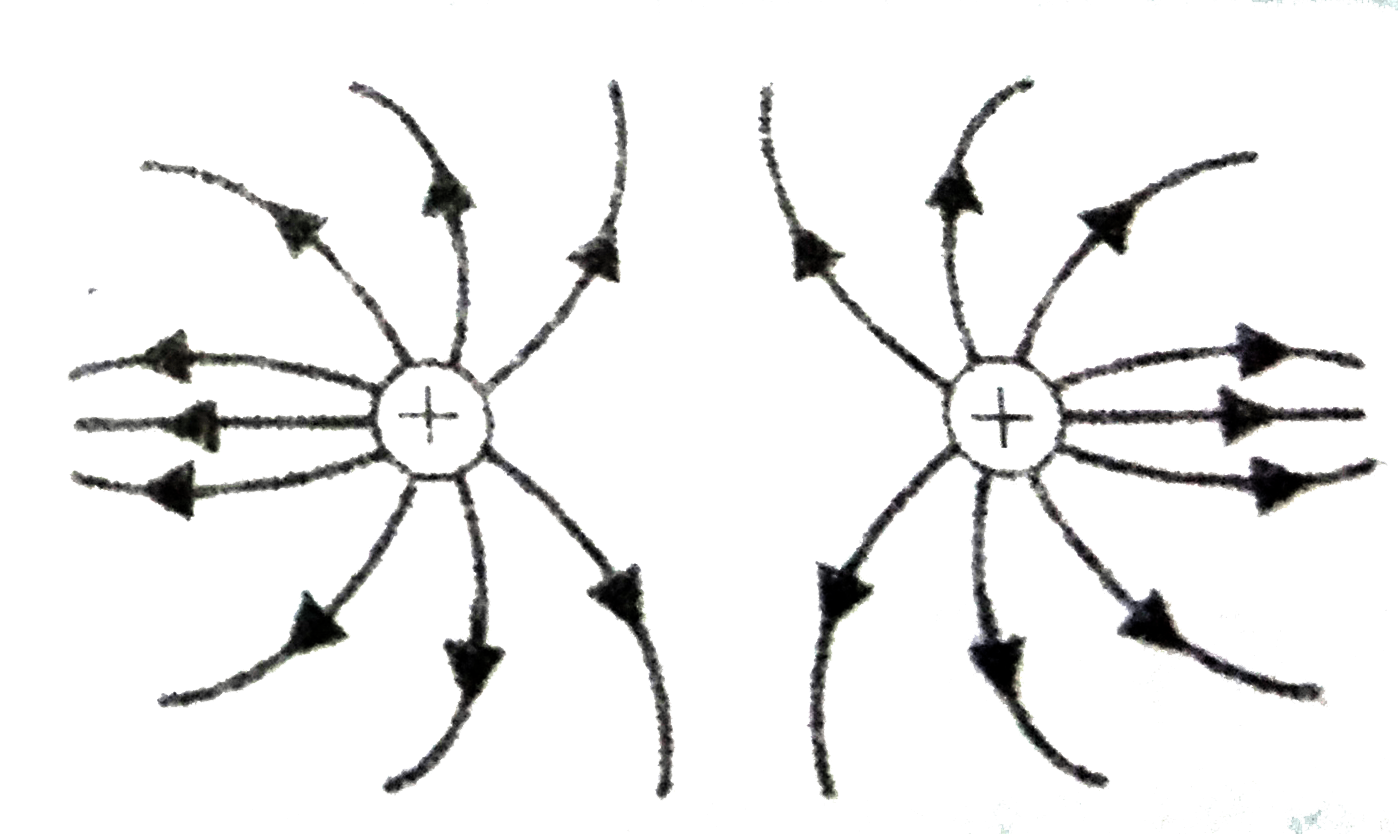 D
D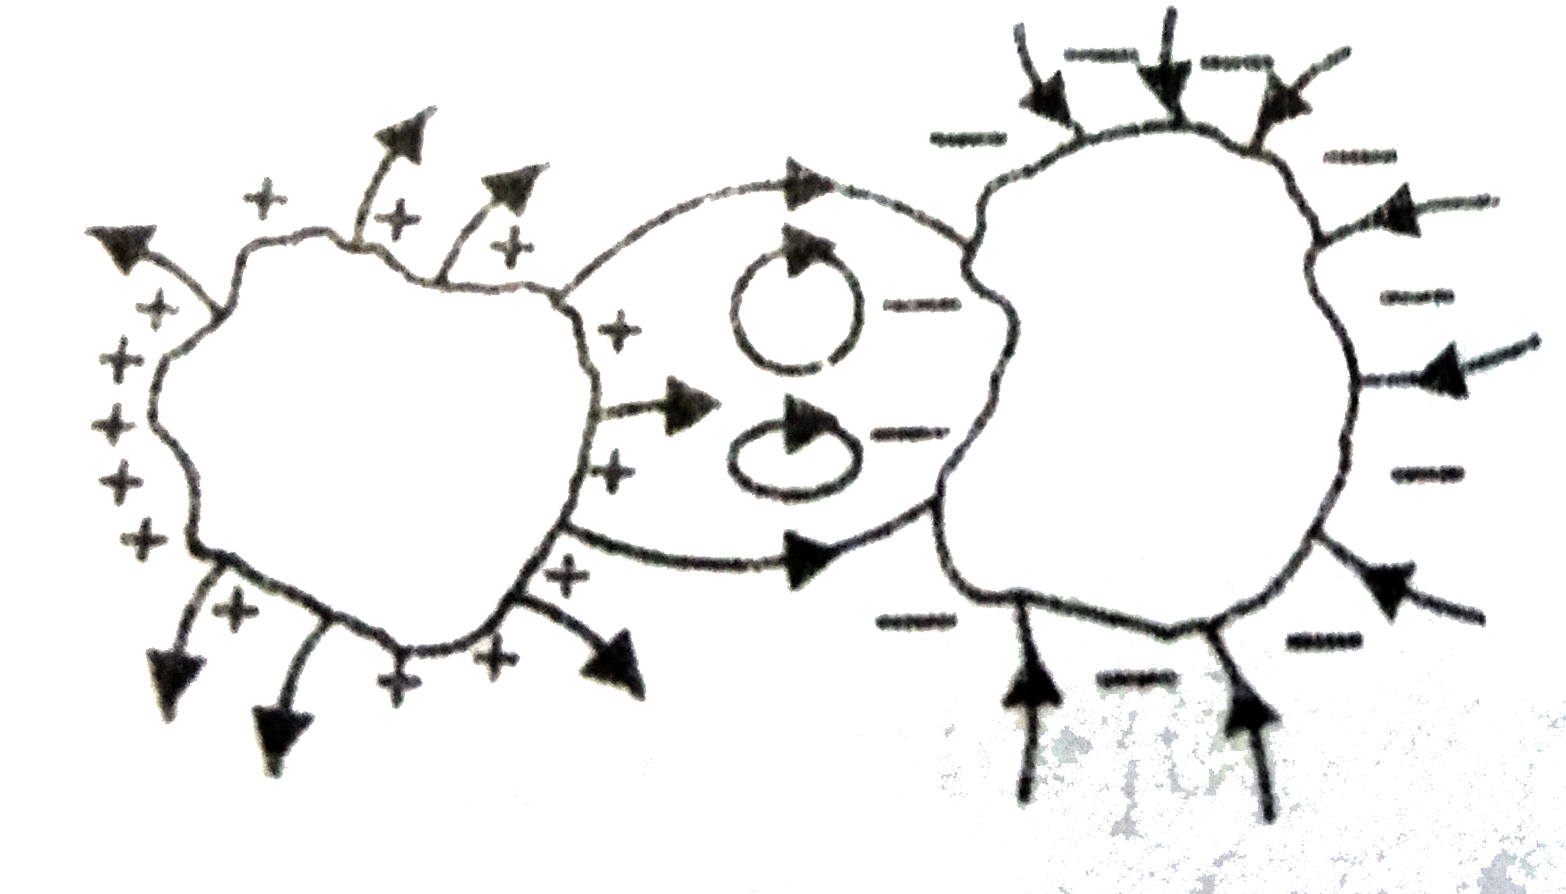
Which of the following can represent the curve x2=−2y ?
View SolutionWhich of the following may represent the curve x = 2y+ 3?
View SolutionThe graph of the function y=f(x). Then which of the following curve represent the graph of the function y=|f(x)|
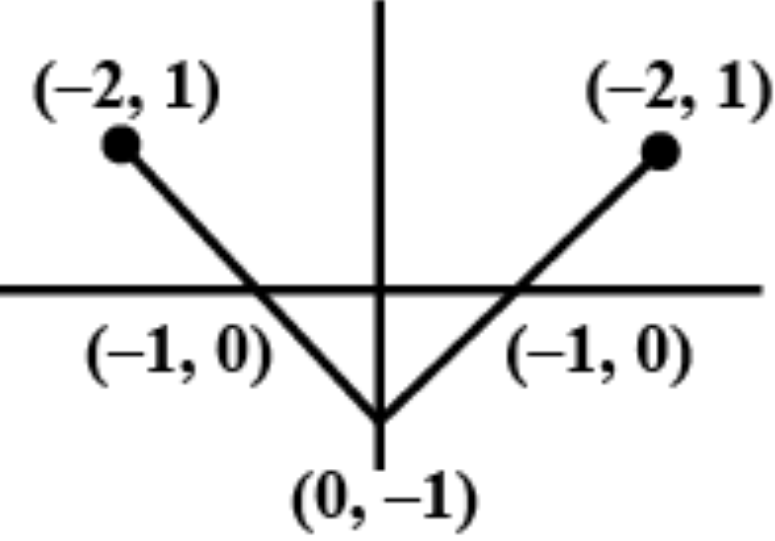
View SolutionWhich of the following curve represents Verhulst Pearl Logistic growth in a populations ?
View SolutionWhich of the following curve represent variation of density of water with temperature best-
View SolutionA cyclic process ABCD is shown is shown in the following P−V diagram. Which of the following curves represent the same process ?
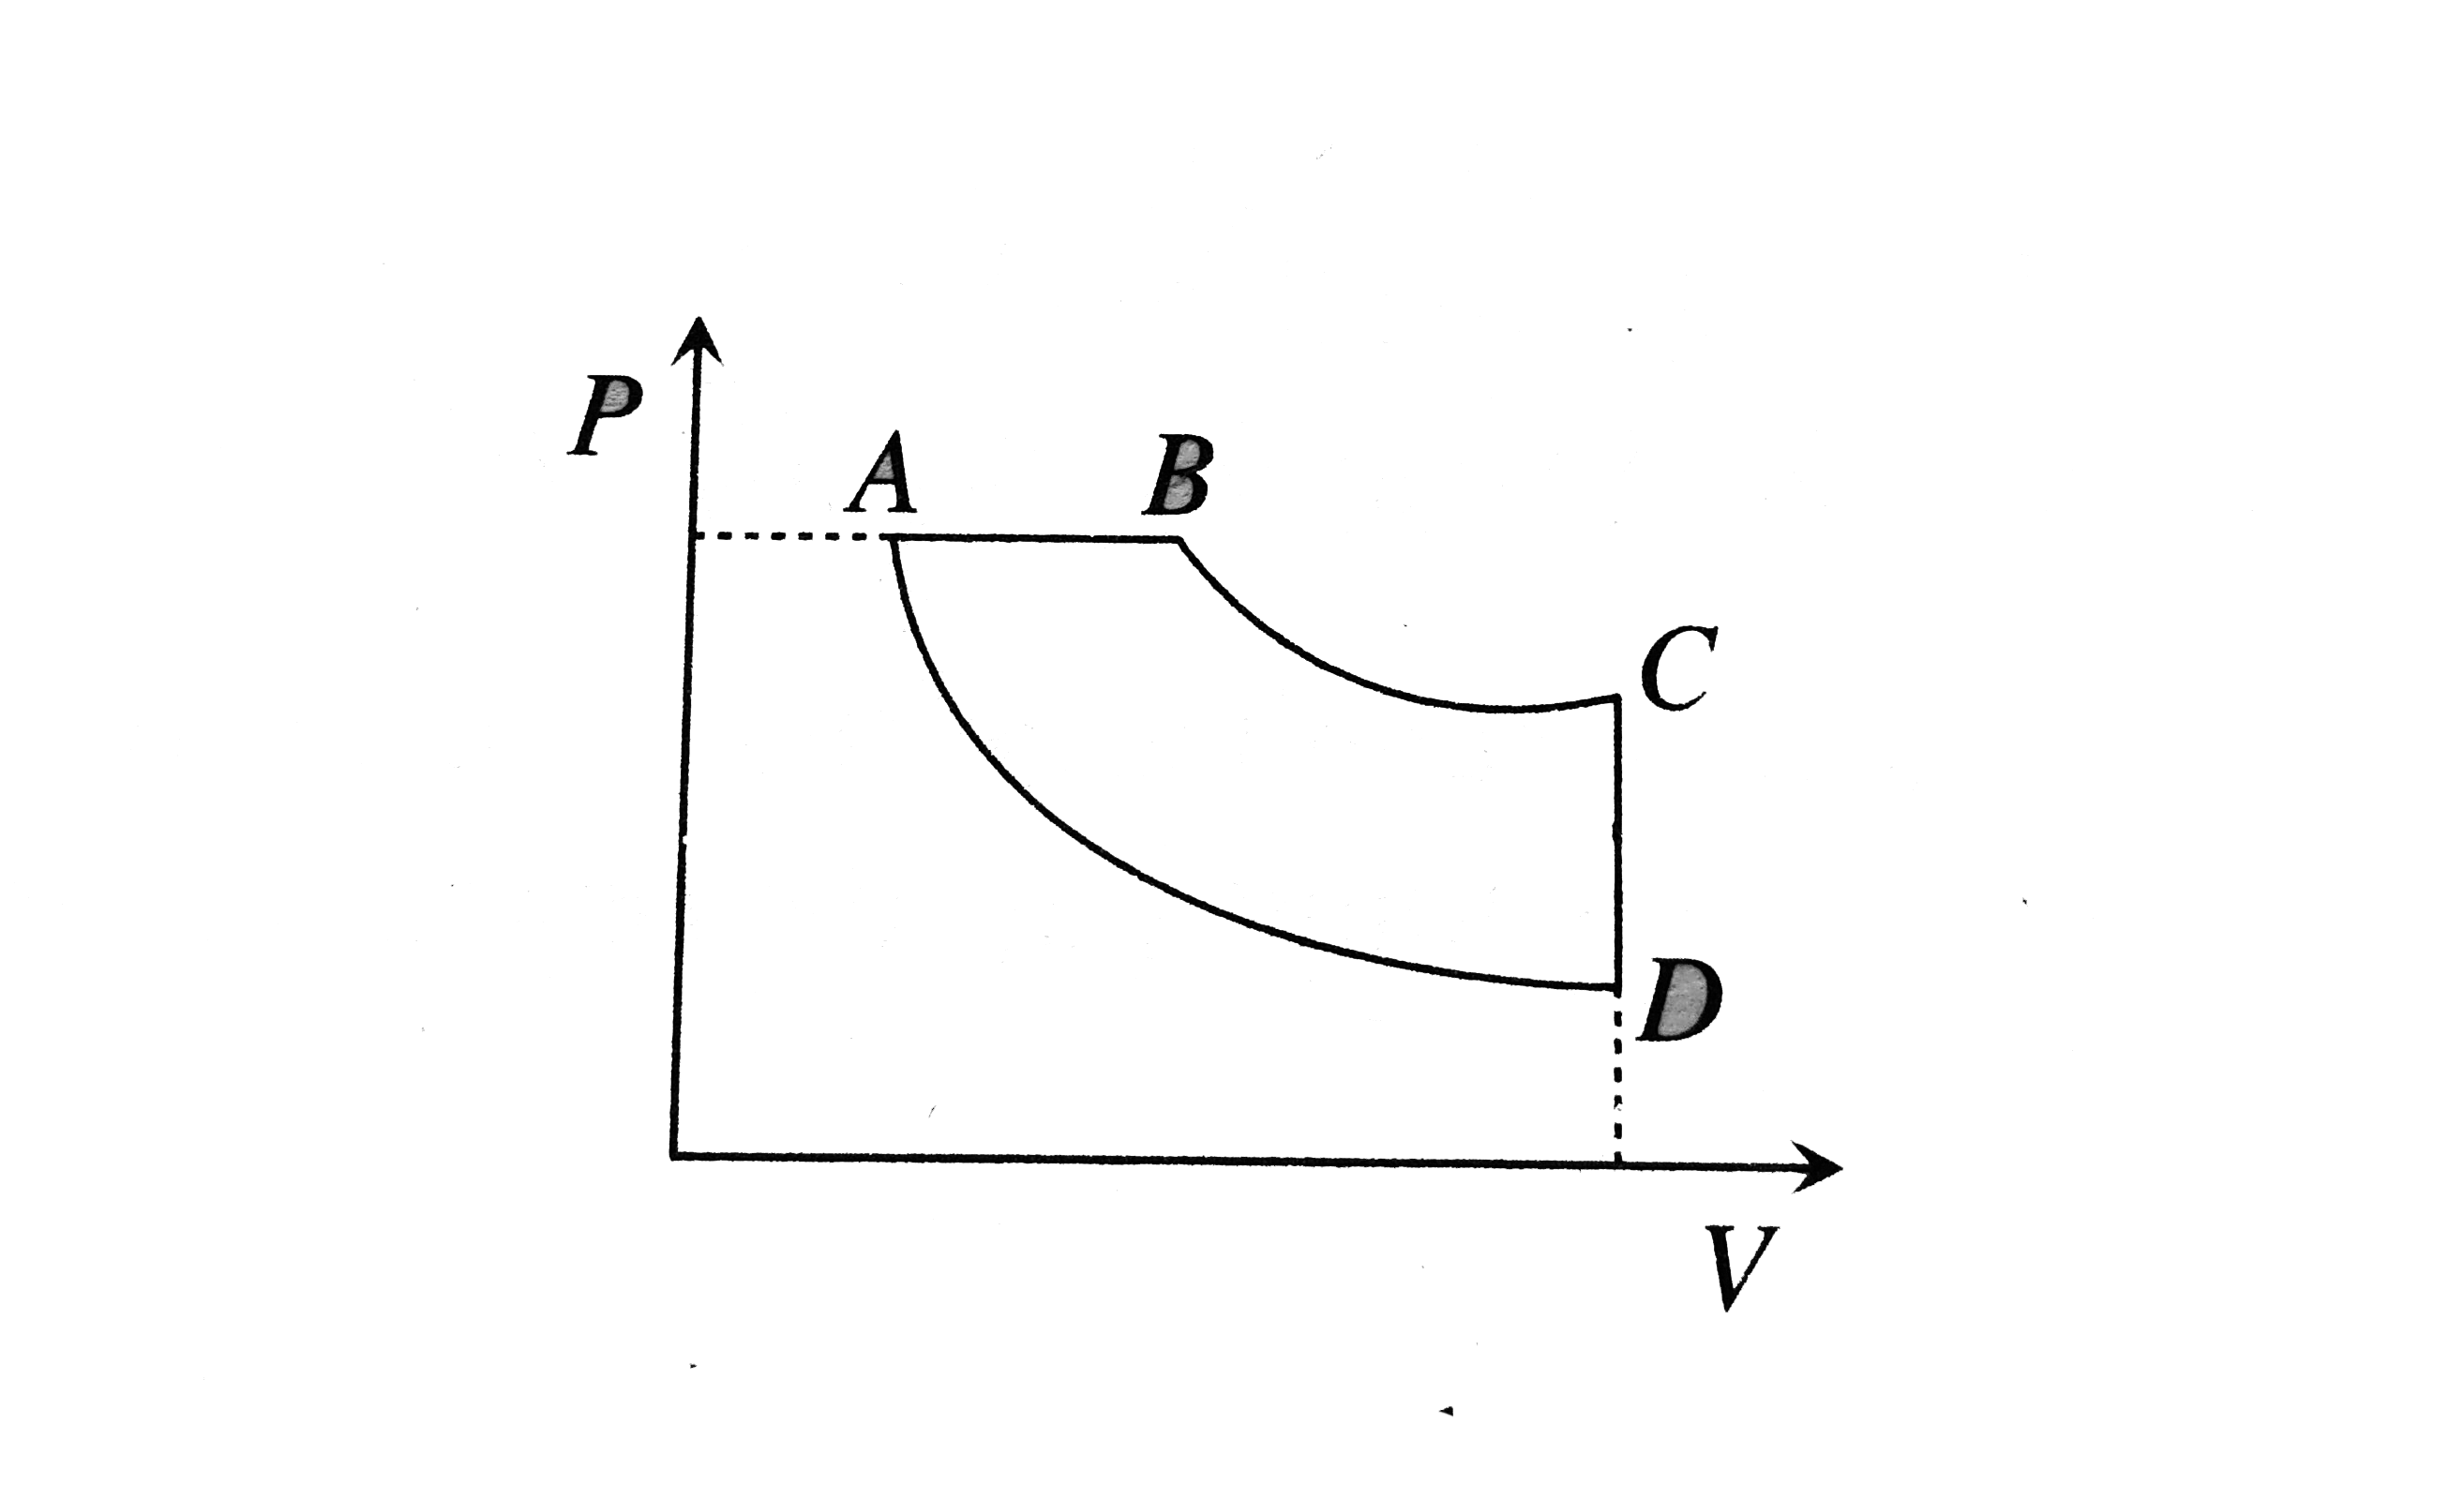
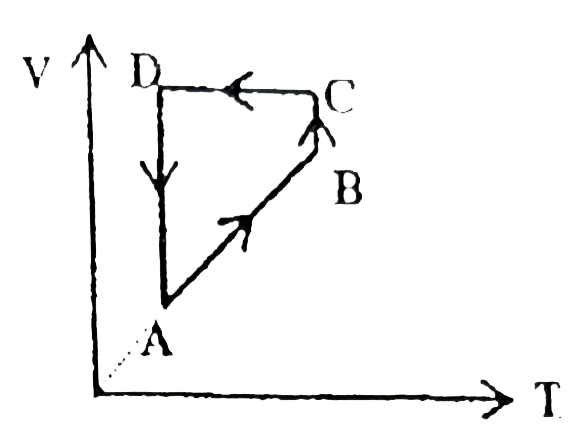
View SolutionA cyclic process ABCD is shown in the V−T diagram. Which of the following curves represent the same process ?
View Solution
