The heights of 50 students, measured to the nearest centimetres, have been found to be as follows: 161,150,154,165,168,161,154,162,150,151,162,164,171,165,158,154,156,172,160,170,153,159,161,170,162,165,166,168,165,164,154,152,153,156,158,162,160,161,173,166,161,159,162,167,168,159,158,153,154,159,
(i) Represent the data given above by a grouped frequency distribution table, taking the class intervals as 160−165,165−170, etc.
(ii) What can you conclude about their heights from the table?
With the given data we can see that the minimum value is 150 and the maximum value is 173.
So, we can create class intervals 150−155,155−160,160−165,165−170,170−175
Then, we can mark the frequency of the number of students with each class interval.
Please refer to video for complete frequency distribution table.
From the frequency distribution table, we can see that,
Number of students having height less than 165 cms =12+9+14=35
Number of students having height less than 165 cms =10+5=15
Thus, we can conclude that 70% of the students have height less than 165 cms.
Topper's Solved these Questions
- BOOK - NCERTCHAPTER - STATISTICSEXERCISE - EXERCISE 14.39videos
STATISTICS
- BOOK - NCERTCHAPTER - STATISTICSEXERCISE - EXERCISE 14.12videos
STATISTICS
- BOOK - NCERTCHAPTER - STATISTICSEXERCISE - Solved Examples14videos
STATISTICS
- BOOK - NCERTCHAPTER - QUADRILATERALSEXERCISE - SOLVED EXAMPLES8videos
QUADRILATERALS
- BOOK - NCERTCHAPTER - SURFACE AREAS AND VOLUMESEXERCISE - EXERCISE 13.810videos
SURFACE AREAS AND VOLUMES
Similar Questions
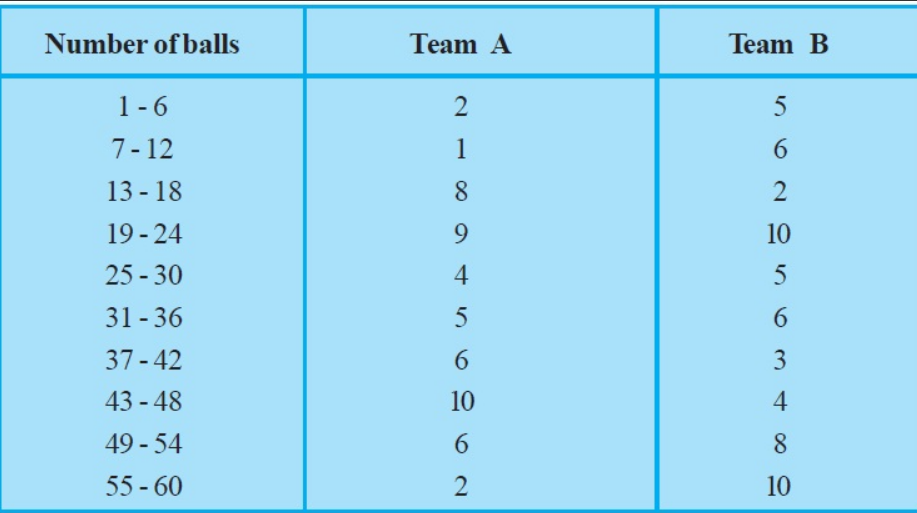
The runs scored by two teams A and B on the first 60 balls in a cricket match are given below:

Represent the data of both the teams on the same graph by frequency polygon.05:35View SolutionGive five examples of data that you can collect from your day-to-day life.
03:53View SolutionA family with a monthly income of Rs 20,000 had planned the following expenditures per month under various heads
05:16View SolutionShow that each angle of a rectangle is a right angle.
02:06View SolutionA capsule of medicine is in the shape of a sphere of diameter 3.5 mm. How muchMedicine (∈ mm3) is needed to fill this capsule?
02:54View SolutionGiven the height (in cm) of 10 persons , calculate standard deviation and coefficient of variation : 170 , 165 , 150 , 154 , 163 , 169 , 155 , 153 , 164 , 168
05:07View Solution25 बच्चों की ऊँचाइयाँ (cm में ) नीचे दी गई हैः
168, 165, 163, 160, 163, 161, 162, 164, 163, 162, 164, 163, 160, 163, 160, 165, 163, 162, 163, 164, 163, 160, 165, 163, 162
उनकी लम्बाइयों का बहुलक क्या है? यहाँ बहुलक से हम क्या समझते हैं?07:52View Solutionकक्षा नौ के 30 छात्रों की ऊँचाई (सेमी में) नीचे दी गयी है:
155, 158, 154, 158, 160, 148, 149, 150, 153, 159, 161, 148, 157, 153, 157, 162, 159, 151, 154, 156, 152, 156, 160, 152, 147, 155, 163, 155, 157, 153.
एक बारम्बारता बण्टन सारणी बनाइये जिसमें एक वर्ग-अन्तराल 160 - 164 हो।06:01View Solution25 विद्यार्थियों की माध्य ऊँचाई ज्ञात करें। यदि उनकी ऊँचाइयाँ (सेमी में) निम्नाकित हैं:
150, 152, 150, 154, 155, 159, 165, 148, 147, 160, 162, 165, 167, 149, 150, 157, 152, 154, 152, 157, 162, 160, 159, 158, 170.02:08View Solutionनिकटतम सेंटीमीटरों में मापी गई 50 विद्यार्थियों की लंबाइयाँ ये हैं :
161, 150, 154, 165, 168, 161, 154, 162, 150, 151 162, 164, 171, 165, 158, 154, 156, 172, 160, 170 153, 159, 161, 170, 162, 165, 166, 168, 165, 164 154, 152, 153, 156, 158, 162, 160, 161, 173, 166 161, 159, 162, 167, 168, 159, 158, 153, 154, 159
(i) I60-165, 165-170 आदि का वर्ग अंतराल लेकर ऊपर दिए गए ऑकड़ों को एक वर्गीकृत बारम्बारता बंटन सारणी के रूप में निरूपित कीजिए।
(ii) इस सारणी की सहायता से आप विद्यार्थियों की लंबाइयों के संबंध में क्या निष्कर्ष निकाल सकते हैं?03:53View Solutionयदि 8 छात्रों की ऊँचाइयाँ सेन्टीमीटर में निम्नलिखित हैं, तो इनका समान्तर माध्य तथा मानक विचलन निकालें ।
162, 163, 160, 164, 160, 170, 161, 164.07:34View SolutionThe heights of the 50 pupils were measured to the nearest cm, the measurements being as follows. 161, 150, 154, 165, 168, 161, 154, 162, 150, 151, 162, 164, 171, 165, 158, 154, 156, 172, 160, 170, 153, 159, 161, 170, 162 165, 166, 168, 165, 164, 154, 152, 153, 156, 158, 162, 160, 161, 173, 166, 161, 159, 162, 167, 168, 159, 158, 153, 154, 159 (i) Take the variants 160 - 165, 165 - 170, etc. and represent the above data in a distributed version distribution table. (ii) What conclusions can you draw about the heights of the students from this table?
00:58View SolutionThe heights of 50 students, measured to the nearest centimetres, have been found to be as follows: 161 150 154 165 168 161 154 162 150 151162 164 171 165 158 154 156 172 160 170153 159 161 170 162 165 166 168 165 164154 152 153 156 158 162 160 161 173 166161 159 162 167 168 159 158 153 154 159 (i) Represent the data given above by a grouped frequency distribution table, taking the class intervals as 160 - 165, 165 - 170, etc.(ii) What can you conclude about their heights from the table?
03:18View SolutionHeights of 25 children (in cm) in a school are as given below:168, 165, 163, 160, 163, 161, 162, 164, 163, 162, 164, 163, 160, 163, 163, 164, 163, 160, 165, 163, 162 What is the mode of heights?
07:52View Solutionबच्चों की ऊँचाइयाँ (cm में) नीचे दी गई हैं :
168, 165, 163, 160, 163, 161, 162, 164, 163, 162, 164, 163, 160, 163, 160,165, 163, 162, 163, 164, 163, 160, 165, 163, 162
उनकी लंबाइयों का बहुलक क्या है ? यहाँ बहुलक से हम क्या समझते हैं ?03:18View Solution

