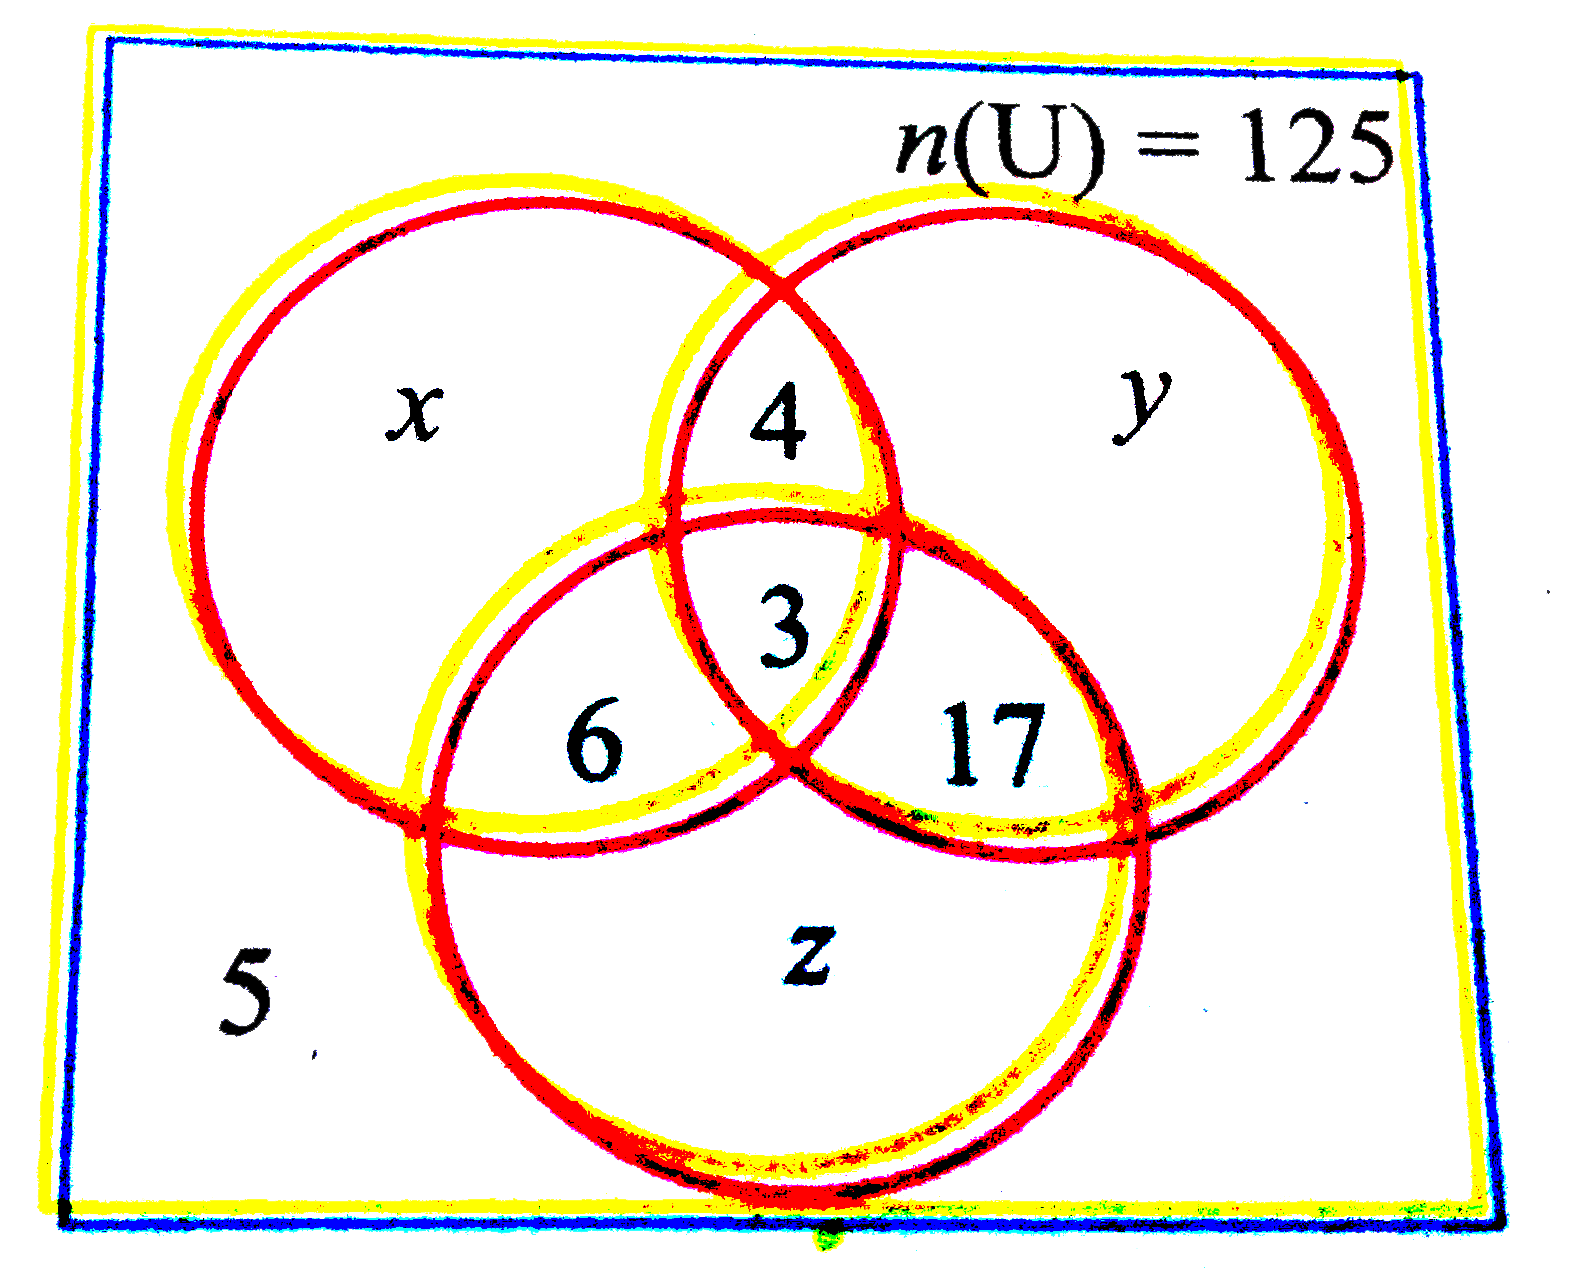
In the adjacent diagram, if n(U) = 125, y is two times of x and z is 10 more than x, then find the value of x, y and z.
 Solution in Tamil
Step by step video & image solution for In the adjacent diagram, if n(U) = 125, y is two times of x and z is 10 more than x, then find the value of x, y and z. by Maths experts to help you in doubts & scoring excellent marks in Class 9 exams.
Updated on:21/07/2023Topper's Solved these Questions
- SET LANGUAGEBOOK - FULL MARKSCHAPTER - SET LANGUAGEEXERCISE - Exercise 1.7 (MCQ)
20 Videos
- SET LANGUAGEBOOK - FULL MARKSCHAPTER - SET LANGUAGEEXERCISE - Text Book Activities
4 Videos
- SET LANGUAGEBOOK - FULL MARKSCHAPTER - SET LANGUAGEEXERCISE - Exercise 1.5
11 Videos
- REAL NUMBERSBOOK - FULL MARKSCHAPTER - REAL NUMBERSEXERCISE - Text Book Activity (Activity 3:)
1 Videos
- STATISTICSBOOK - FULL MARKSCHAPTER - STATISTICSEXERCISE - Assignment (Answer the following question)
10 Videos
Similar Questions
Which of the following is correct?
View SolutionDiscuss and give as many examples of collections from your daily life situations, which are sets and which are not sets.
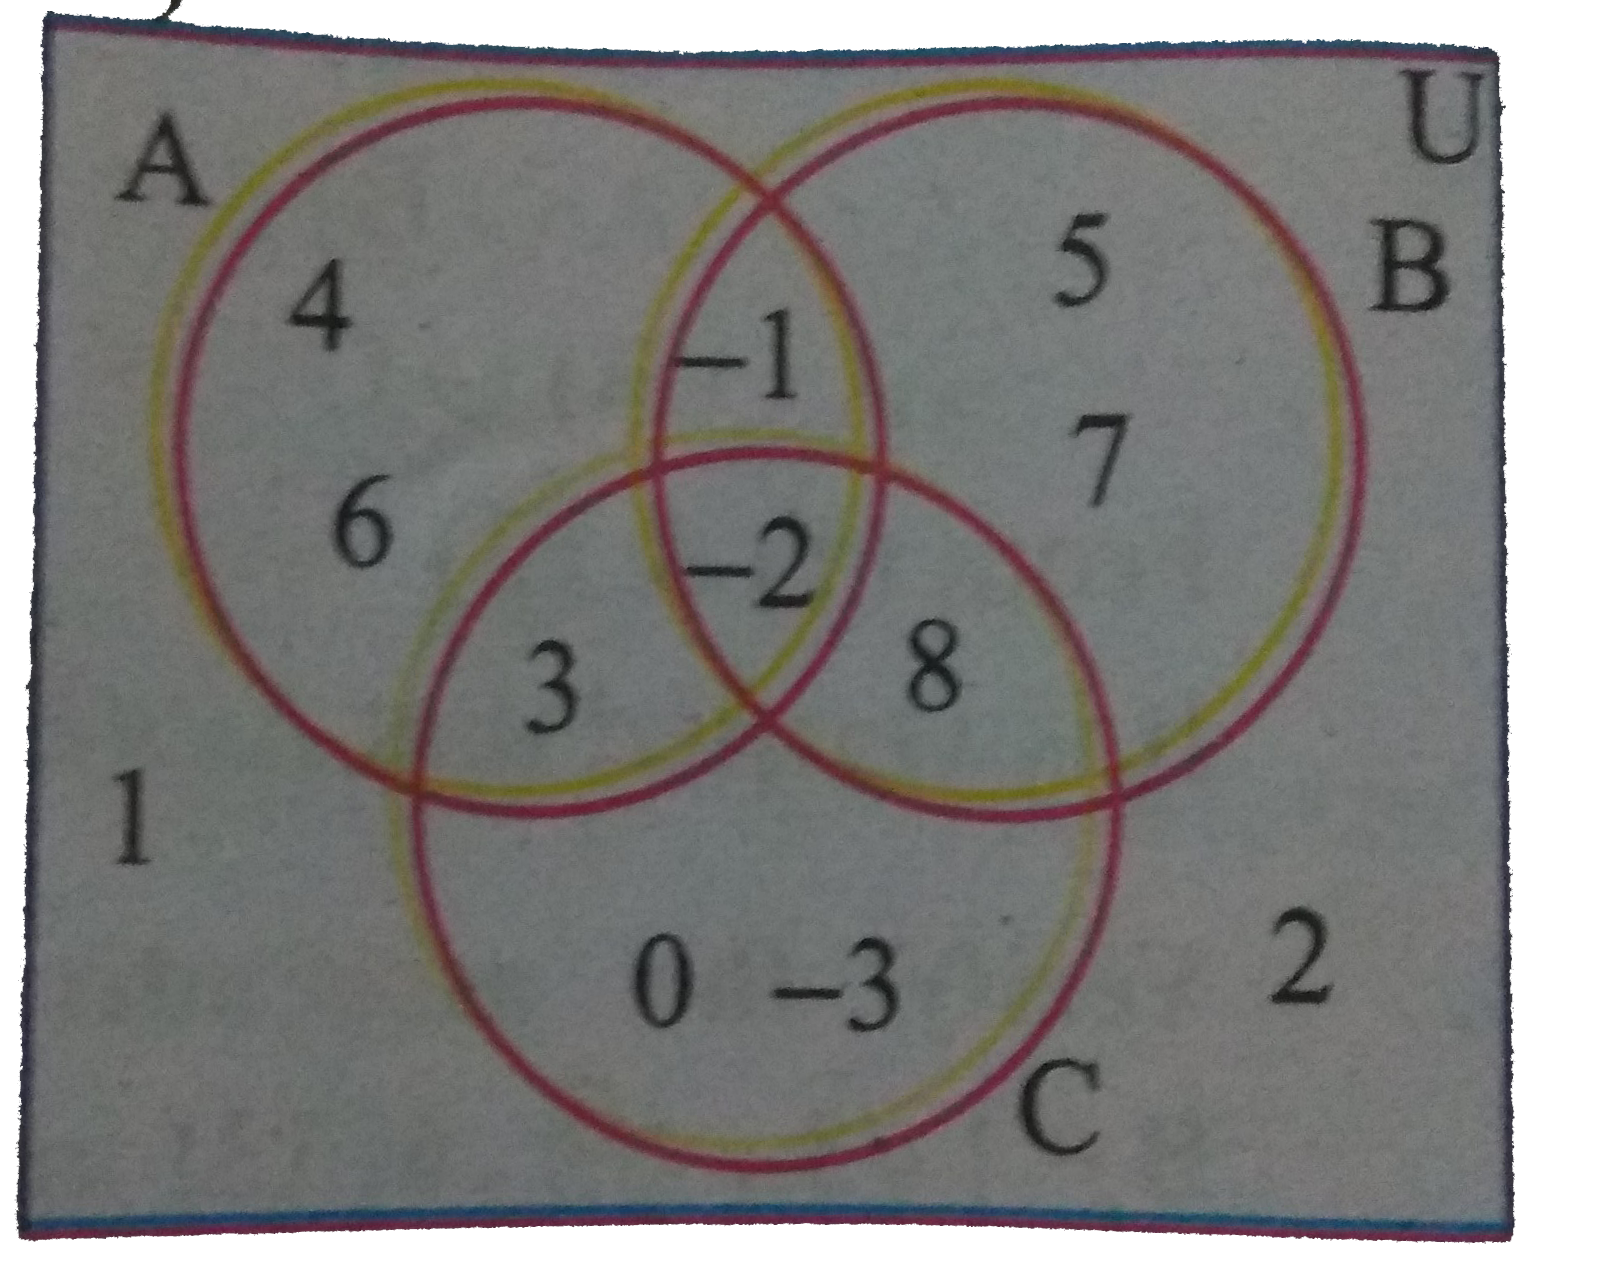
View SolutionUsing the adjacent venn diagram, find the following sets :

(i) A - B
(ii) B - C
(iii) A'∪B'
(iv) A'∩B'
(v) (B∪C)'
(vi) A−(B∪C)
(vii) A−(B∩C)
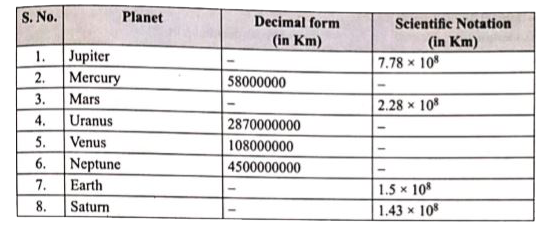
View SolutionThe following list shows the mean distance of the plants of the solar system from the Sun. Complete the following table. Then arrange in order of magnitude starting with the distance of the planet closest to the Sun.

View SolutionIf the mean of 6,x, 4 and 12 is 8 then find the value of x.
View SolutionDetermine the point of symmetry of a regular hexagon.
View SolutionComplete adjectant figure so that X-axis and Y-axis are the lines of symmetry of the completed figure.
View SolutionMatch the following Column A to Column B

View SolutionMatch the following Column A to Column B

View SolutionMatch the following Column A to Column B

View SolutionFind the area of the figure given below.

View SolutionThe inequation represented by the graph given below is :
View SolutionThe inequation that best describes the graph given below is _________
View SolutionThe inequation that best describes the following graph is _________
View SolutionIn fig. O is the center of the circle. Find the value of x.
ltimg src="https://d10lpgp6xz60nq.cloudfront.net/physics_images/PS_MATH_IX_C12_S01_031_Q01.png" width="80%"gt
View SolutionIn Fig, find the value of x.
ltimg src="https://d10lpgp6xz60nq.cloudfront.net/physics_images/PS_MATH_IX_C12_S01_032_Q01.png" width="80%"gt
View Solution
