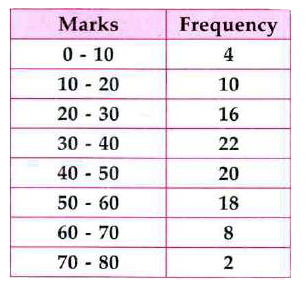
The following information gives the marks scored by the students of a class in an examination. Find the mode of the data.
Here, the given classes are not continuous. Hence, we first rewrite it as shown below:
From the above table it can be observed that the maximum frequency occurs in the class interval 61-80.
.
.
Topper's Solved these Questions
- STATISTICSBook:PEARSON IIT JEE FOUNDATIONChapter:STATISTICSExercise:VERY SHORT ANSWER TYPE QUESTIONS
Explore 30 Videos
- STATISTICSBook:PEARSON IIT JEE FOUNDATIONChapter:STATISTICSExercise:SHORT ANSWER TYPE QUESTIONS
Explore 14 Videos
- SIMPLE INTEREST AND COMPOUND INTEREST Book:PEARSON IIT JEE FOUNDATIONChapter:SIMPLE INTEREST AND COMPOUND INTEREST Exercise:CONCEPT APPLICATION
Explore 1 Video
- TRIGONOMETRY Book:PEARSON IIT JEE FOUNDATIONChapter:TRIGONOMETRY Exercise:Level 3
Explore 15 Videos
Similar Questions
The following distribution table shows the marks scored by 140 students in an examination :

Calculate the mode of the distribution.
View SolutionFollowing data gives the marks obtained by 100 students in a test. Find the median

View SolutionThe following table shows marks secured by the students of a class in an examination in English:
Marks0−1010−2020−3030−4040−50Number of Students 20 24 40 36 20
Calculte mean marks using Short-cut Method.
View SolutionThe following table shows marks secured by the students of a class in an examination in English:
Marks0−1010−2020−3030−4040−50Number of Students 20 24 40 36 20
Calculte mean marks using Short-cut Method.
View SolutionThe following table gives the marks scored by 100 students in an entrance examination

Represent this data in the form of a histogram.
View SolutionThe following table shows frequency distribution of marks secured by 100 students in a particular examination. Find the mean of the marks.

View SolutionCaculate mode of the following data :
Marks0−55−1010−2020−4040−6060−8080−9090−100Number of Students 5 7 9 25 30 24 8 6
View SolutionThe following data gives marks obtained by 7 students of a class. Find out standard deviation of the marks.
40,42,38,44,46,48,50
View SolutionThe following table given the marks scored by 50 students in a 100 marks test of Mathematics.
Marks0−2020−4040−6060−80No of 31218107students
A student is selected randomly from the class.
Find the probability that the selected student.
View SolutionThe following table given the marks scored by 50 students in a 100 marks test of Mathematics.
Marks0−2020−4040−6060−80No of 31218107students
A student is selected randomly from the class.
Find the probability that selected student has scored 60 or more than 60 marks.
View Solution