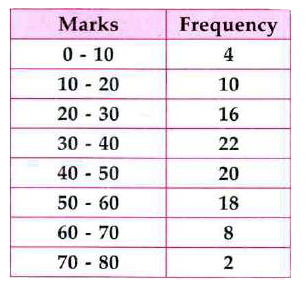
The following distribution table shows the marks scored by 140 students in an examination :

Calculate the mode of the distribution.
The correct Answer is:Modal class = 20 - 30
Mode =20+40−242×40−24−36×10=28
Topper's Solved these Questions
- PRACTICE TEST-1 BOOK - CBSE COMPLEMENTARY MATERIALCHAPTER - PRACTICE TEST-1 EXERCISE - SECTION-C
14 Videos
- PRACTICE TEST-1 BOOK - CBSE COMPLEMENTARY MATERIALCHAPTER - PRACTICE TEST-1 EXERCISE - SECTION-C
14 Videos
- PRACTICE PAPER- I (WITH SOLUTIONS) CLASS: X Mathematics (Standard)BOOK - CBSE COMPLEMENTARY MATERIALCHAPTER - PRACTICE PAPER- I (WITH SOLUTIONS) CLASS: X Mathematics (Standard)EXERCISE - SECTION -D
6 Videos
- PRACTICE TEST-IIBOOK - CBSE COMPLEMENTARY MATERIALCHAPTER - PRACTICE TEST-IIEXERCISE - Section C
14 Videos
Similar Questions
The following frequency distribution table shows marks obtained by 180 students in Mathematics examination :
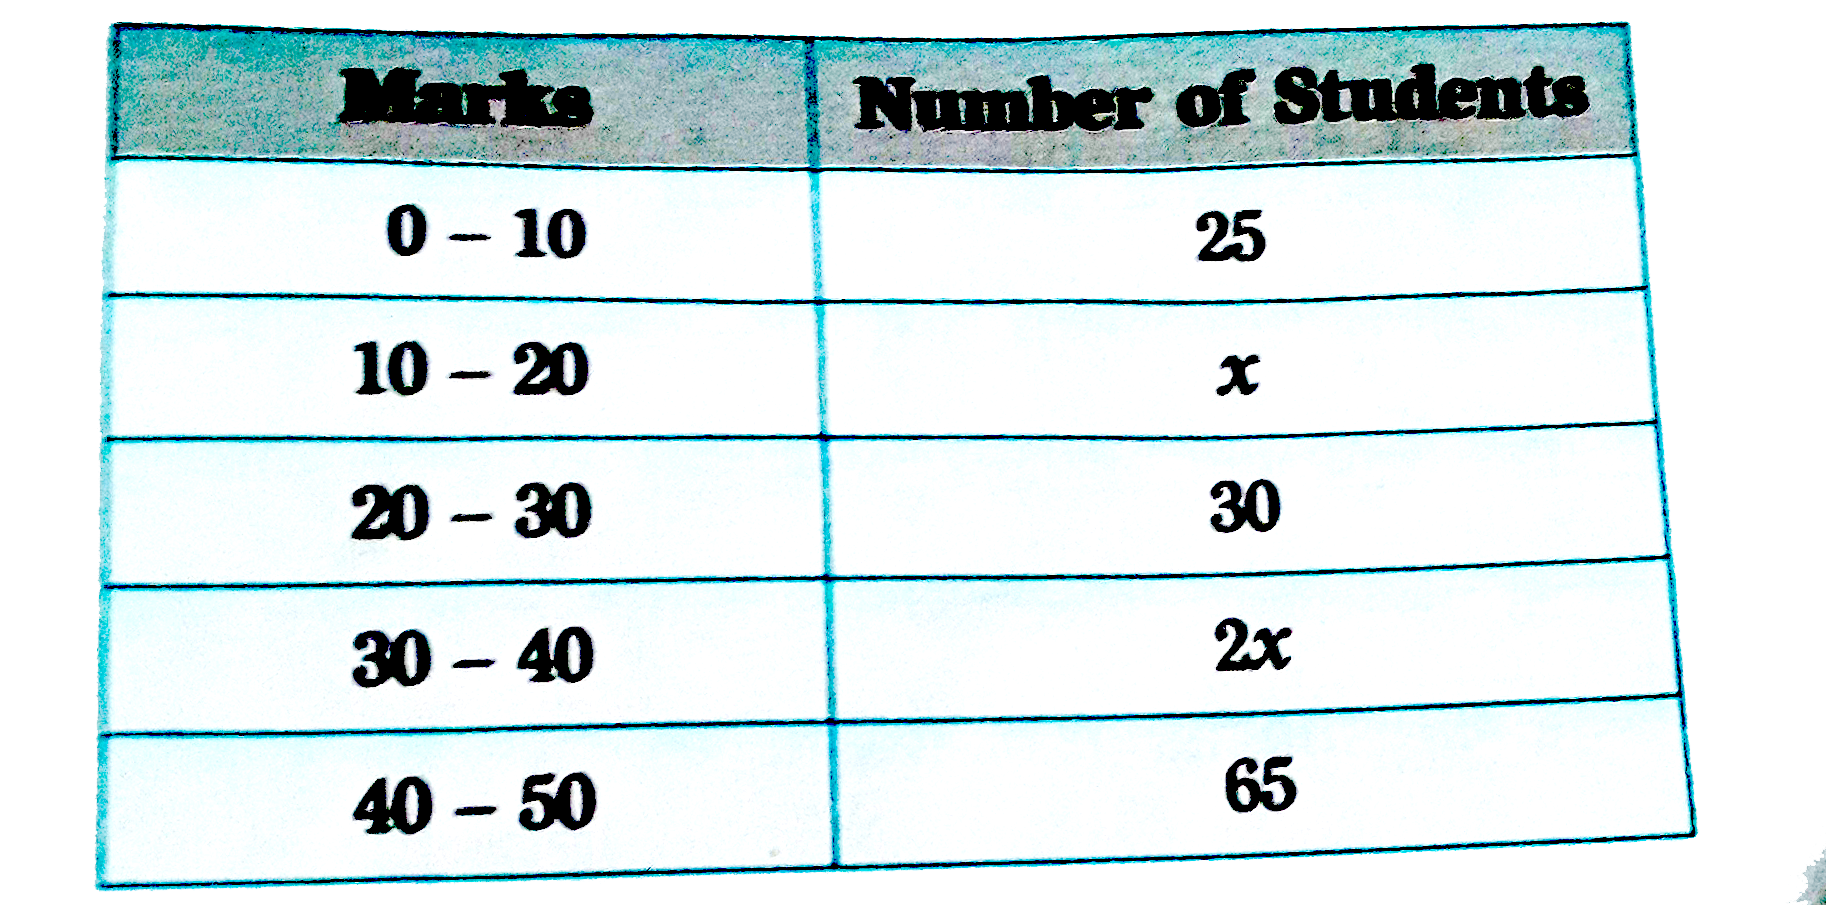
Find the value of x.
Also draw a histogram representing the above informations.
View SolutionThe distribution given below, shows the marks obtained by 25 students in an aptitude test. Find the median and mode of the distribution.
View Solution
Knowledge Check
Find the mode of the following frequency table, which gives the marks scored by 40 students in a test:
 A5B6C3D4
The following pie chart shows the marks obtained by a student in an examination, who scored 720 marks in all. Study the diagram and answer the questions given below.
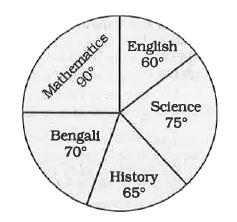
The marks scored in Science areA200B300C75D150The following pie chart shows the marks obtained by a student in an examination, who scored 720 marks in all. Study the diagram and answer the questions given below.
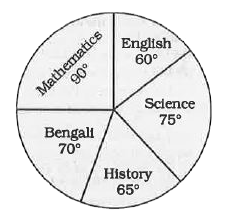
The following pie chart shows the marks obtained by a student in an examination, who scored 720 marks in all. Study the diagram and answer the questions given below.
The marks scored in Mathematics and English together differ from the total marks scored in Bengali, History and Science byA85B61C120D72
The distribution given below show the marks of 100 students of a class:
then find Ogive medium of data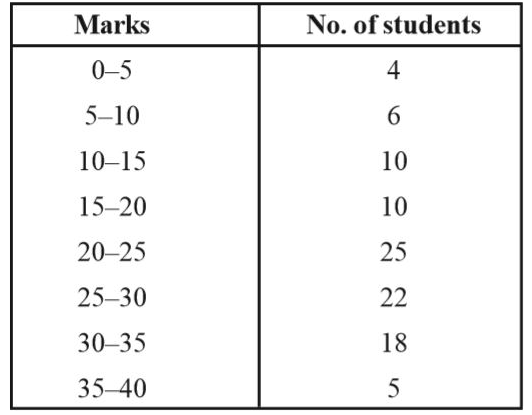
View SolutionThe following table gives the marks scored by 100 students in an entrance examination
Represent this data in the form of a histogram.
View SolutionThe following table shows the marks scored by 140 students in an examination of a certain paper: Marks: 0-10 10-20 20-30 30-40 40-50 No. of students: 20 24 40 36 20 Calculate the average marks by using the assumed mean deviation method.
View SolutionThe following table shows frequency distribution of marks secured by 100 students in a particular examination. Find the mean of the marks.

View SolutionFind the mode of the following frequency table, which gives the marks scored by 40 students in a test:

View Solution
