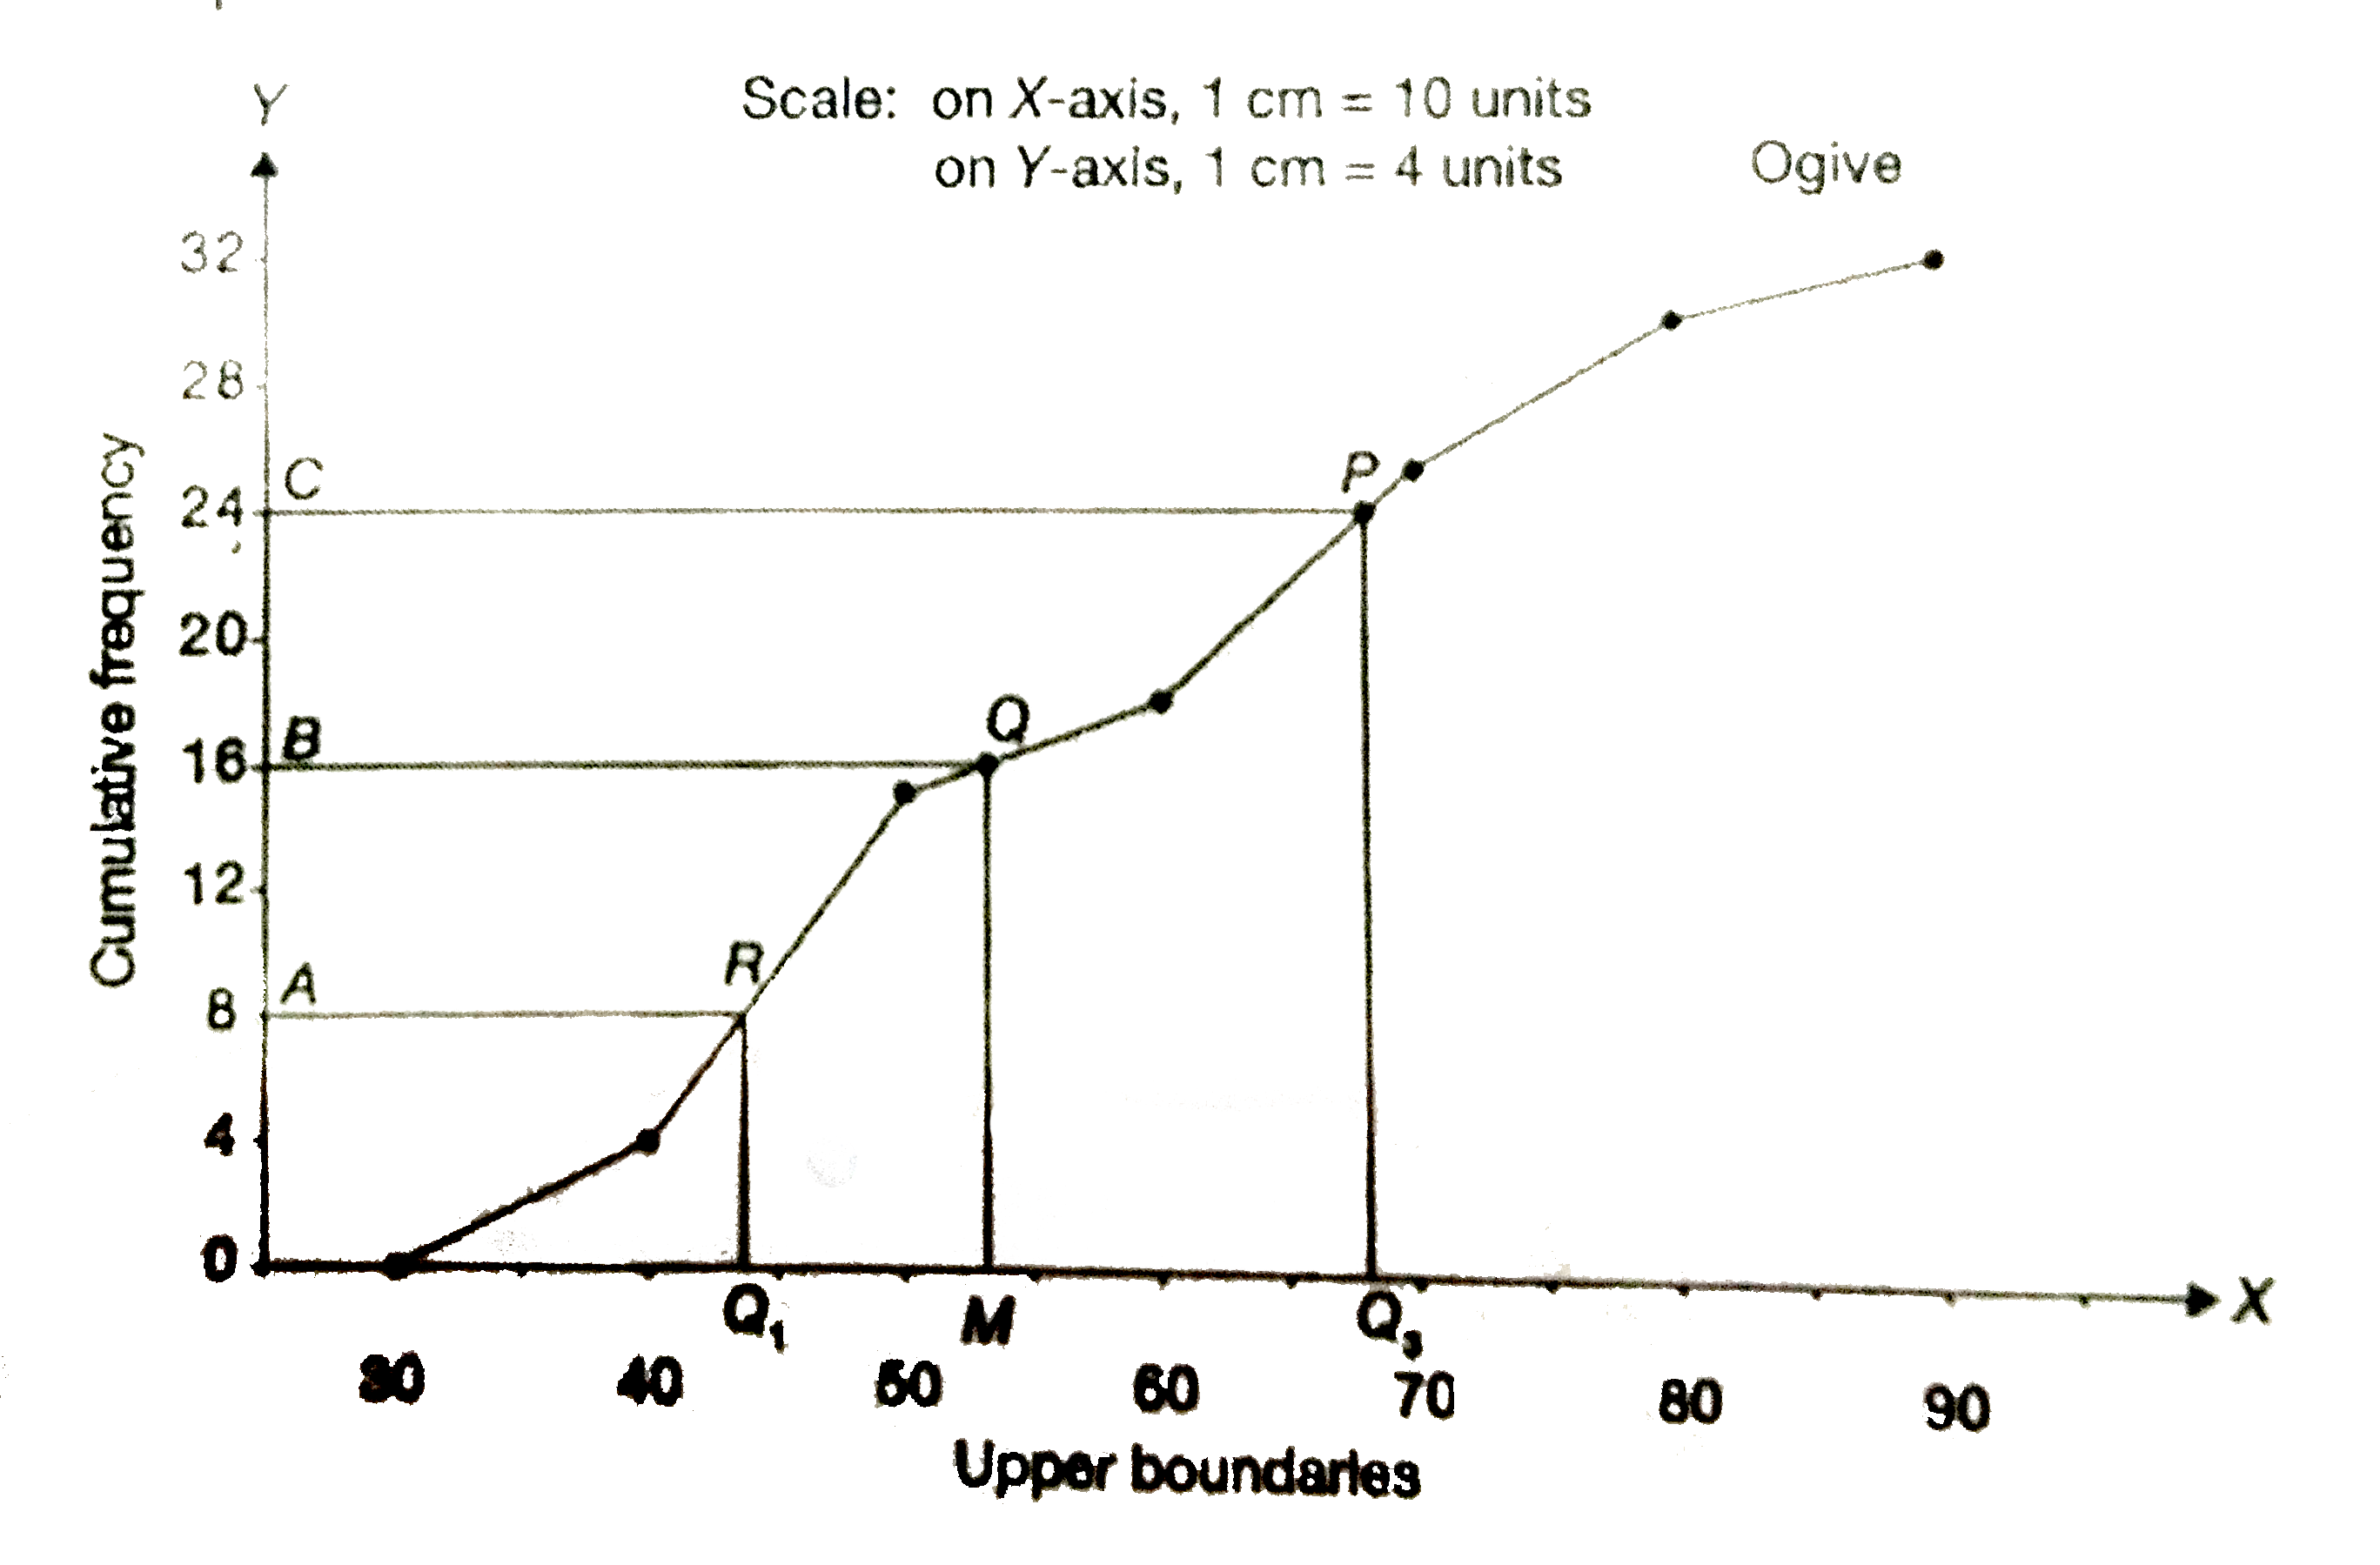
The following table shows the distribution of the percentage of marks of a group of students:
Percentage of Marks30−4040−5050−6060−7070−8080−90Number of Students4113752
Class IntervalNumber of Students(f)Cumulative Frequency 30−40 4 4 40−50 11 15 50−60 3 18 60−70 7 25 70−80 5 30 80−90 2 32 N=32
N=32,N2=16and3N4=24.
From the graph, Lower quartile (Q1)=4 Upper quartile (Q3)=69 Median (M) = 53

Topper's Solved these Questions
- STATISTICSBOOK - PEARSON IIT JEE FOUNDATIONCHAPTER - STATISTICSEXERCISE - VERY SHORT ANSWER TYPE QUESTIONS
30 Videos
- STATISTICSBOOK - PEARSON IIT JEE FOUNDATIONCHAPTER - STATISTICSEXERCISE - SHORT ANSWER TYPE QUESTIONS
14 Videos
- SIMPLE INTEREST AND COMPOUND INTEREST BOOK - PEARSON IIT JEE FOUNDATIONCHAPTER - SIMPLE INTEREST AND COMPOUND INTEREST EXERCISE - CONCEPT APPLICATION
1 Videos
- TRIGONOMETRY BOOK - PEARSON IIT JEE FOUNDATIONCHAPTER - TRIGONOMETRY EXERCISE - Level 3
15 Videos
Similar Questions
The following table gives distributionn of marks secured by some stidents :
Wege Rate (Rs.)10−2020−3030−4040−5050−6060−7070−80Number of Students 42 38 120 84 48 36 31 Calculate the median marks secured by the students.
View SolutionConstruct a frequency polygon for the following distribution, using a graph sheet :
Marks30−4040−5050−6060−7070−8080−90No. of students 6 15 28 34 18 8
View Solution
Knowledge Check
The modal class for the following frequency distribution, is
Marks:0−1010−2020−4040−5050−6060−7070−9090−100No. of students:461416148165A20-40B40-50C50-60D70-90
Compute D3 for the following distribution :
Marks0−1010−2020−3030−4040−5050−6060−7070−80No.of students3101776421
View SolutionObtain the mean , median and mode of the following data :
Marks0−1010−2020−3030−4040−5050−6060−7070−80Number of Students 5 7 15 25 20 15 8 5
View SolutionFind the mean for the following data.
Marks obtained10−2020−3030−4040−5050−6060−70Number of students8612527
View SolutionCaculate the median and mode from the following data :
Marks0−1010−2020−3030−4040−5050−6060−7070−80Number of Students 2 18 30 45 35 20 6 3
View SolutionIn the following frequency distribution, if the arithmetic mean is 45.6, find out missing frequency.
Wages(Rs.)10−2020−3030−4040−5050−6060−7070−80Number of Workers 5 6 7 X 4 3 9
View SolutionIn the following frequency distribution, if the arithmetic mean is 45.6, find out missing frequency.
Wages(Rs.)10−2020−3030−4040−5050−6060−7070−80Number of Workers 5 6 7 X 4 3 9
View SolutionThe following table gives the marks scored by 100 students in an entrance examination.

View Solution
