Revenue For The Company
Step by step video & image solution for Revenue For The Company by Social Science experts to help you in doubts & scoring excellent marks in Class 8 exams.
Updated on:21/07/2023Similar Questions
The given Bar Graph presents the Revenue and Expenditure (in crores of Rupees ) of a company during the five year period, 2014-2018.
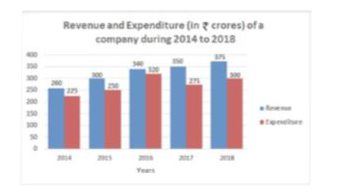
What is the ratio of the total revenue of the company in 2015 and 2018 to that of its expenditure in 2014 and 2018 ?
View SolutionThe line chart given below shows the revenue of a company (in lac rupees) from year 2009 to 2016.
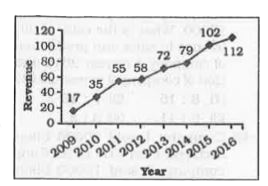
The averange revenue of the company from 2013 to 2016 is how much per cent more than the average revenue of the company from 2009 to 2012?
View Solution
Knowledge Check
The following pie chart shows information on sales of a toy making company 'XYZ' for 2017-18 financial year

The total revenue made by sales of the toys is Rs 38,72,000/-
Which type of toys made least revenue for the company?
(a)Musical toys
(b)Activity toys
(c)Learning blocks
(d)Soft toysAMusical toysBActivity toysCLearning blocksDSoft toysThe following pie diagrams shows the revenue of the company ABC, which manufactures the leather products. The total revenue of the company for the year 2015 Was Rs. 36,28,000.
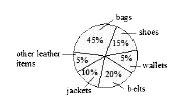
How much revenue was made on the sales of wallets & belts ?ARs. 9,07,000BRs. 1,81,400CRs. 90,700DRs. 1,814,000The line chart given below shows the revenue of a company (in lac rupees) from year 2009 to 2016
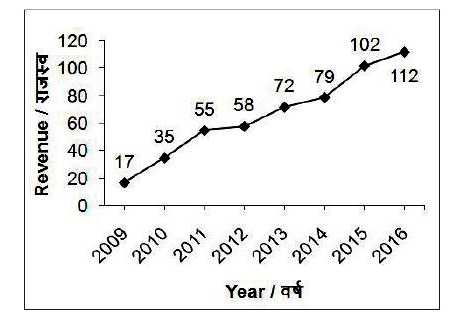
The average revenue of the company from 2013 to 2016 is how much percent more than the average revenue of the company from 2009 to 2012?A181.2B21.2C121.2D221.2
The given bar graph presents the Revenue and Expenditure of a company during the five year period 2014-2018
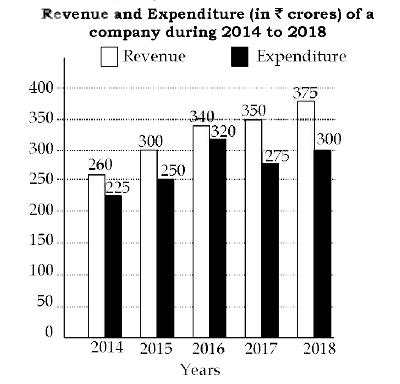
What is the ratio of the total revenue of the company in 2015 and 2018 to that of its expenditure in 2014 and 2018.
View SolutionA rectangular plot is 180m^2 in area. If its length is 18m, then its perimeter is?
View SolutionThe number of years I which the revenue of the company from the sale of product D is more than the average revenue from the sale of product A over six years, is:
View SolutionThe following pie diagram shows the revenue of the company ABC, which manufactures the leather products . The total revnue of the company for the year 2015 was Rs. 3,628,000
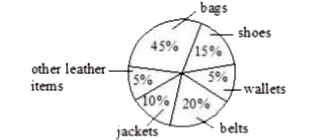
How much revenue was made with the sale of bags & shoes in 2015 ?
View SolutionThe bar graph shows the monthly profits of the different departments of a company. Study the diagram and answer the following questions.
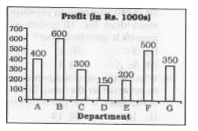
If the company has only departments then what is the monthly revenue (in Rs. Lakhs) of the company if the monthly profit was 20% of the total monthly revenue of the company?
View Solution
