What is a pie chart ?
Step by step video & image solution for What is a pie chart ? by Maths experts to help you in doubts & scoring excellent marks in Class 7 exams.
Updated on:21/07/2023Topper's Solved these Questions
- STATISTICSBook:PEARSON IIT JEE FOUNDATIONChapter:STATISTICSExercise:Essay Type
Explore 6 Videos
- STATISTICSBook:PEARSON IIT JEE FOUNDATIONChapter:STATISTICSExercise:CONCEPT APPLICATION Level - 1
Explore 14 Videos
- STATISTICSBook:PEARSON IIT JEE FOUNDATIONChapter:STATISTICSExercise:Very Short Answer Type
Explore 37 Videos
- SIMPLE INTEREST AND COMPOUND INTEREST Book:PEARSON IIT JEE FOUNDATIONChapter:SIMPLE INTEREST AND COMPOUND INTEREST Exercise:Level 3
Explore 9 Videos
Similar Questions
Knowledge Check
This is a pie-chart for the data on A, B, O, AB blood groups of 150 donors. Observe the pie-chart and answer the questions.
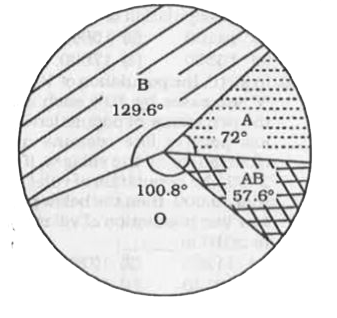
What is the percentage of donors having blood group 'AB'?A61%B26%C16%D36%The teacher user charts as tools to generate interest in students. Which of the data sets could be plotted on a pie chart?
AThe total population of the top five largest U.S. citiesBThe incubation period of a penguin colony as it re-later to hours of daylight.CThe distribution of weight among players of a football team.DThe percent of vegetation cover and precipitation rates in different national parks.The numbers of Science, Arts and Commerce graduates working in a company are 30, 70 and 50 respectively. If these 'figures are represented by a pie chart, then what by a pie chart, then what is the angle corresponding to Science graduates ?
A36∘B72∘C120∘D168∘
Directions: The given pie-charts compares the total population and the female population of six countries, Australia, Canada, Germany, India, USA and Philippines. The first pie chart gives the percentage distribution of the total population of the six countries, while, the second pie chart gives the percentage distribution of the female population of the six countries. Study the pie-charts and answer the questions that follow.
If the total number of females in India and USA is equal to the total population of the Philippines, then what is the ratio of the number of males in Australia to the number of females in Canada?
View SolutionIf red part in the following pie chart in 40, what is white part ?
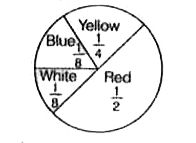
View SolutionStudy the chart and answer the question based, on the pie chart.
The pie chart given below shows expenditures incurred by a family on various items and savings in a month. Savings of the family is ₹ 8,000 in a month.
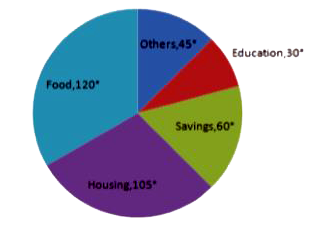 The ratio of the expenditure on food to the saving is :
View SolutionStudy the chart and answer the question based, on the pie chart.
The pie chart given below shows expenditures incurred by a family on various items and savings in a
month. Savings of the family is ₹ 8,000 in a month.
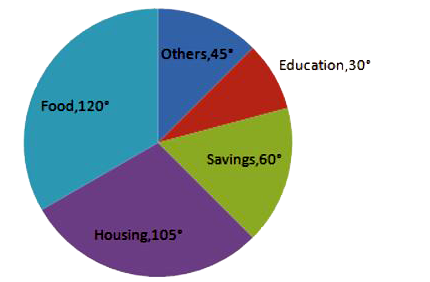
What is the total expenditure of the family for the month ?
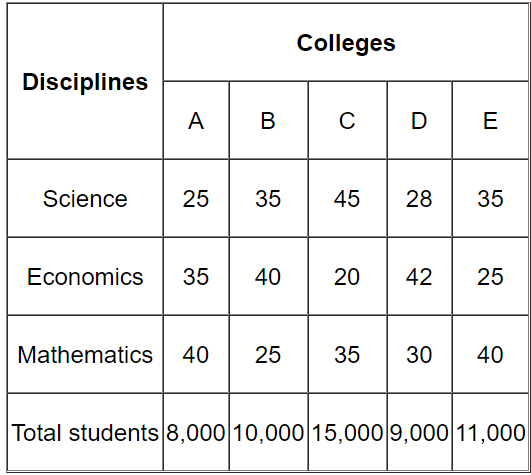
View SolutionIF the data of the total students college wise, is represented by a pie chart, what is the central angle of the sector representing college E.
View Solution
