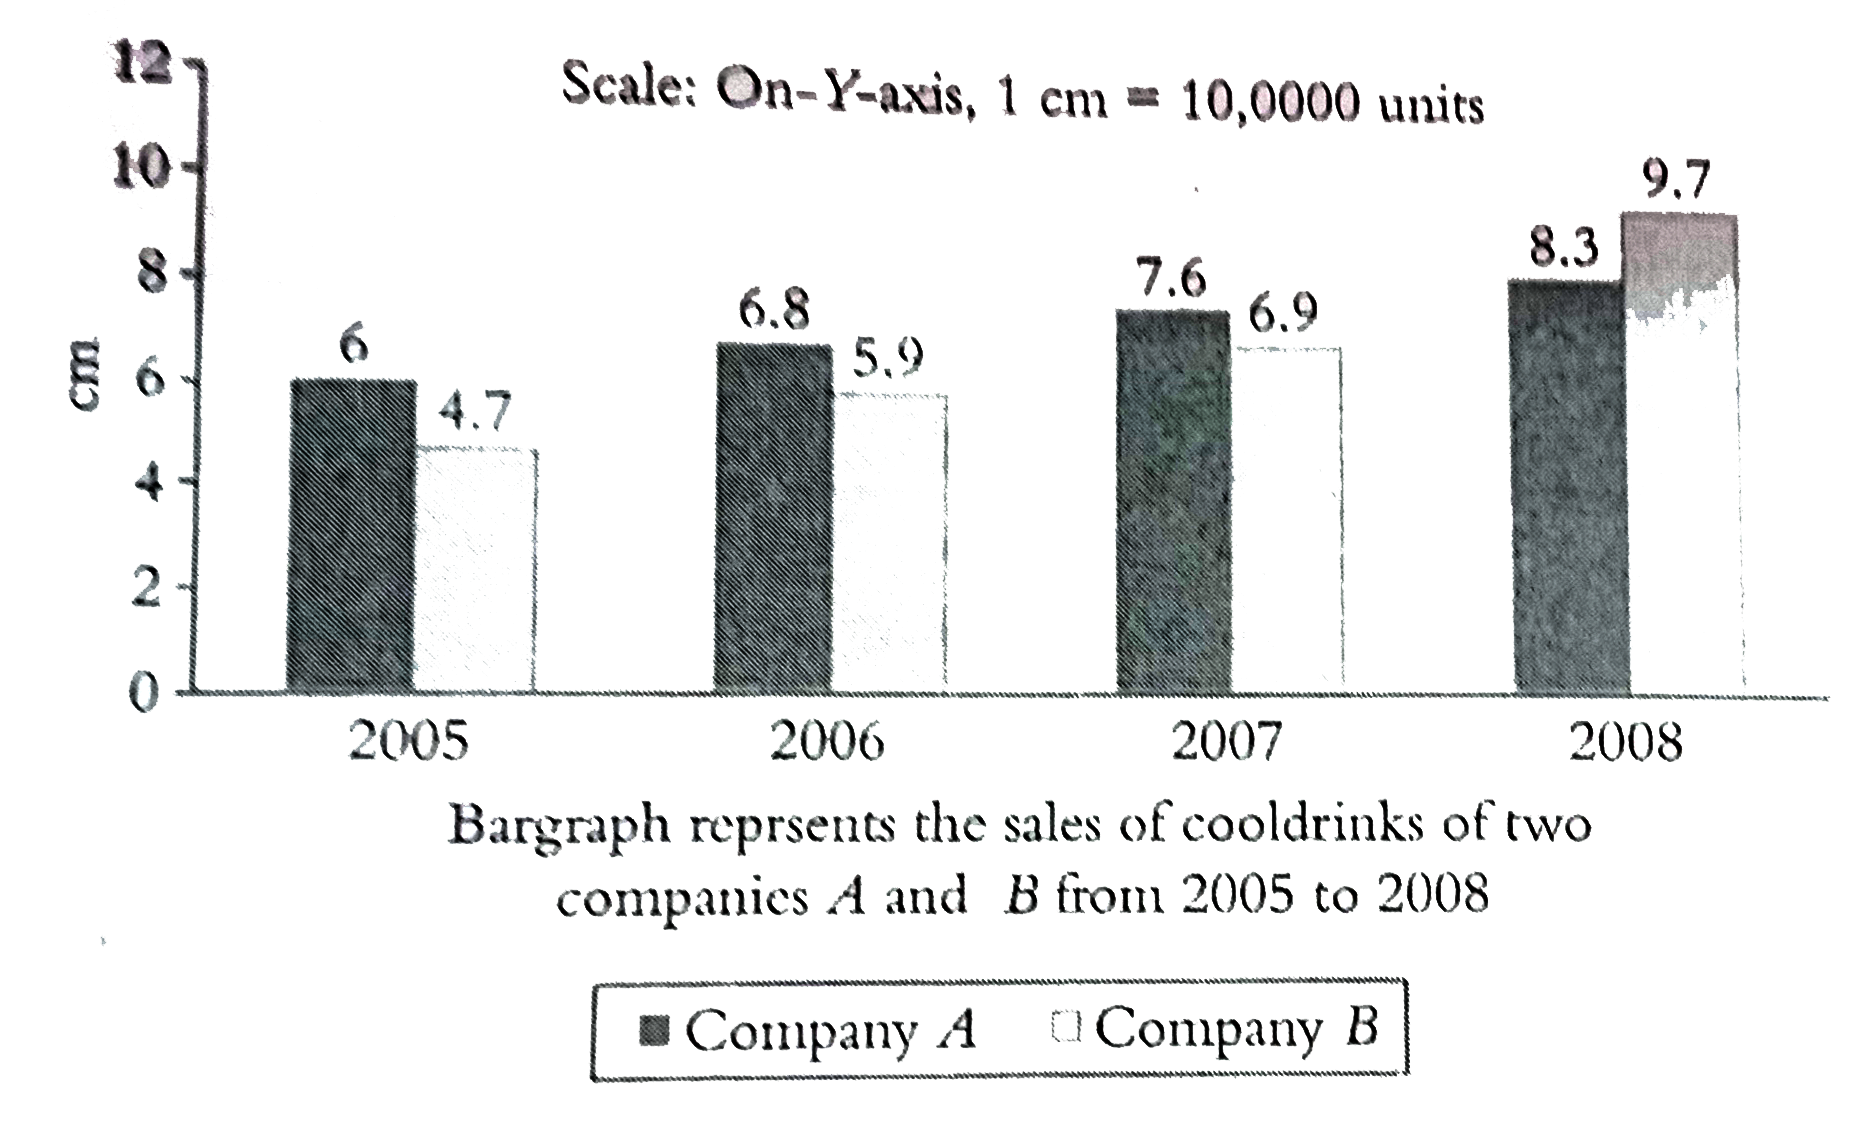
In which year is the sales of B more than the sales of A ?
2005
2006
2007
2008
The correct Answer is:D
Clearly, in the year 2008, the sales of cool drinks of company B is more than that of sales of cool drinks of company A.
Hence, the correct option is (d).
Topper's Solved these Questions
- STATISTICSBOOK - PEARSON IIT JEE FOUNDATIONCHAPTER - STATISTICSEXERCISE - Level 2
22 Videos
- STATISTICSBOOK - PEARSON IIT JEE FOUNDATIONCHAPTER - STATISTICSEXERCISE - Level 3
11 Videos
- STATISTICSBOOK - PEARSON IIT JEE FOUNDATIONCHAPTER - STATISTICSEXERCISE - Essay Type
6 Videos
- SIMPLE INTEREST AND COMPOUND INTEREST BOOK - PEARSON IIT JEE FOUNDATIONCHAPTER - SIMPLE INTEREST AND COMPOUND INTEREST EXERCISE - Level 3
9 Videos
Similar Questions
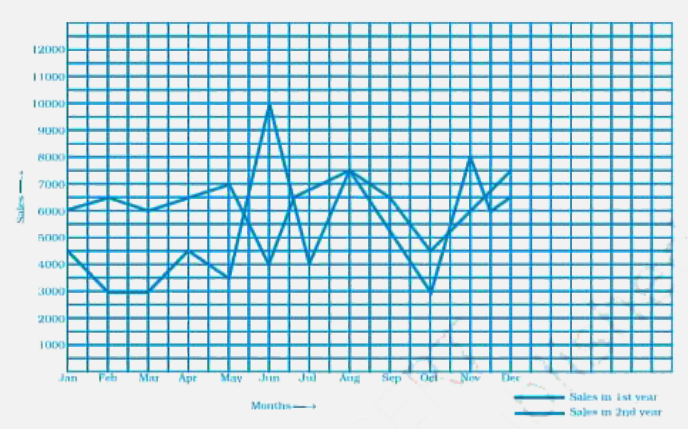
Following graph shows a comparison of the approximate sale of items manufactured by a company for the first two years of its operation.
(a) In which months there was maximum difference in the sale of items of two years?
(b) In which year was there more stability in the sale of items ?
(c) In which month the sale remains the same in both the years ?
(d) In which month was the sales of first year less than that of second year?
View SolutionThe line graph shows the Sales per employee of a certain company. Study the diagram and answer the following questions.
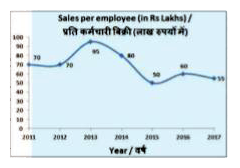
In which year were the Sales per employee greater than that of the previous year?
View Solution
Knowledge Check
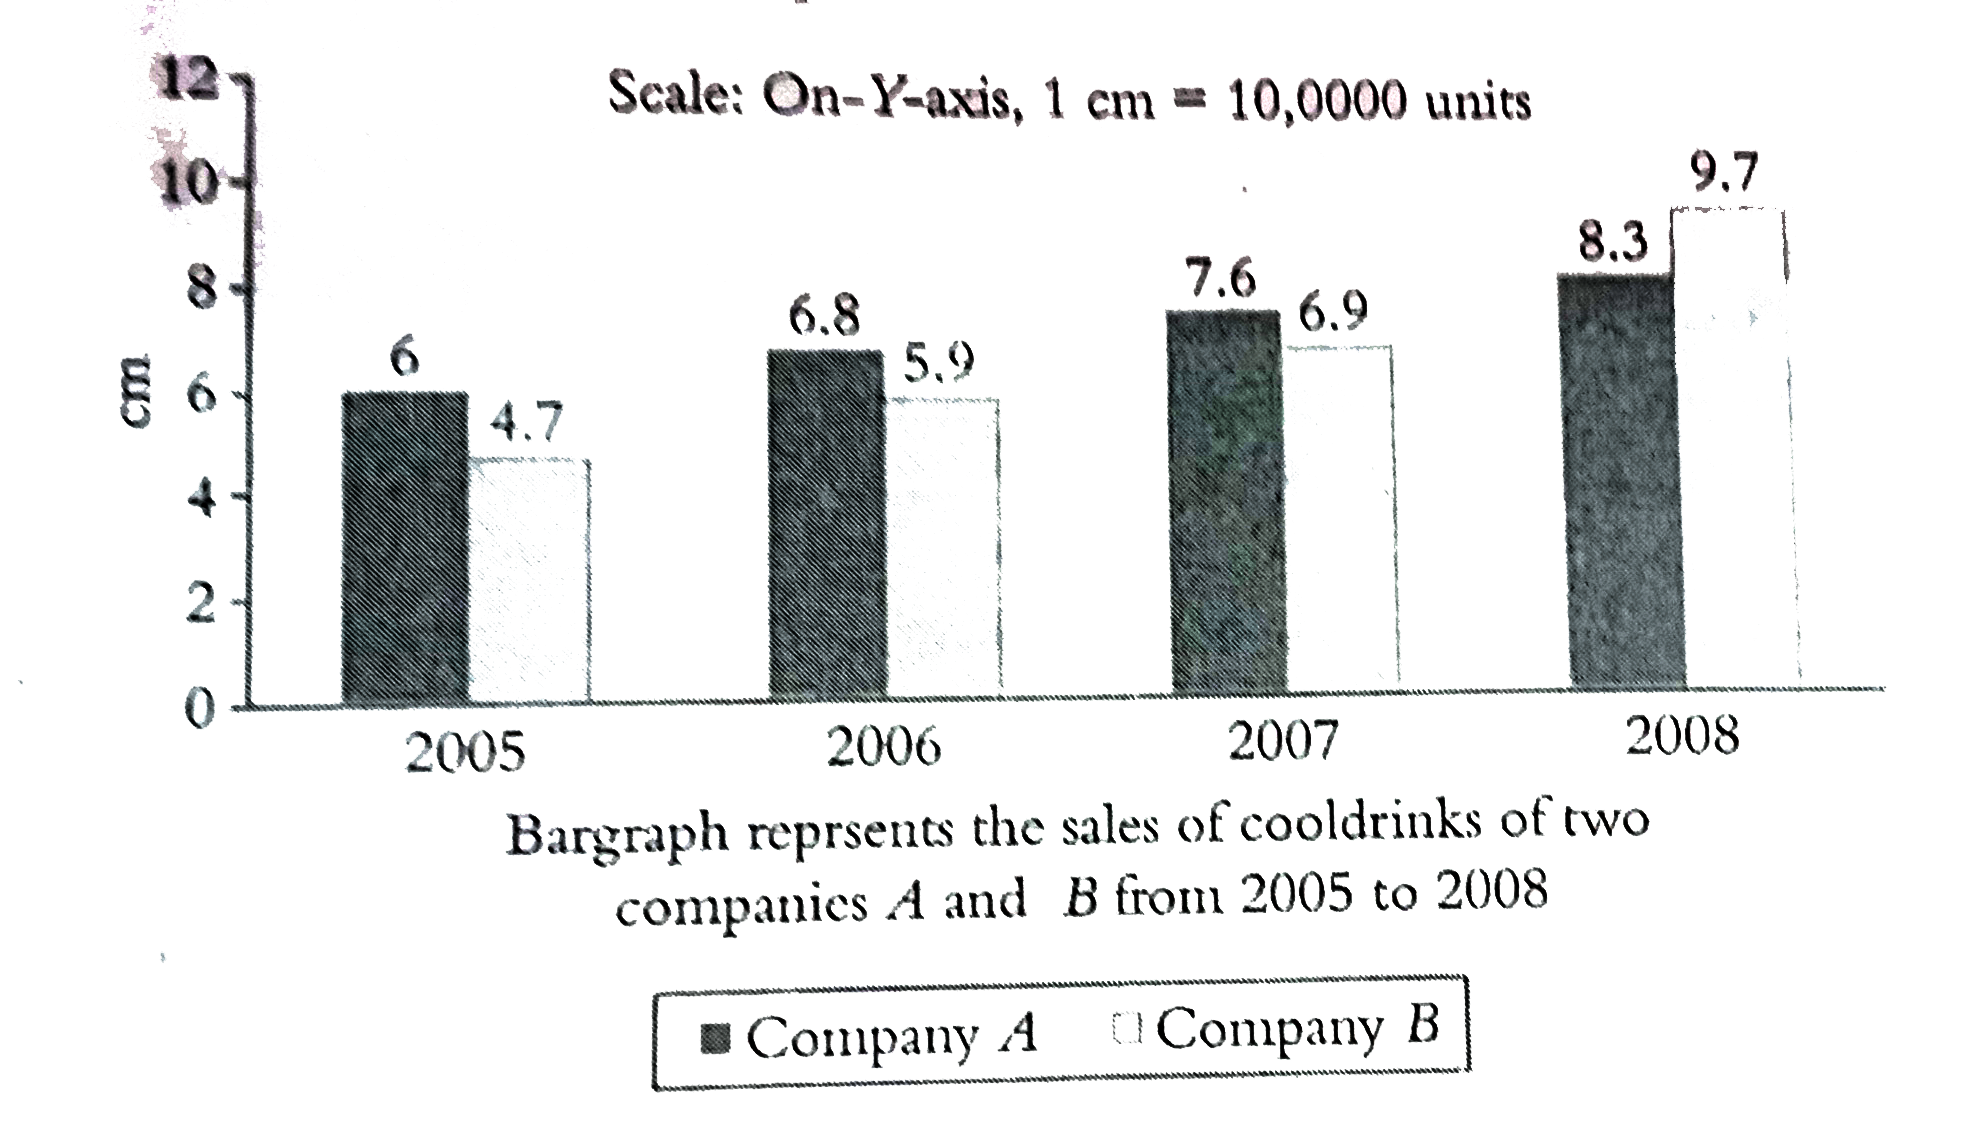
In which year is the difference between the sales of A and the sales of B the highest ?A2008B2005C2006D2007The line chart given below shows the sales (in crores) of company A and B from July to December.
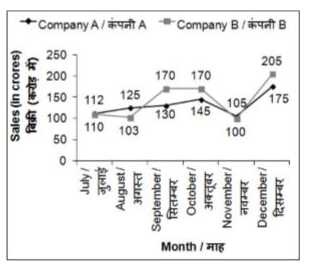
For how many months the sales of company B is more than the sales of company A?Aa)2Bb)3Cc)1Dd)4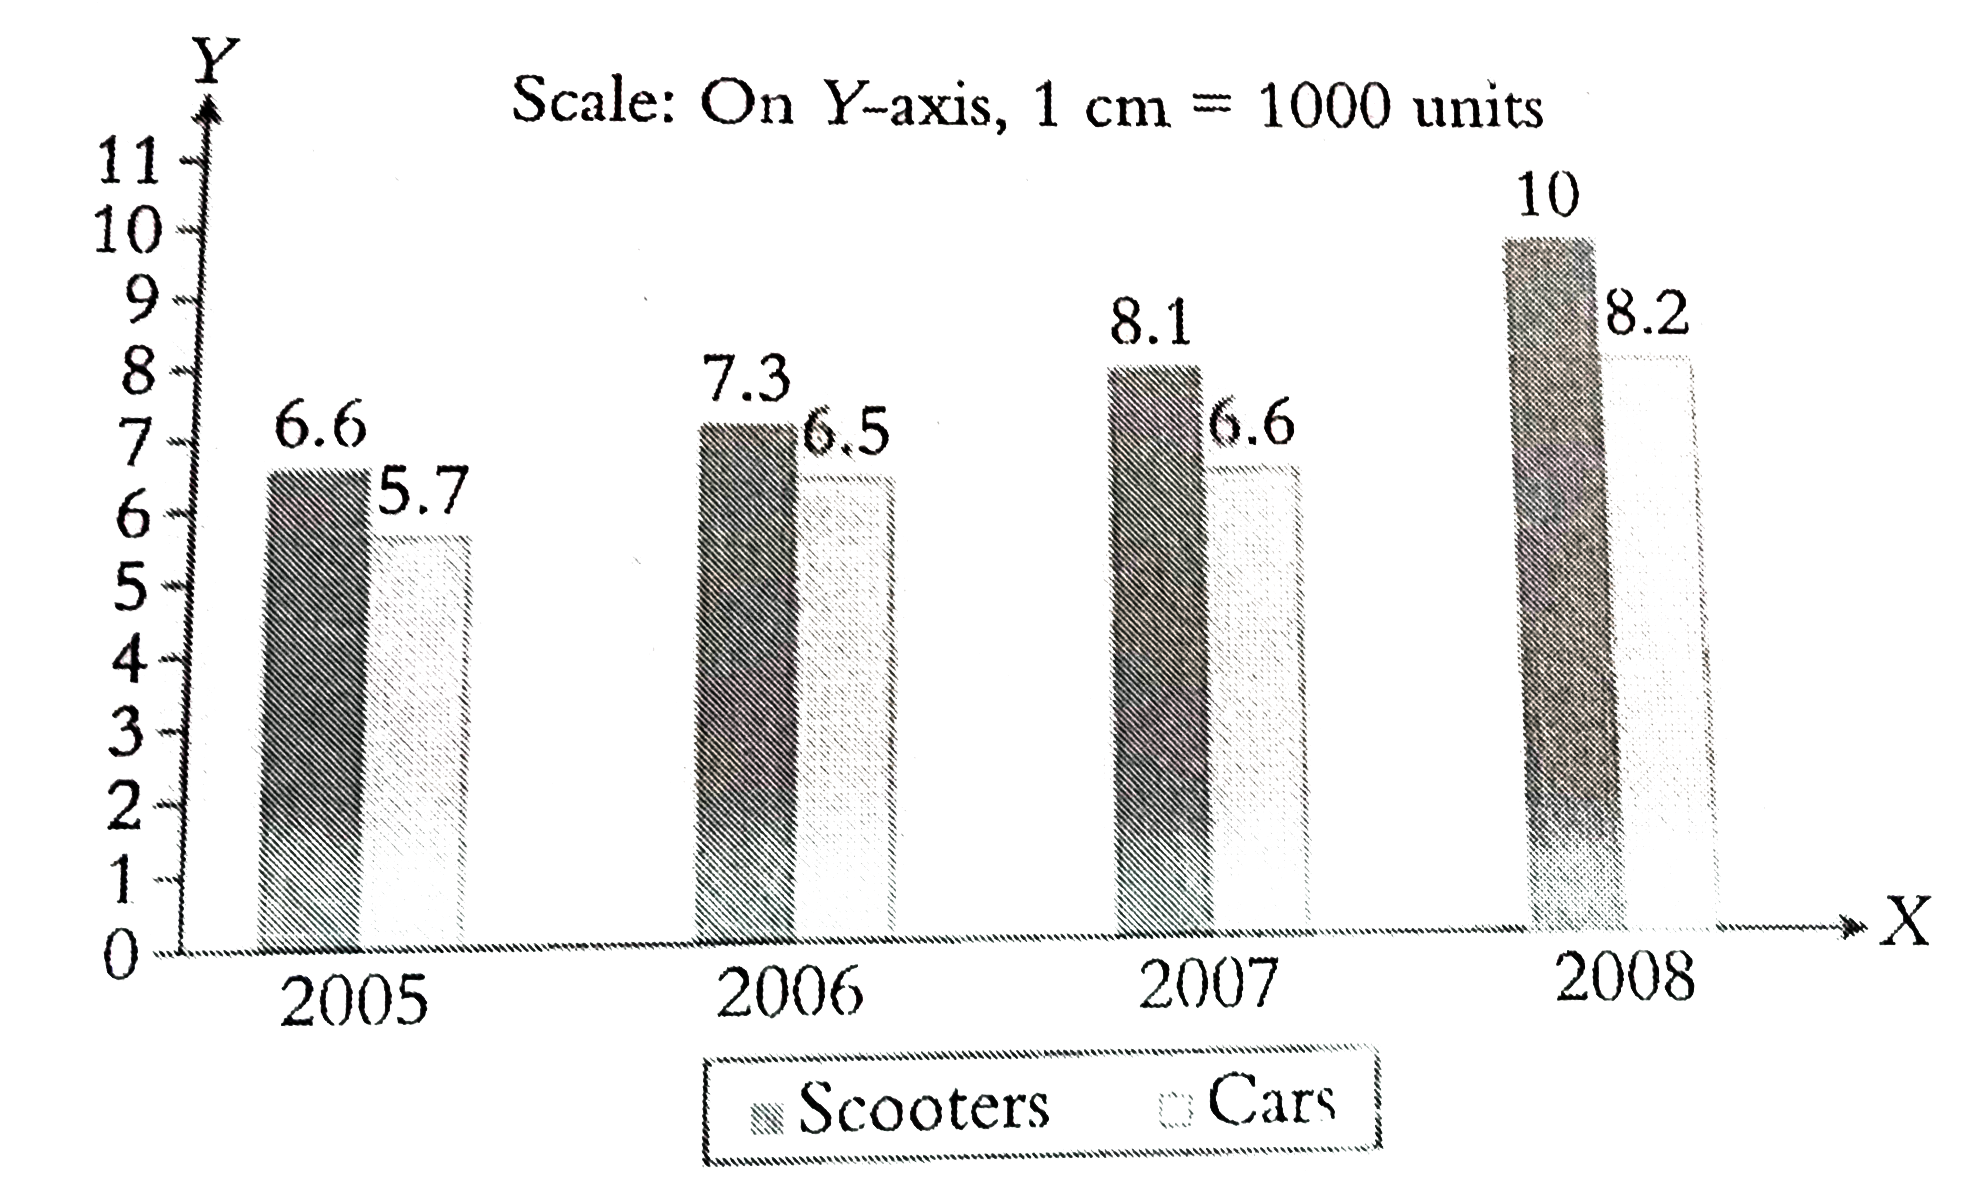
In which year is the difference between the sales of the scooters and the sales of cars the least ?A2005B2006C2007D2008
The line chart given below shows the sales (in crores) of a complany for the years 2009 to 2016
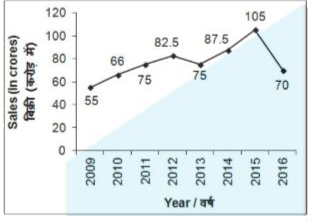
In how many years was the sale of the company more than the sale in 2011?
View SolutionThe bar chart given below shows the sales (in '000 units) of 4 mobile brands for 3 years.
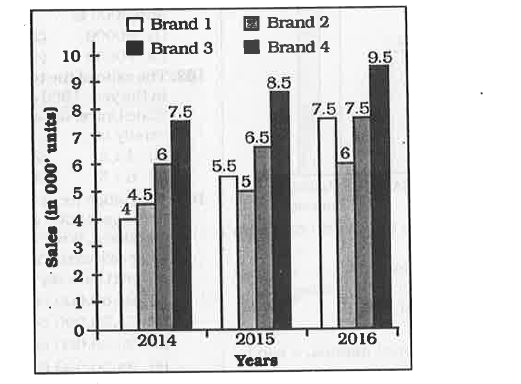
If for anby year, the sales of a brand is more than average sales of these four brands in that year, then it gets a star. Which brand has the maximum stars?
View SolutionThe bar chart given below shows the sales (in '000 units) of 4 mobile brands for 3 years.
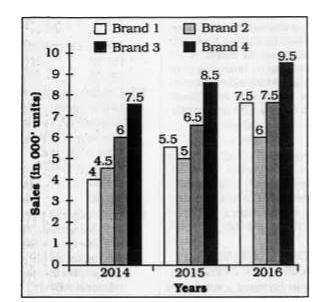
If for any year, the scales of a brand is more than average sales of these four brands in that year, then it gets a star. Which brand has the maximum stars?
View SolutionThe bar chart given below shows the sales (in lacs) of 2 companies X and Y from year 2011 to 2016
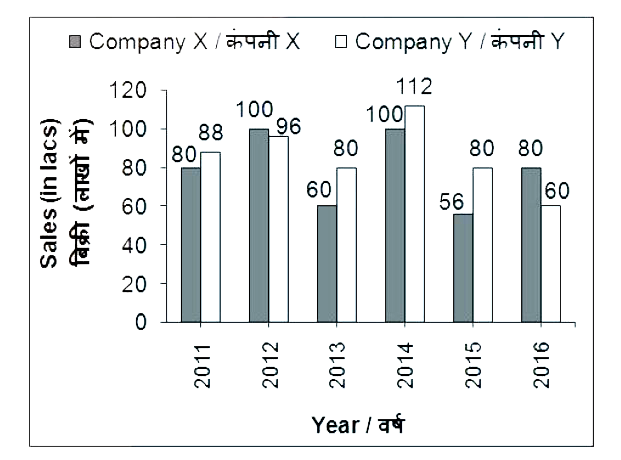
n how many years was the sale of company X more than that of company Y?
View SolutionThe following graph gives Sales, Expenses and Capital of a company for a period of five years 1994 to 1998. Read the graph and answer the following questions.
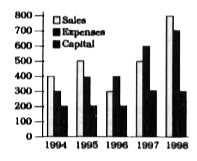
In which year was the Sales to Expense ratio the lowest?
View Solution
