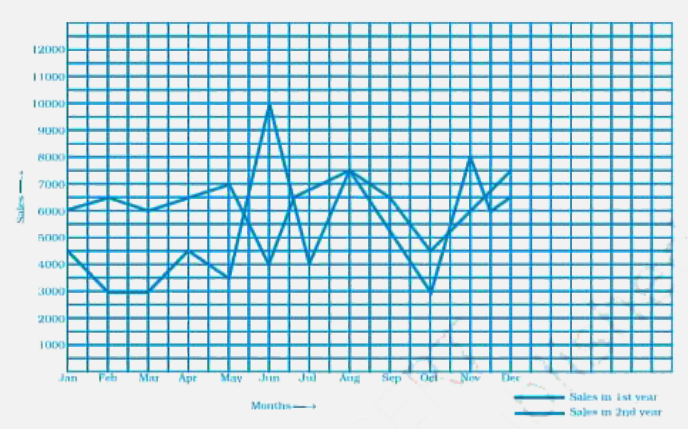
Following graph shows a comparison of the approximate sale of items manufactured by a company for the first two years of its operation.
(a) In which months there was maximum difference in the sale of items of two years?
(b) In which year was there more stability in the sale of items ?
(c) In which month the sale remains the same in both the years ?
(d) In which month was the sales of first year less than that of second year?
Step by step video & image solution for Following graph shows a comparison of the approximate sale of items manufactured by a company for the first two years of its operation. (a) In which months there was maximum difference in the sale of items of two years? (b) In which year was there more stability in the sale of items ? (c) In which month the sale remains the same in both the years ? (d) In which month was the sales of first year less than that of second year? by Maths experts to help you in doubts & scoring excellent marks in Class 8 exams.
Updated on:21/07/2023Topper's Solved these Questions
- INTRODUCTION TO GRAPHS BOOK - NCERT EXEMPLARCHAPTER - INTRODUCTION TO GRAPHS EXERCISE - THINK AND DISCUSS
4 Videos
- INTRODUCTION TO GRAPHS BOOK - NCERT EXEMPLARCHAPTER - INTRODUCTION TO GRAPHS EXERCISE - EXERCISE
86 Videos
- EXPONENTS AND POWERSBOOK - NCERT EXEMPLARCHAPTER - EXPONENTS AND POWERSEXERCISE - EXERCISE
195 Videos
- LINEAR EQUATIONS IN ONE VARIABLEBOOK - NCERT EXEMPLARCHAPTER - LINEAR EQUATIONS IN ONE VARIABLEEXERCISE - THINK AND DISCUSS
3 Videos
Similar Questions
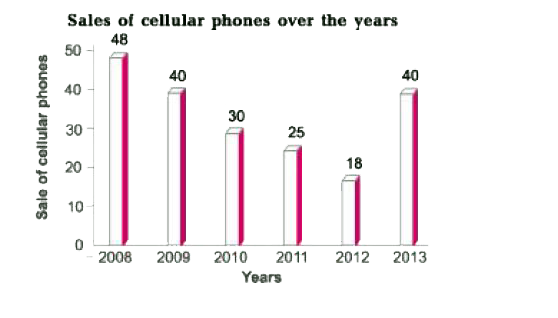
Find the two years in which the sale of cellular phones is minimum.
View SolutionThe given Bar Graph present the sales of the number of books (in thousands) by six branches of a publishing company during two consecutive years 2000 and 2001.
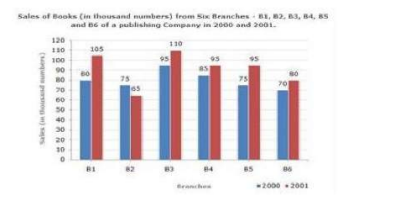 The total sales (in thousands) by all branches for both years is:
View Solution
Knowledge Check
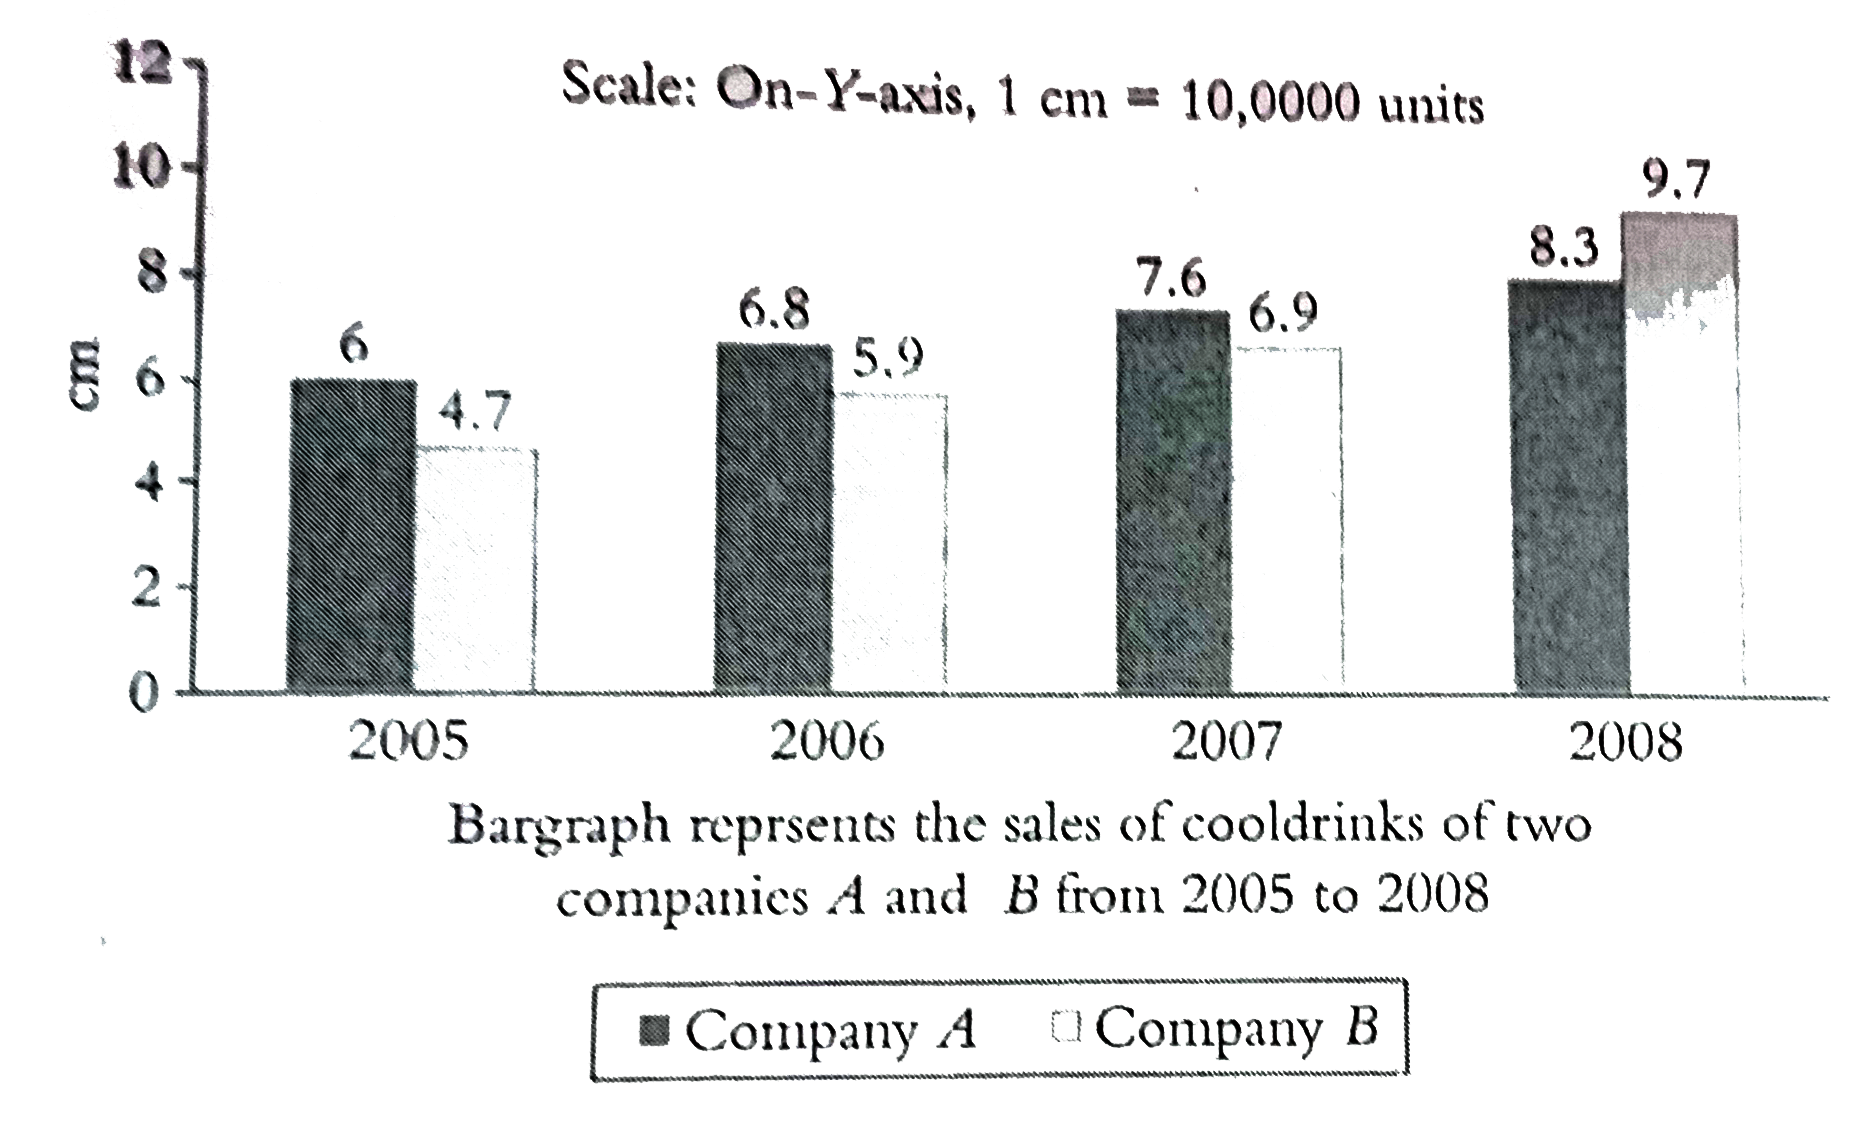
In which year is the sales of B more than the sales of A ?A2005B2006C2007D2008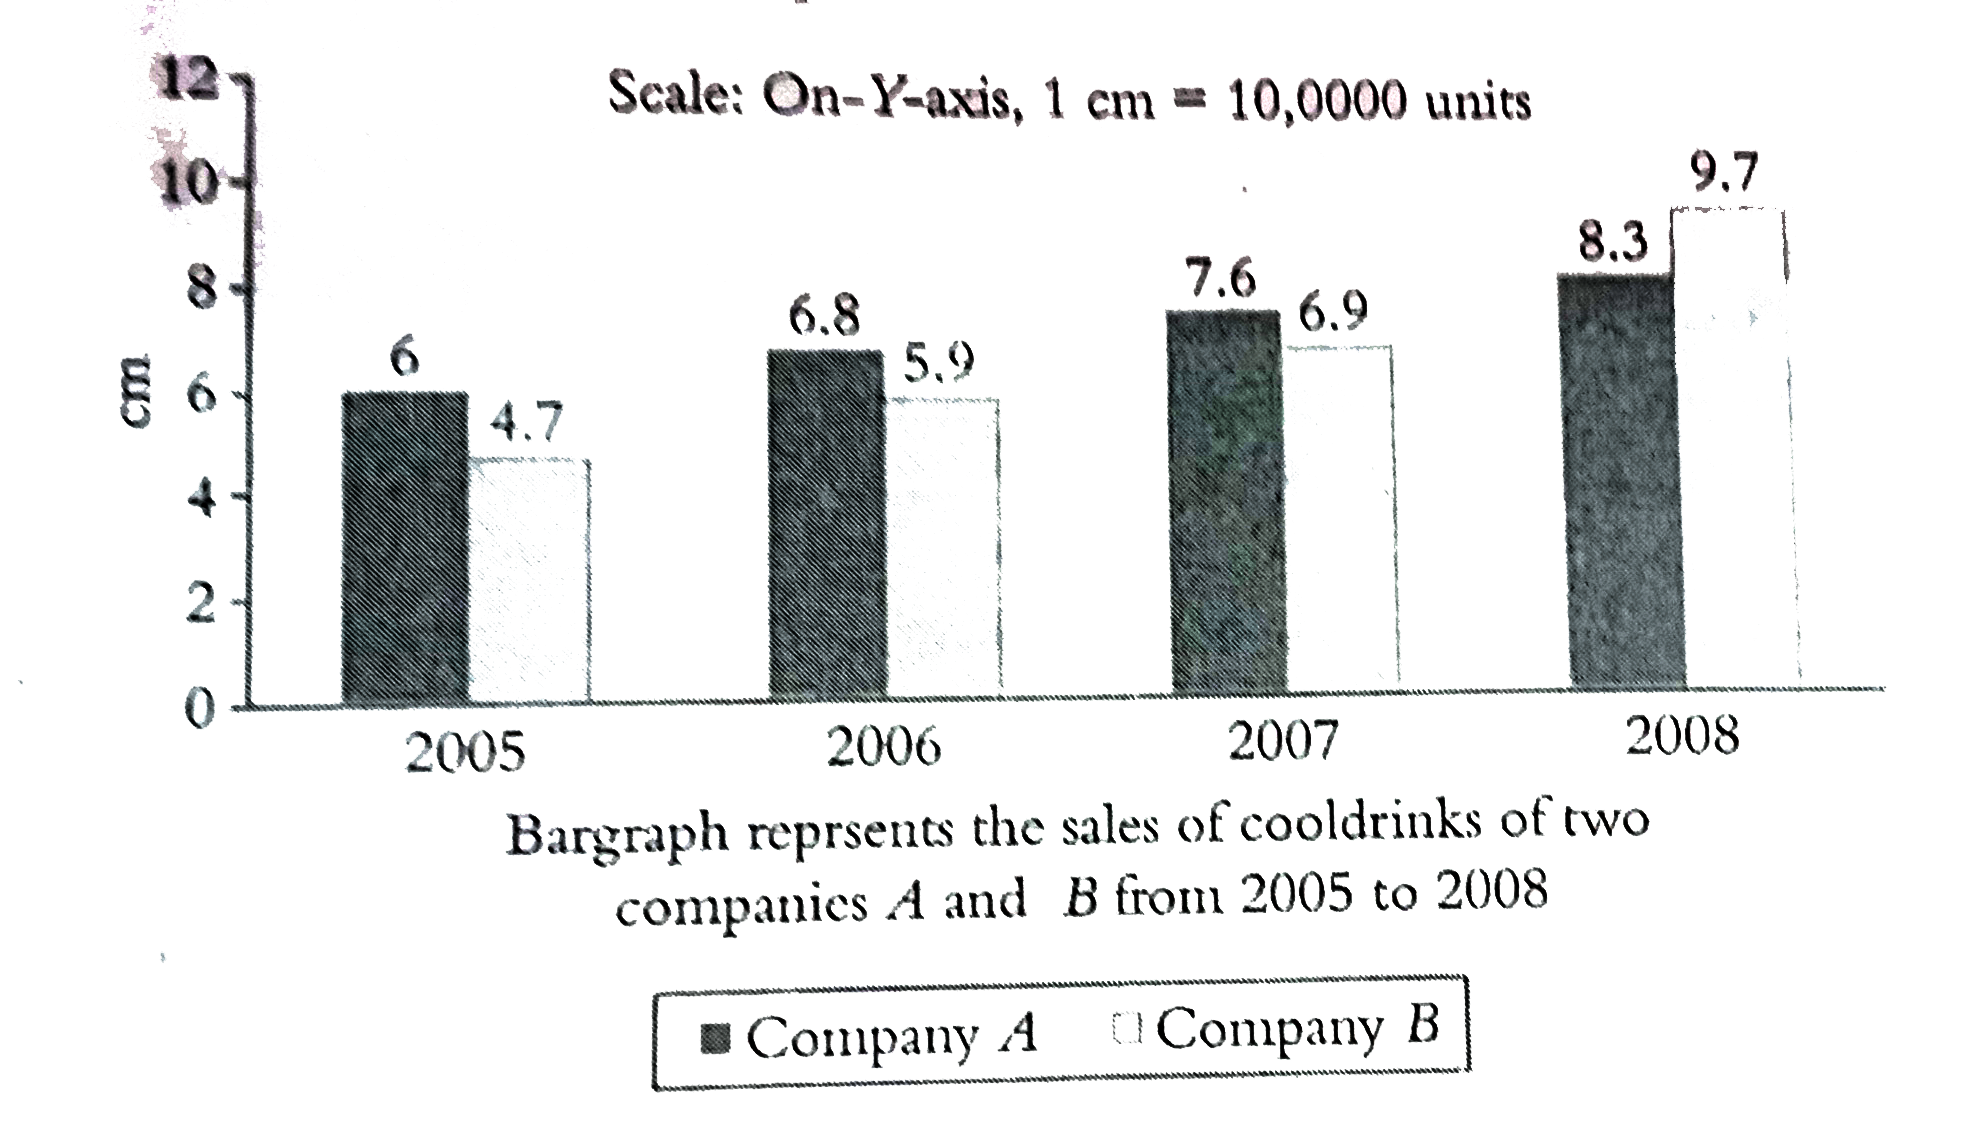
In which year is the difference between the sales of A and the sales of B the highest ?A2008B2005C2006D2007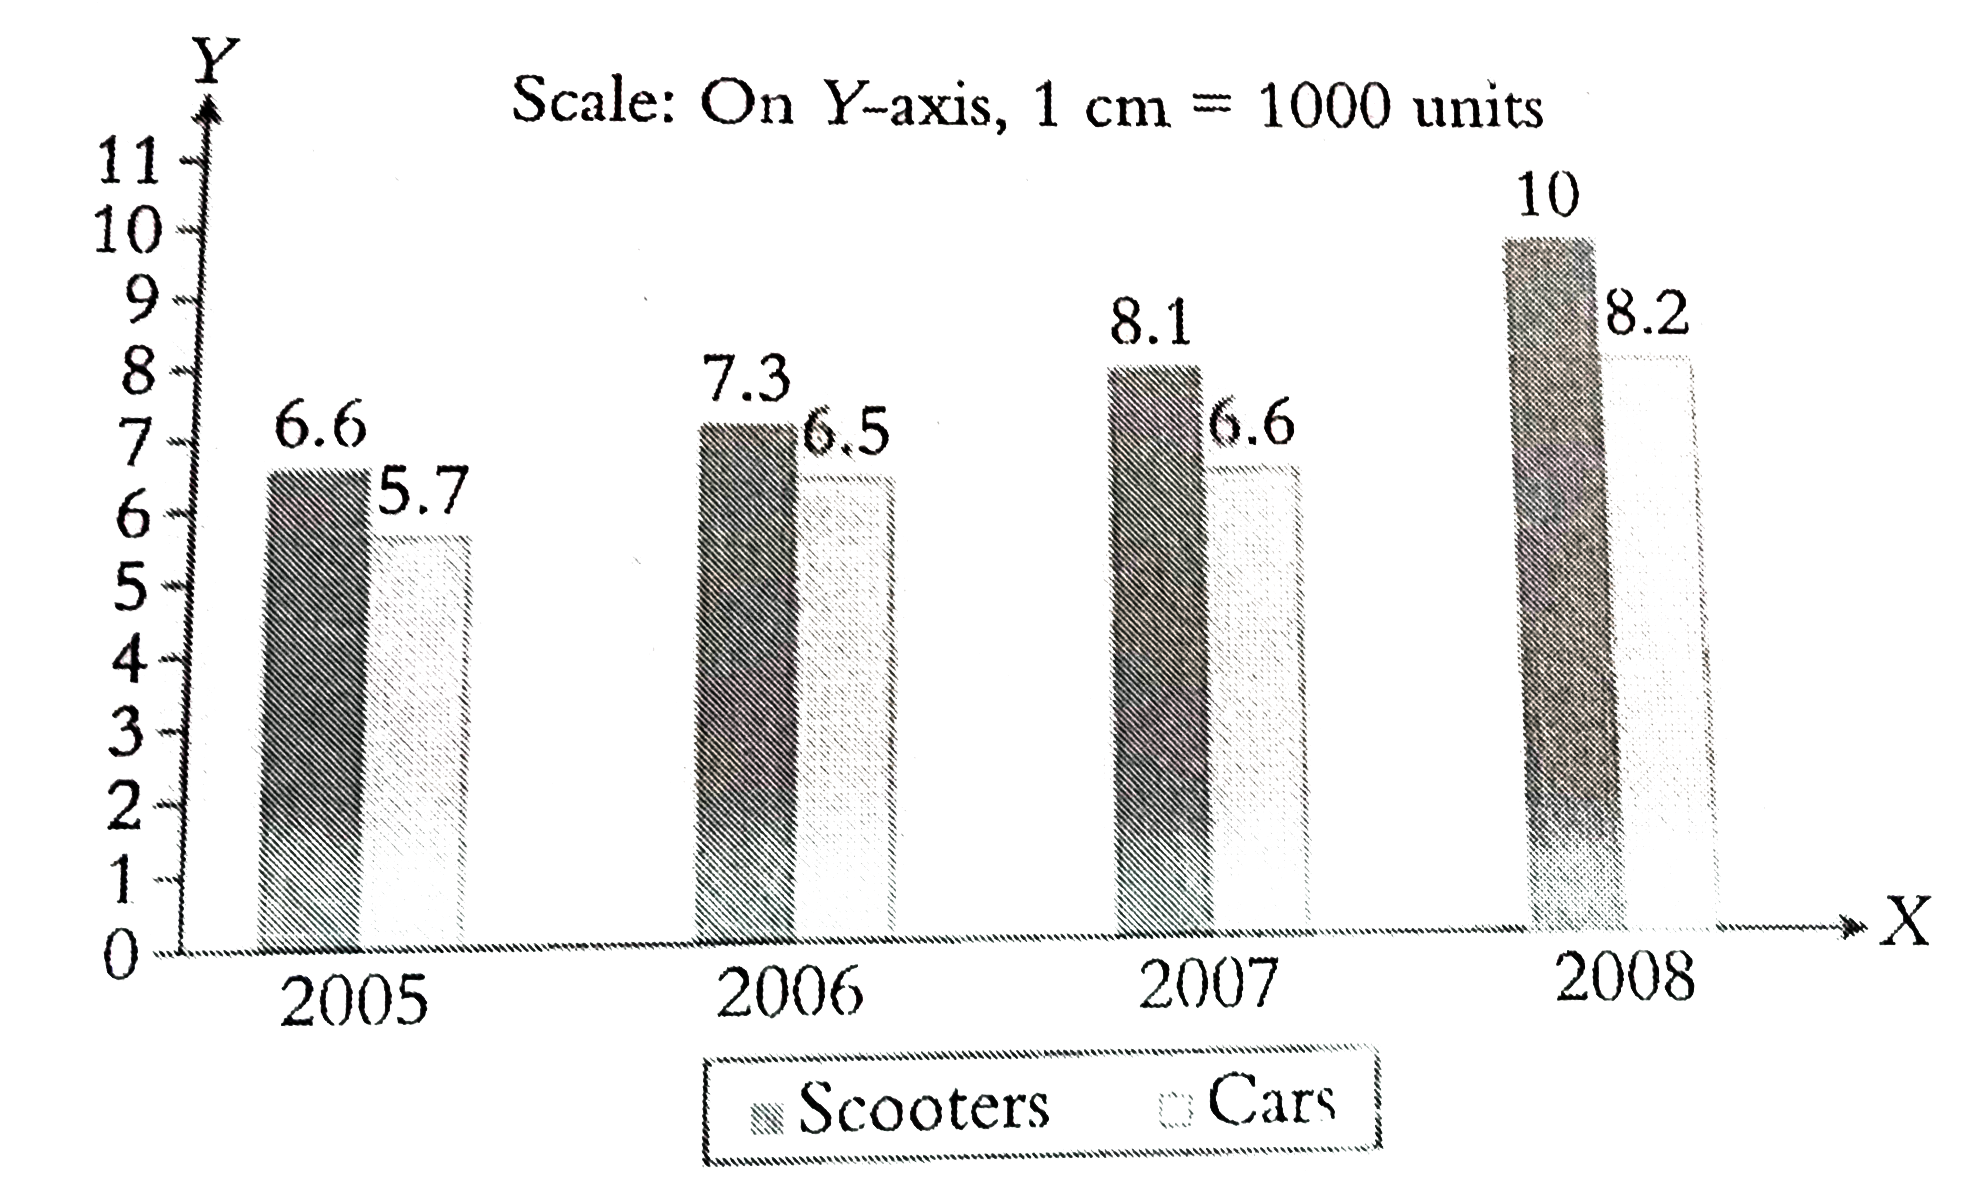
In which year is the difference between the sales of the scooters and the sales of cars the least ?A2005B2006C2007D2008
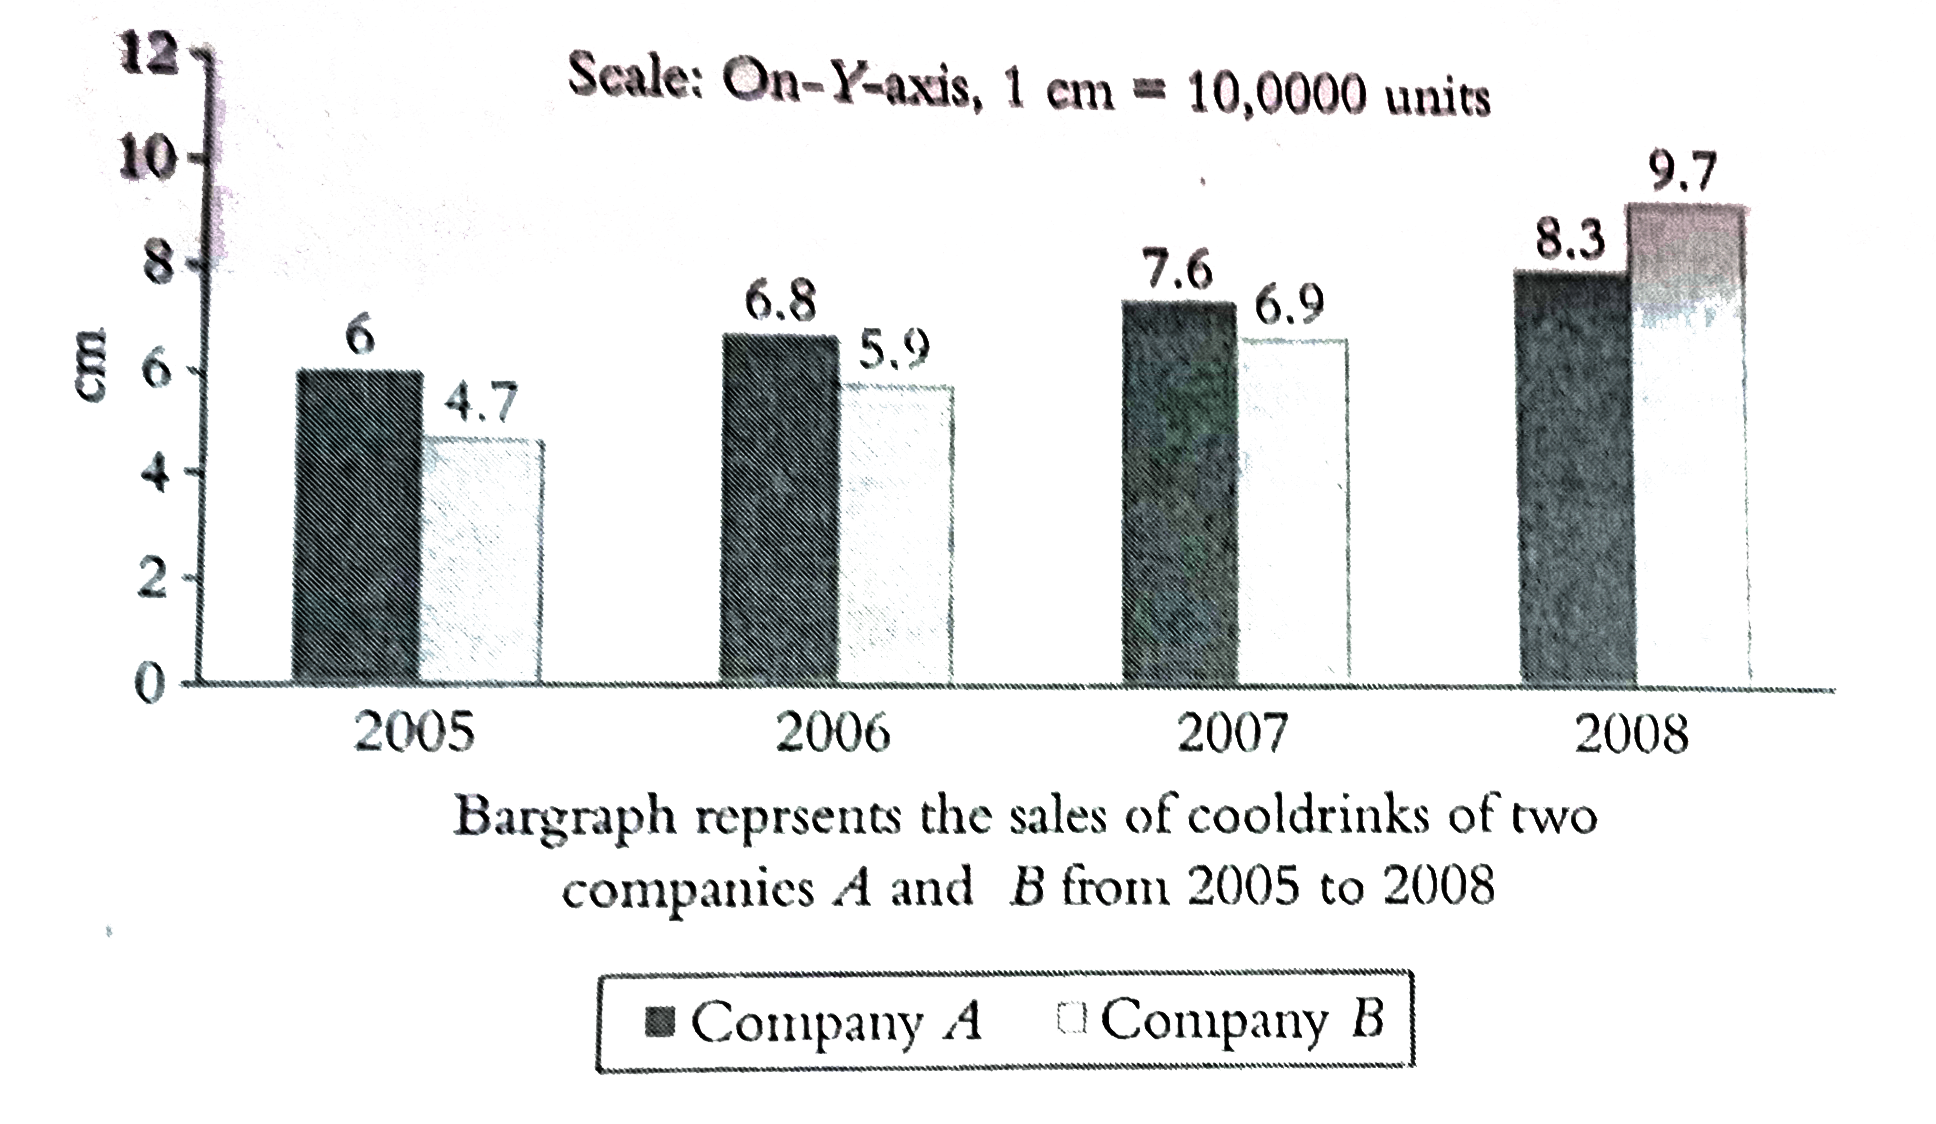
Find the minimum difference between the sales of A and sales of B in any year in the given period.
View SolutionFind out the total sales (in thousand) of company C1, C3 and C5 together in two years?
View SolutionThe line chart given below shows the sales (in crores) of a complany for the years 2009 to 2016
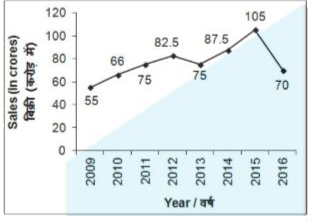
In how many years was the sale of the company more than the sale in 2011?
View SolutionThe number of years I which the revenue of the company from the sale of product D is more than the average revenue from the sale of product A over six years, is:
View Solution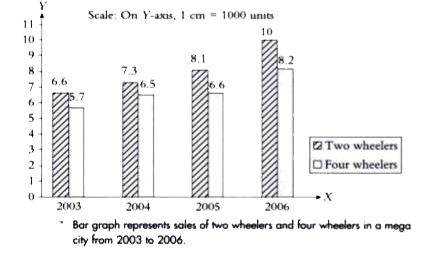
In which year the difference between sales of two wheelers and four wheelers is less?
View Solution
