Let f and g are the functions whose graphs are shown
Step by step video & image solution for Let f and g are the functions whose graphs are shown by Maths experts to help you in doubts & scoring excellent marks in Class 12 exams.
Updated on:21/07/2023Similar Questions
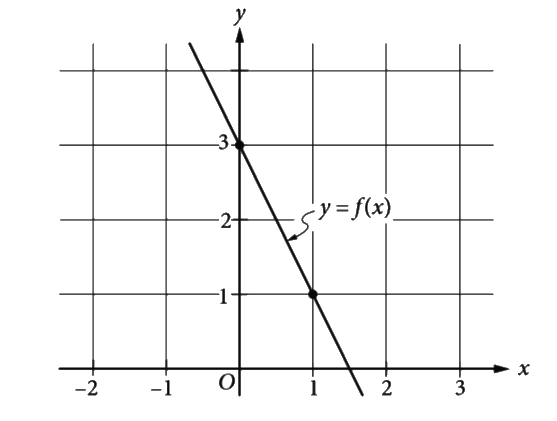
The graph of the linear function f is shown in the xy-plane above. The graph of the linear function g (not shown) is perpendicular to the graph of f and passes through the point (1,3). What is the value of g(0) ?
View SolutionThe graph of function f(x) is shown below :
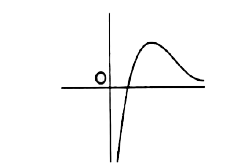
Then the graph of g(x)=1f(|x|) is:
View SolutionConsider the following function f whose graph is given below.
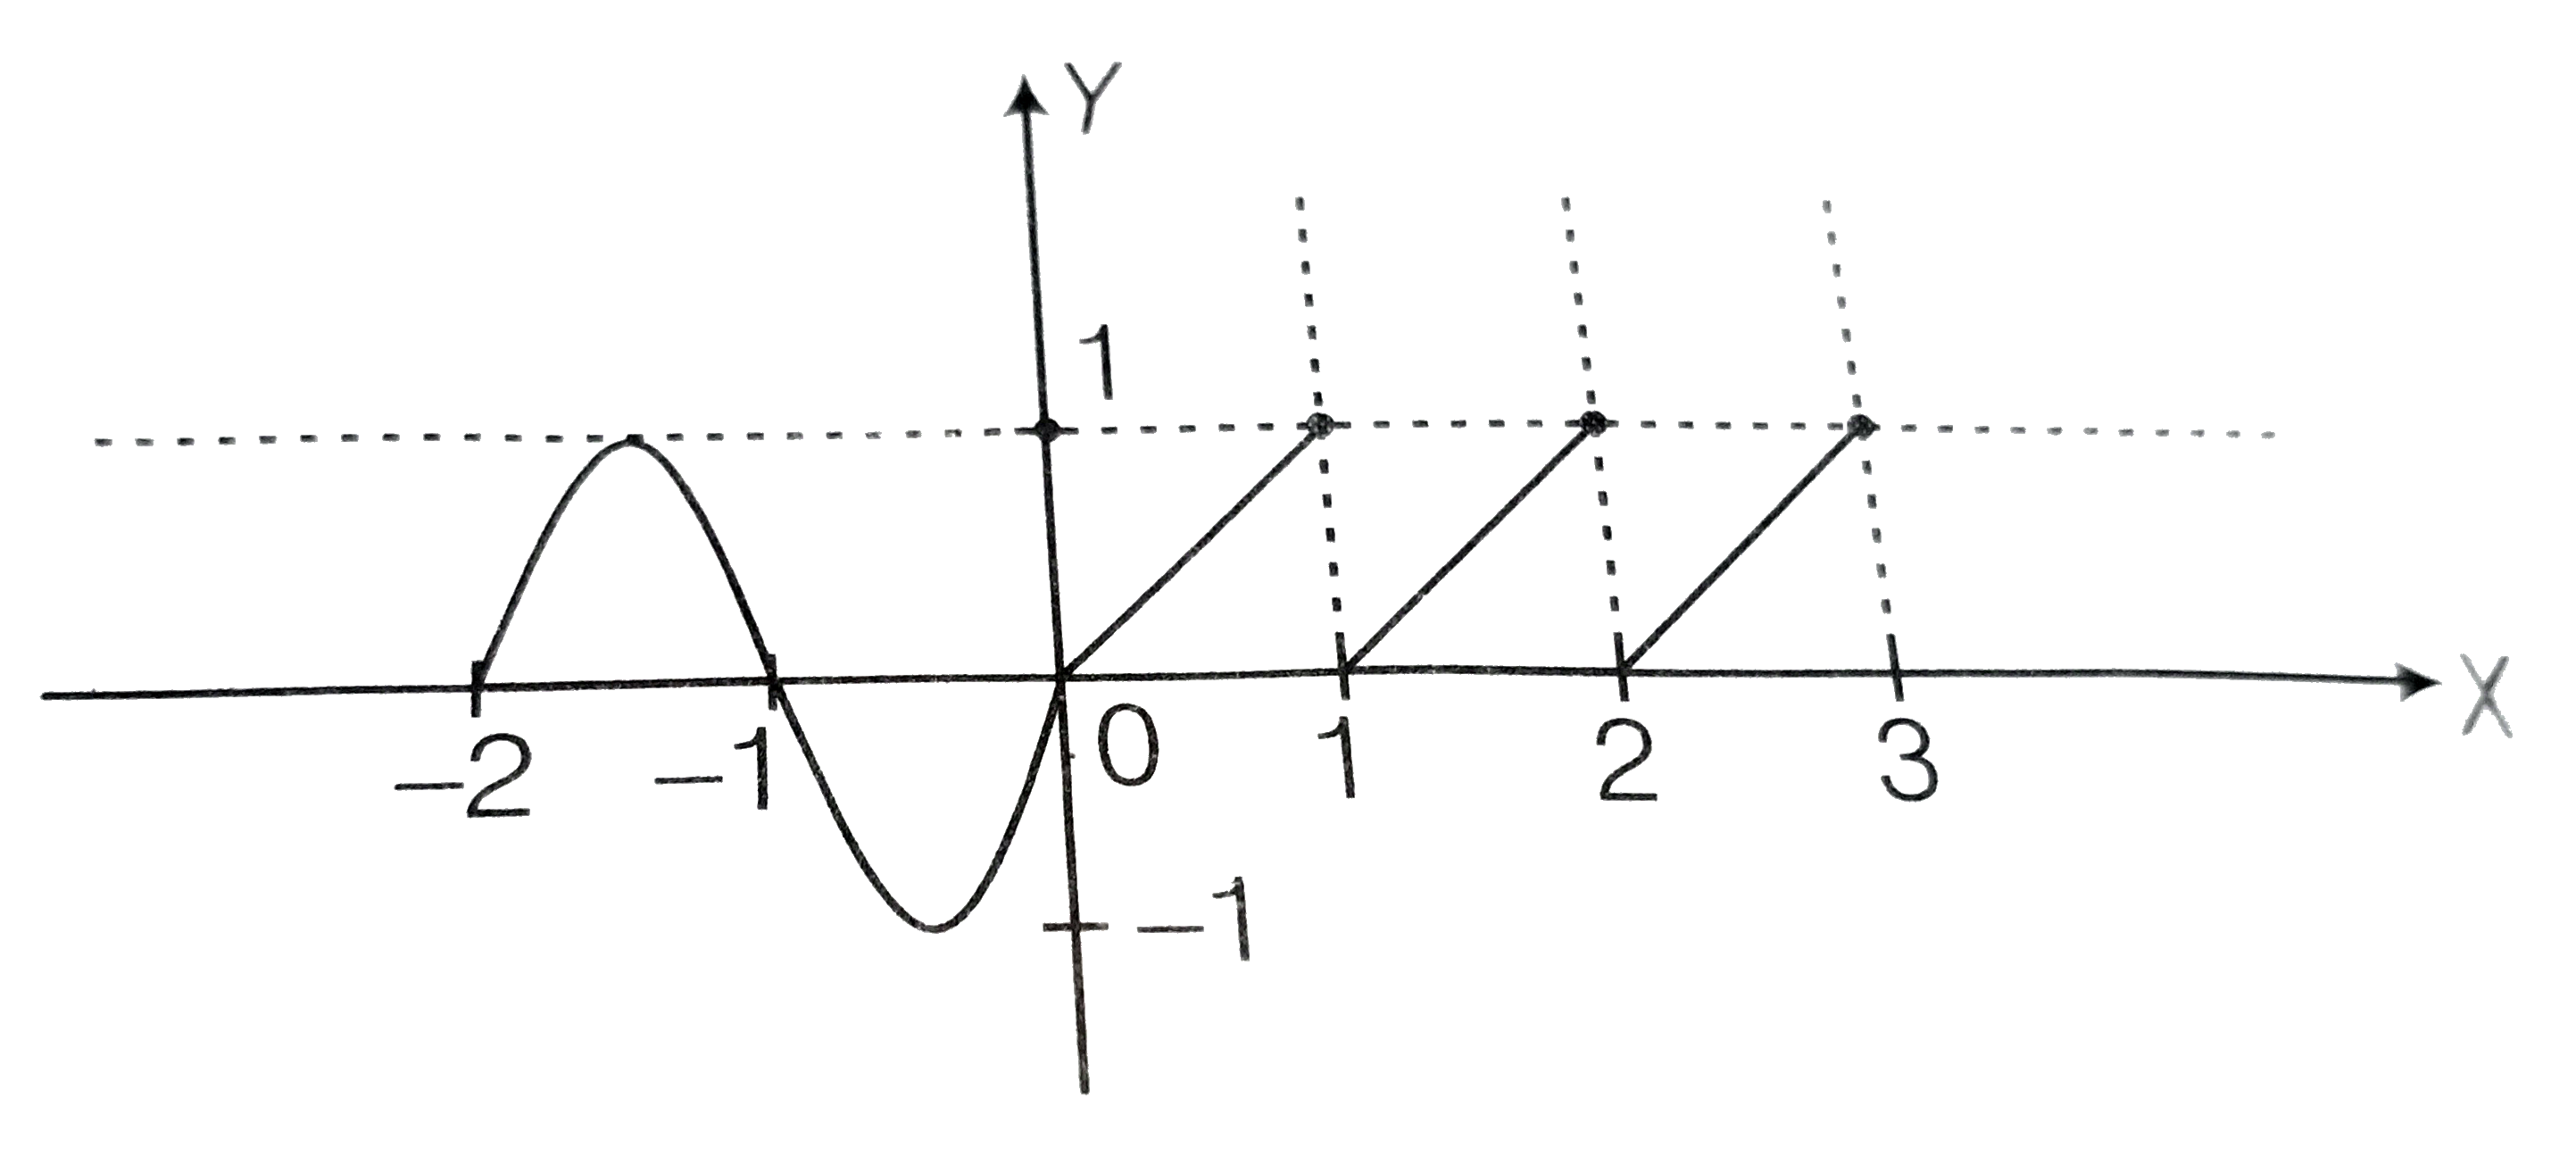
Draw the graph of following functions.
(g) 2f(x)
View SolutionConsider the following function f whose graph is given below.
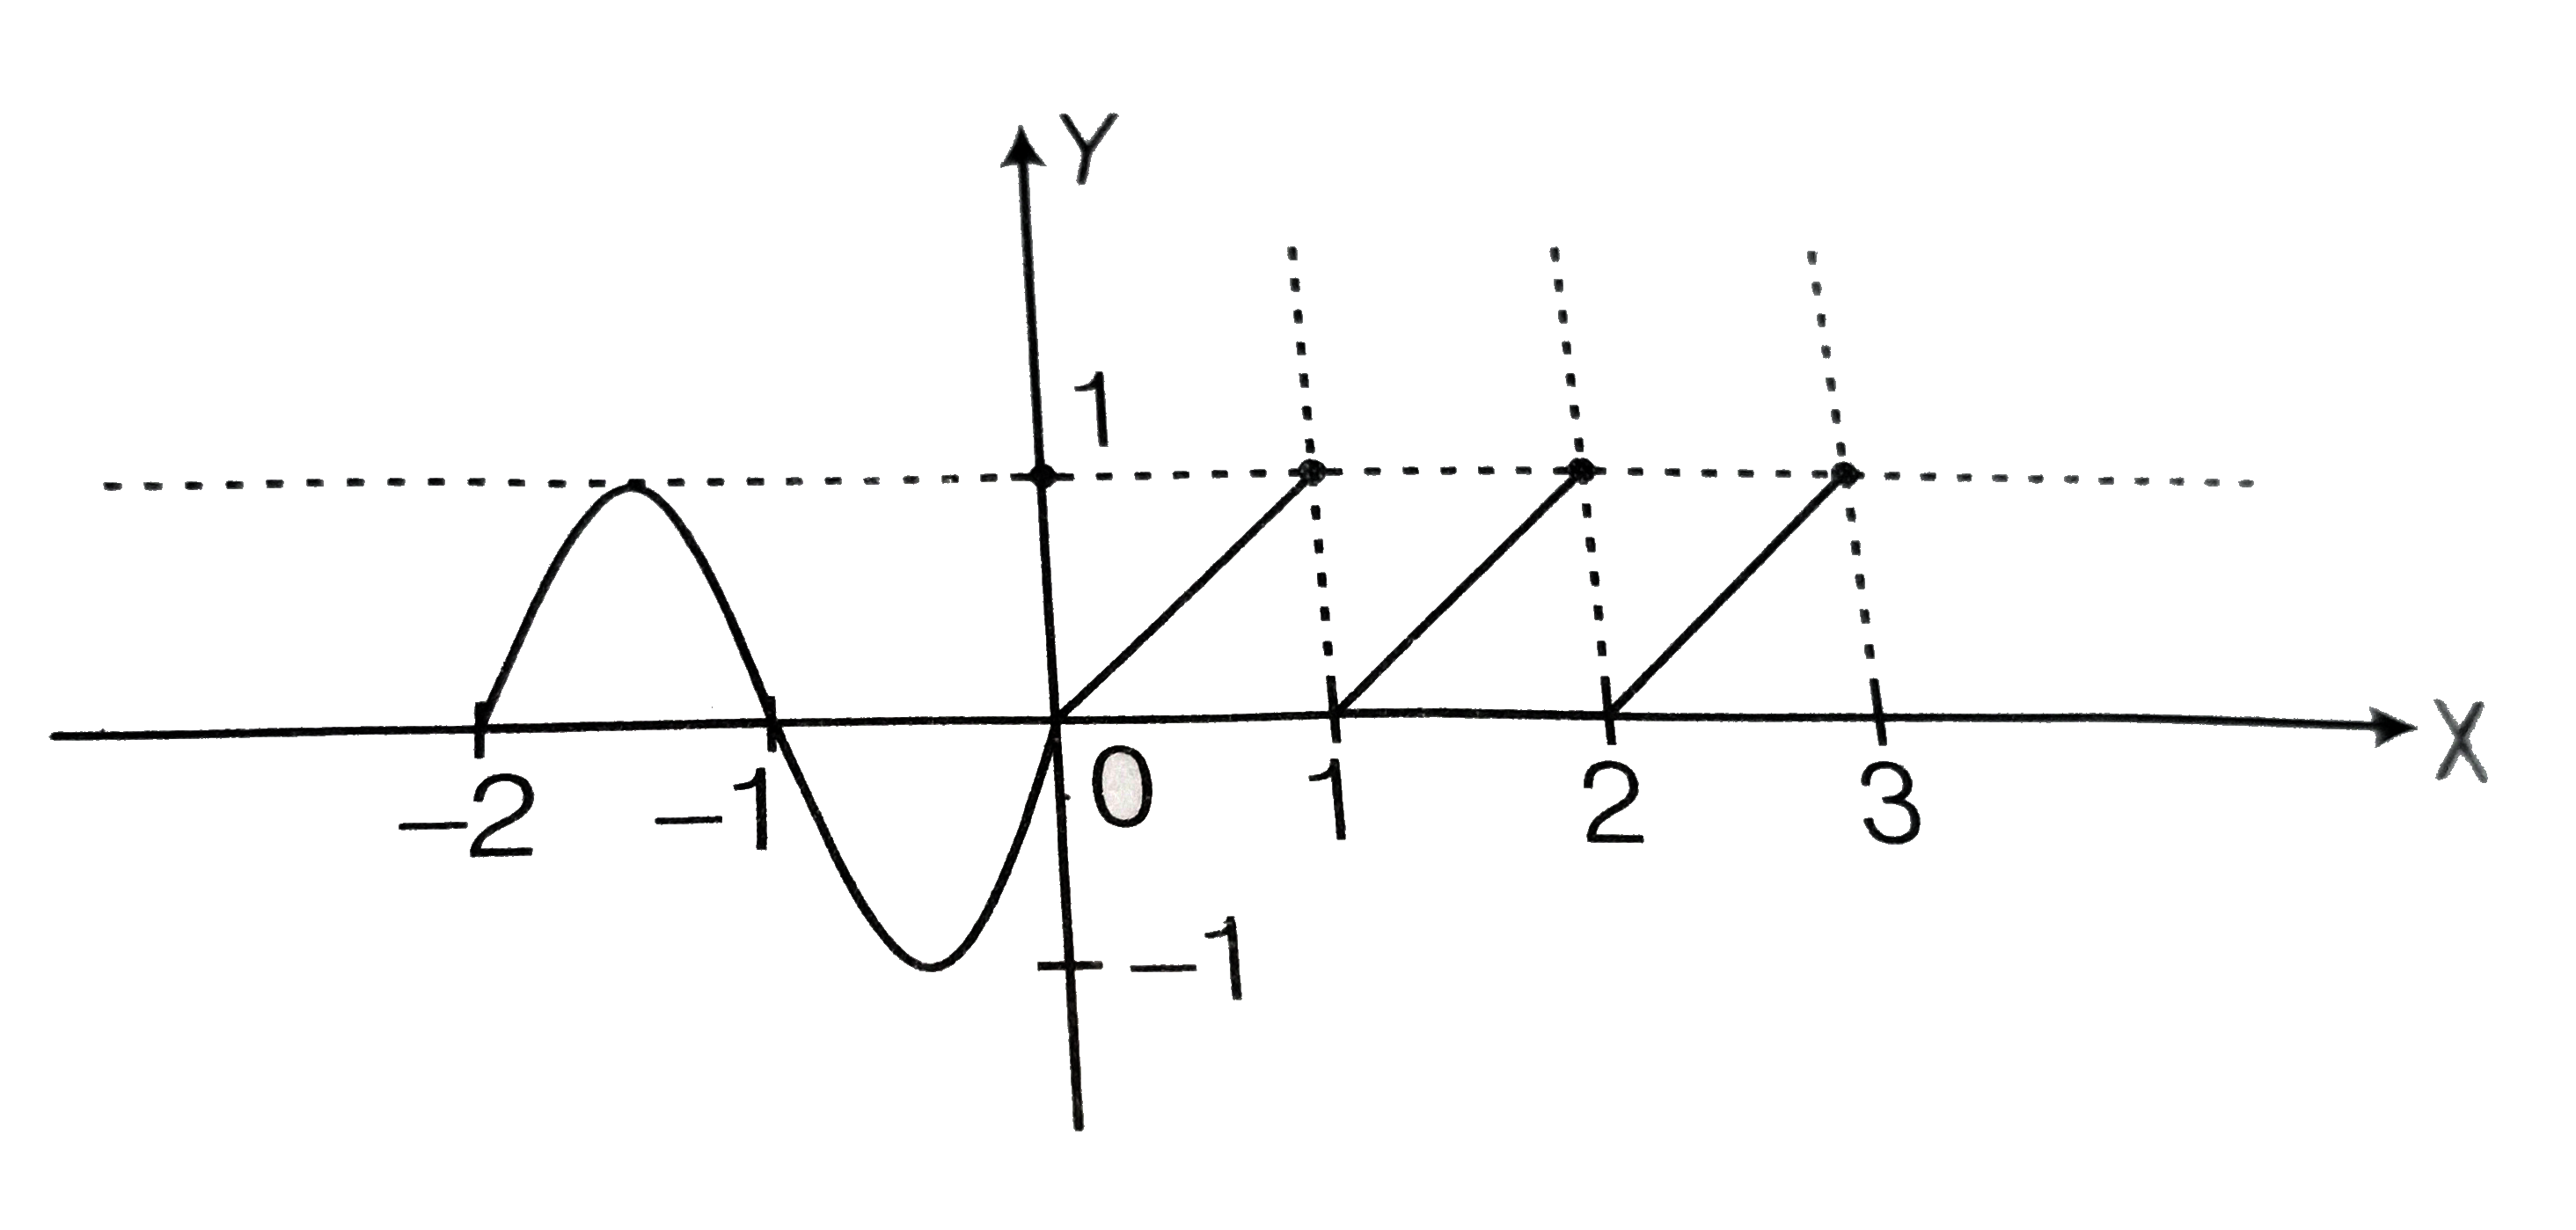
Draw the graph of following functions.
(g) f(x−[x])
View SolutionIf fandg are the function whose graphs are as shown, let u(x)=f(g(x)),w(x)=g(g(x))
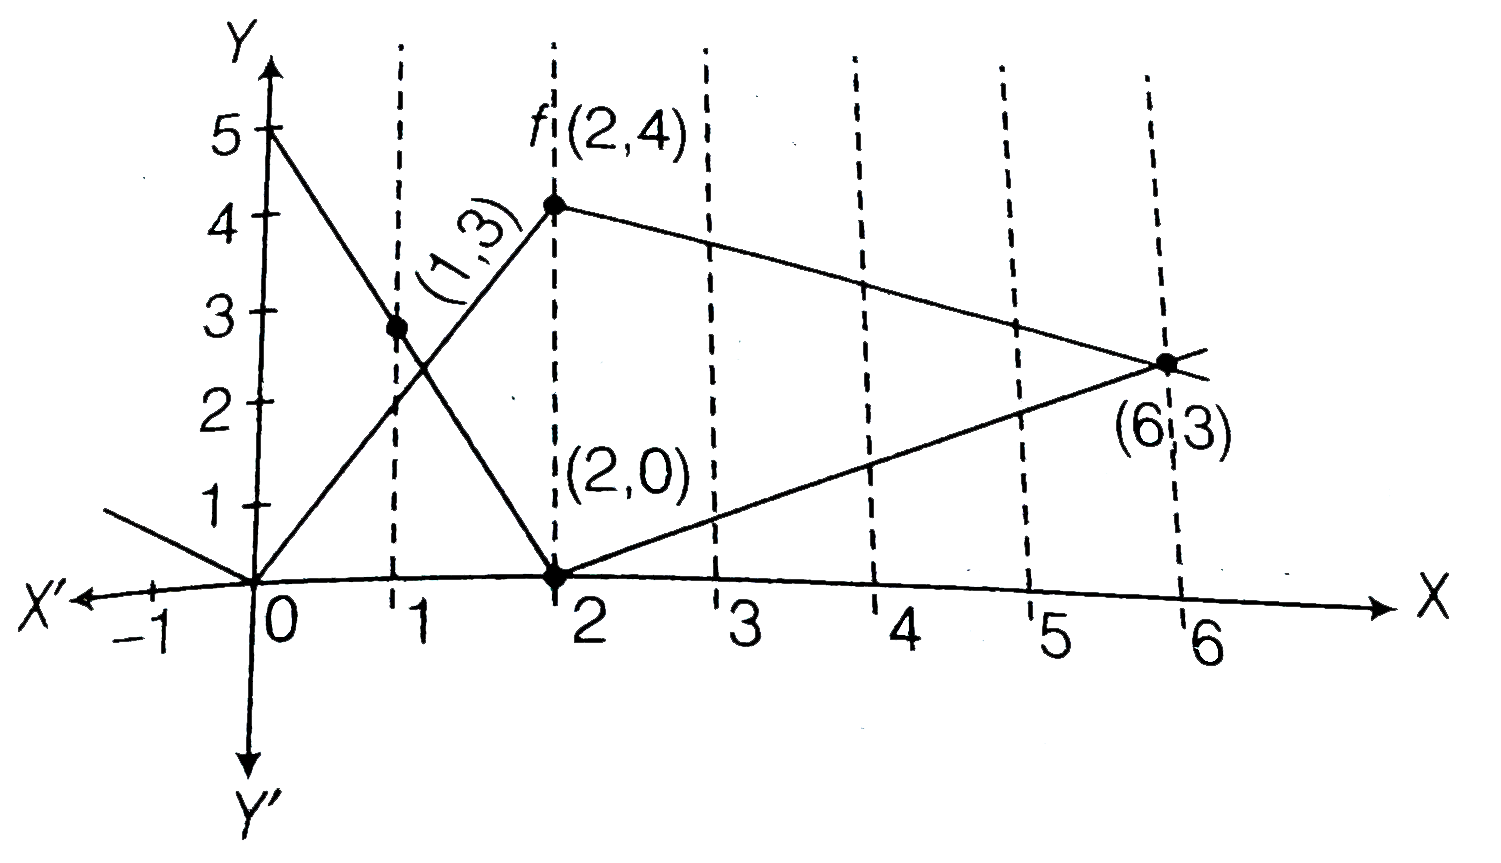 Then the value of u'(1)+w'(1) is
View SolutionThe graph of function f(x) is shown below :

Then the graph of g(x)=1f(|x|) is:
View SolutionConsider the following function f whose graph is given below.

Draw the graph of following functions.
(g) 2f(x)
View SolutionConsider the following function f whose graph is given below.

Draw the graph of following functions.
(g) f(x−[x])
View Solution
