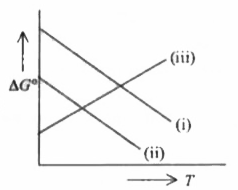
ΔG∘ vs T plot in the Ellingham's diagram slopes downward for the reaction Solution in Kannada
Mg+12O2→MgO
2Ag+12O2→Ag2O
C+12O2→CO
CO+12O2→CO2
The correct Answer is:A, B, D

Reaction (i) : M(s)+12O2(g)→MO(s) (where M represents metal)
Reaction (ii) : CO(g)+12O2(g)→CO2(g)
Reaction (iii) : C(s)+12O2(g)
ΔG∘vs T plot in the Ellingham's diagram slopes downwards for the reaction (i) and reaction (ii). For reaction (iii), ΔG∘vs T plot in Ellingham's diagram slopes upwards.
Topper's Solved these Questions
Similar Questions
15 moles of H2 and 5.2 moles of I2 are mixed and allowed to attain equilibrium at 500∘C. At equilibrium, the concentration of HI is found to be 10 moles. The equilibrium constant for the formation of HI is
01:42View SolutionThe number of unidentate ligands in the comples ion is called
03:02View SolutionΔG∘vsT plot in the Ellingham diagram slopes down for the reaction.
View SolutionDeltaG^(Ө) vs T plot in Ellingham diagram slopes downward for the reaction .
View SolutionδGo vs T plot in the Ellingham's diagram slopes downaward for the reaction.
01:43View SolutionA plot of k vs 1//T for a reaction gives the slope -1 xx 10^(4) K. The energy of activation for the reaction is:
View SolutionIn Ellingham diagrams of ΔG oxide formation Vs T, which of the following graphs has negative slope ?
View SolutionΔG∘ versus T plot the Ellingham 's diagram slopes downward for the reaction
View SolutionΔG∘vsT plot in the Ellingham's diagram slopes downward the reaction
View SolutionThe choice of reducing agent for metal oxide is decided by thermodynamic principles of metallurgy. ΔG must be negative. Ellingham diagram is a plot of ΔfG0 vs T for the formation of oxides of various elements. All the plots slope upwards when temperature increases. Each plot is a straight line except when some change in phase takes place. A metal will reduce the oxide of other metals which lie above it in this diagram.
ΔG0 vs T plot in the Ellingham's diagram slopes downward for the reaction.View SolutionIn Elingham diagrams of DeltaG de formation Vs T, which of the following graphs has negative slope?
02:12View SolutionWhich of the following reaction is proper for ellingham's diagram for graph of DeltaG^@ vs T ?
02:21View SolutionΔGӨ vs T plot in Ellingham diagram slopes downward for the reaction .
03:39View SolutionΔG∘vsT plot in the Ellingham diagram slopes down for the reaction.
06:47View SolutionIn Elingham diagrams of DeltaG de formation Vs T, which of the following graphs has negative slope?
02:09View SolutionΔG∘'Vs.T plot in the Ellingham's diagram slopes downward for the reaction : Mg+2O2→MgO, 2Ag+12O2→Ag2O, C+12O2→CO , CO+12O2→CO2
06:47View Solution

