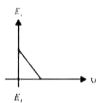
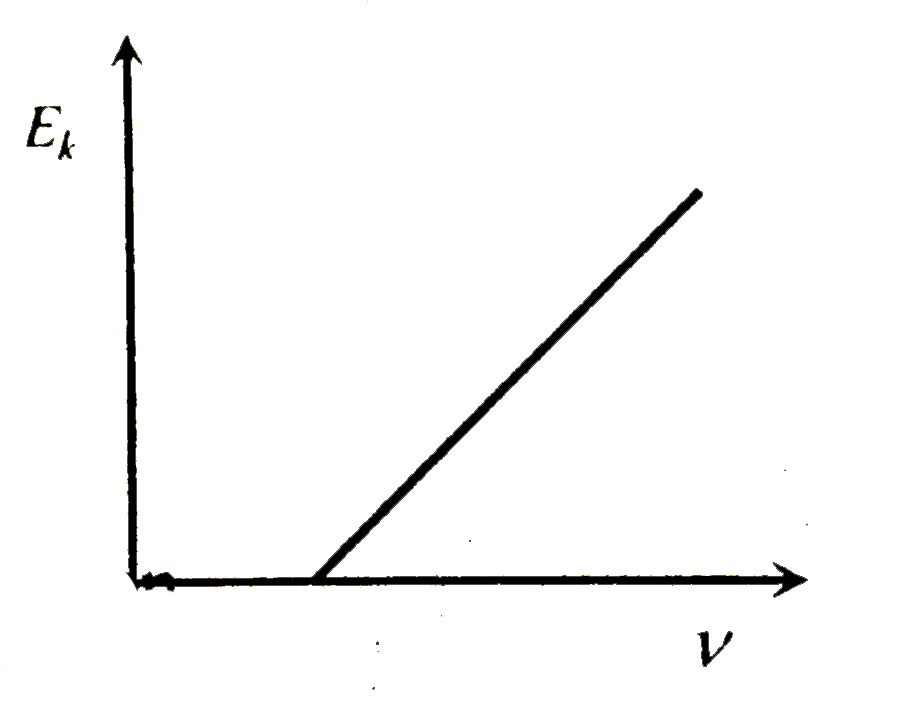
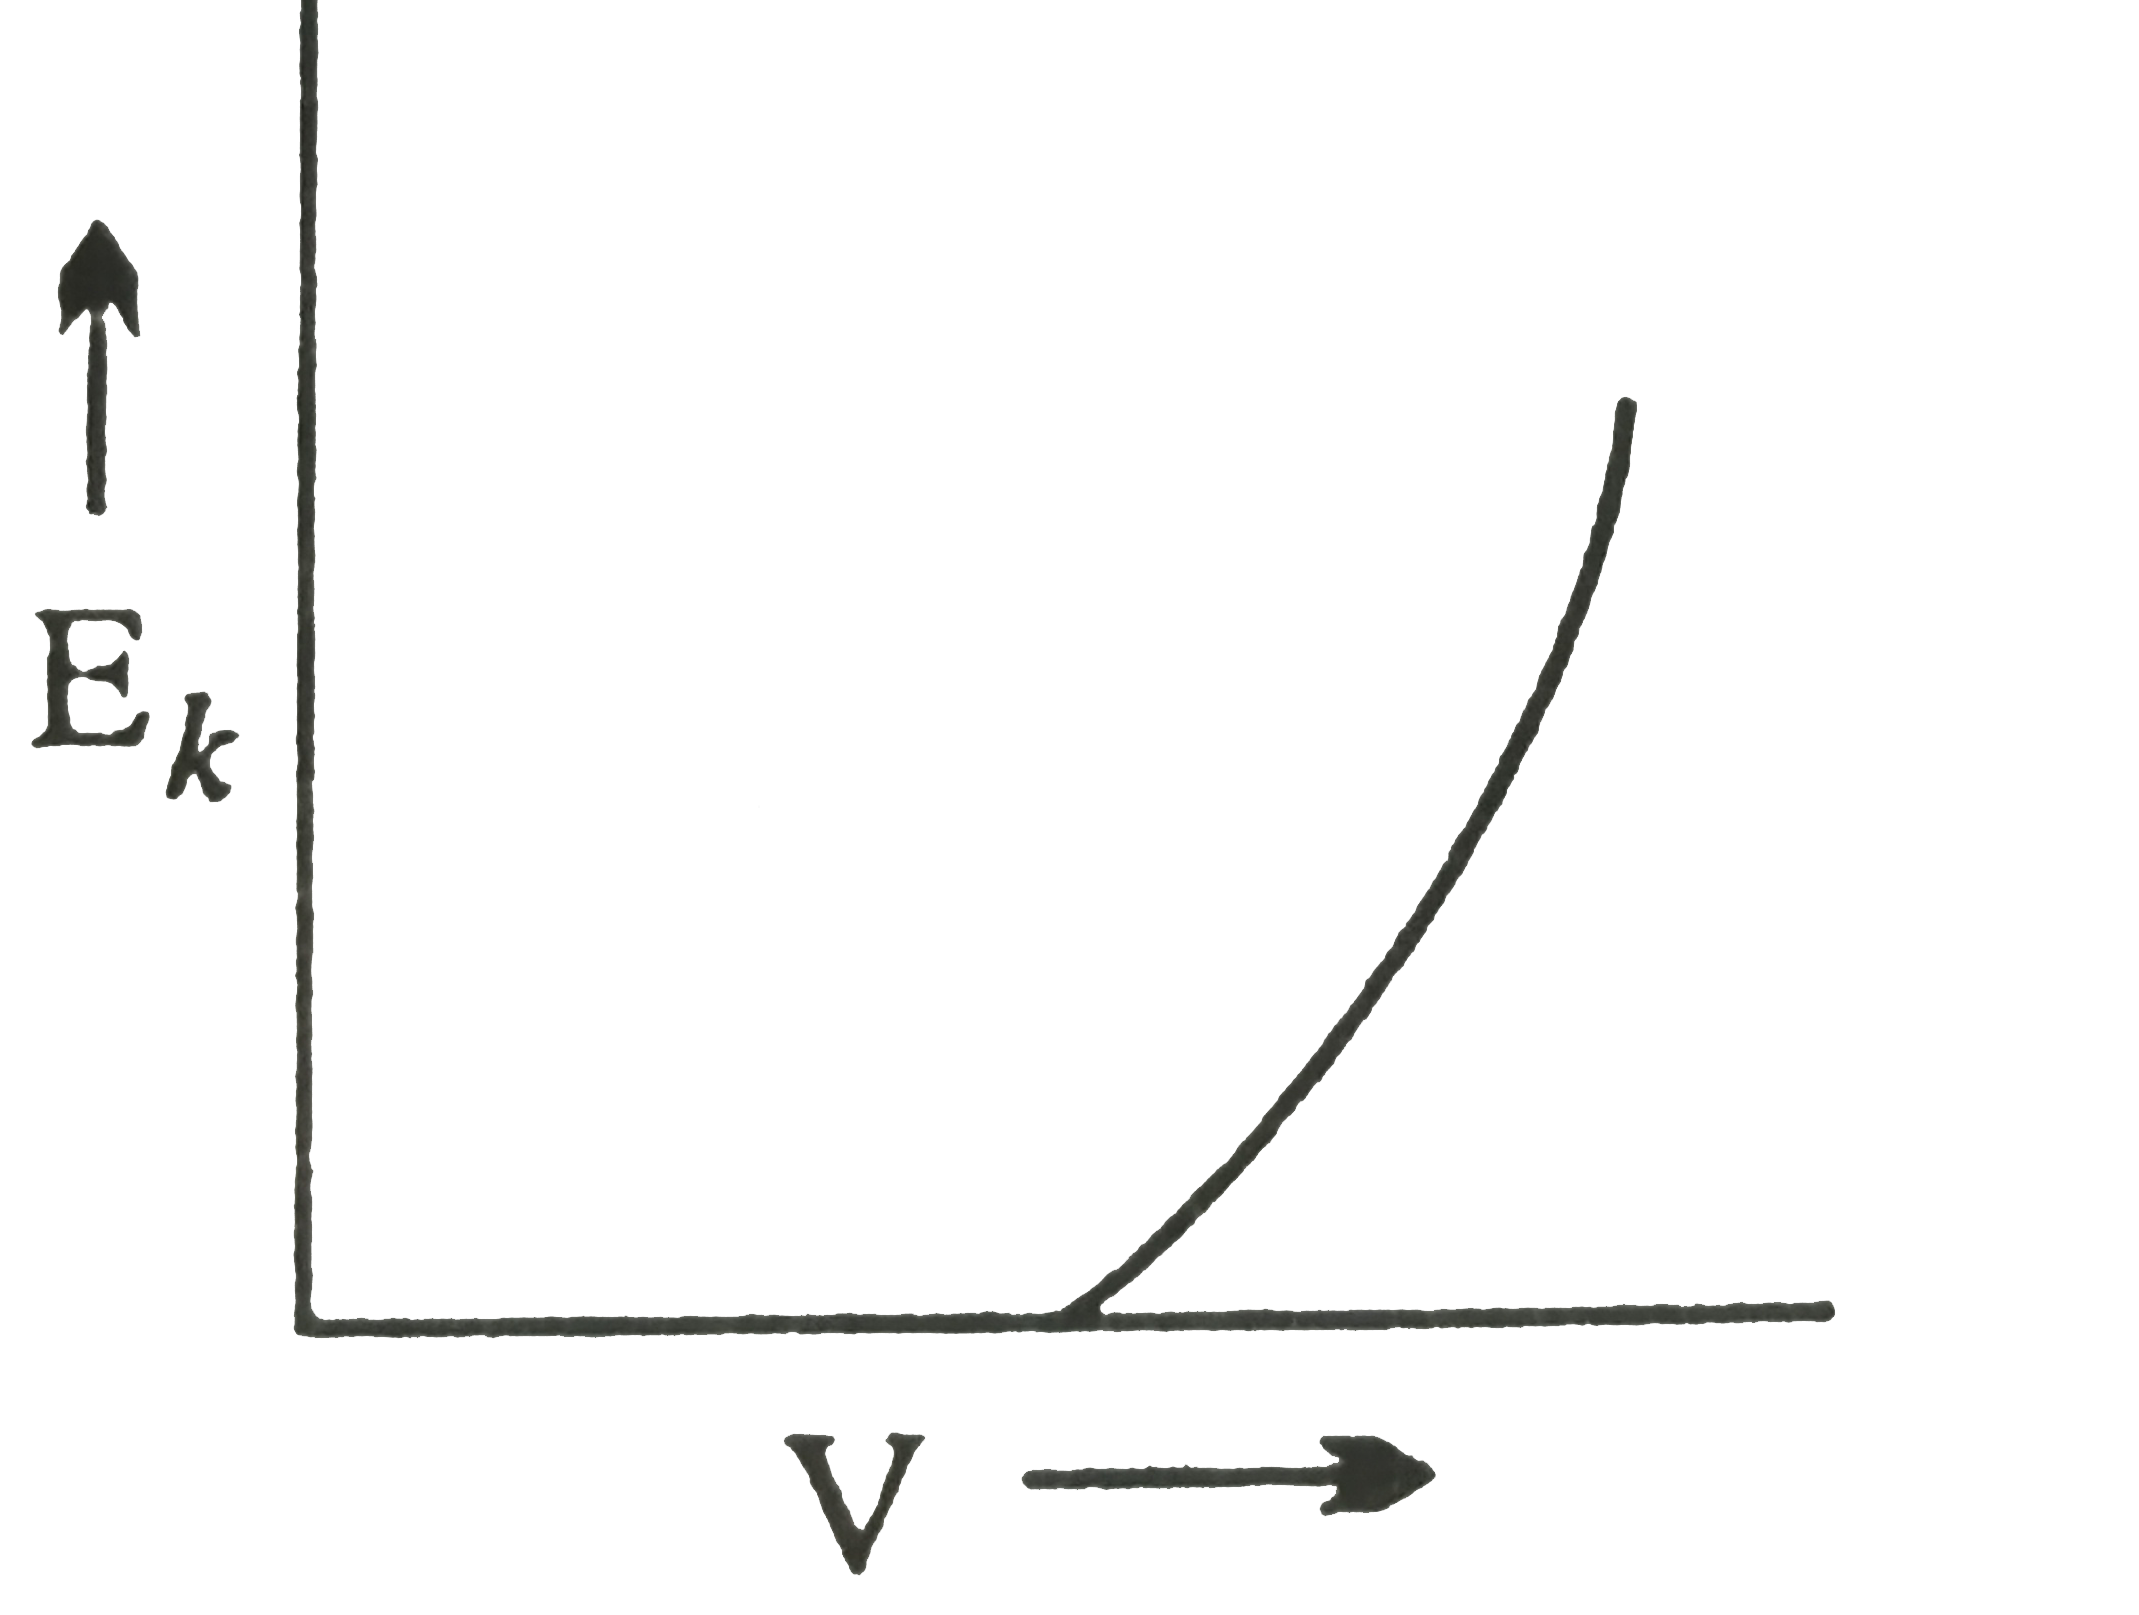
Which one of the following graphs represents the variation of maximum kinetic energy (EK) of the emitted electrons with frequency υ in photoelectric effect correctly? Solution in Kannada


The correct Answer is:D
hυ−hυ0=EK, according to photoelectric equation, when υ=υ0,EK=0
Graph (d) represents EK−υ relationship.
Topper's Solved these Questions
Similar Questions
The twinkling effect of star light is due to
01:24View SolutionIf μ0 is permeability of free space and ε0 is permittivity of free space , the speed of light in vacuum is given by
01:27View SolutionWhich one of the following graphs represents the variation of maximum kinetic energy (E_K) of the emitted electrons with frequency u in photoelectric effect correctly ?
06:38View SolutionFor the photoelectric effect, the maximum kinetic energy Ek of the emitted photoelectrons is plotted against the frequency ν of the incident photons as shown in the figure. The slope of the curve gives
 View Solution
प्रकाशवैधुत प्रभाव में आपतित प्रकाश की आवृत्ति और उत्सर्जित इलेक्ट्रॉनों की अधिकतम गतिज ऊर्जा के बीच ग्राफ खींचिए । ग्राफ की प्रवणता (झुकाव ) क्या निरूपित करती है ?
02:33View Solutionप्रकाश - विधुत उत्सर्जन के प्रयोग में किसी धातु तल से उत्सर्जित फोटो - इलेक्ट्रॉन की अधिकतम गतिज ऊर्जा Ek तथा उस पर आपतित प्रकाश की आवृत्ति υ के बीच खींचा गया ग्राफ प्रदर्शित है । गणना कीजिए :
आवृत्ति 8×10¹⁴ हर्ट्ज के आपतित प्रकाश के लिए उत्सर्जित इलेक्ट्रॉनों की अधिकतम गतिज ऊर्जा ।02:39View Solutionजब hv आवृत्ति के फोटॉन एम्यूमिनियमकी प्लेट (कार्यफलन =E0) पर आपतित होते है तो उत्सर्जित फोटों-इलेक्ट्रॉनों की अधिकतम गतिज ऊर्जा K होती है। यदि विकिरण की आवृत्ति को दुगुना कर दिया जाये तो उत्सर्जित प्रकाश-इलेक्ट्रॉनों की अधिकमत गतिज ऊर्जा होगी-
View Solutionप्रकाश-विद्युत प्रभाव के लिए उत्सर्जित फोटो इलेक्ट्रॉनों की अधिकतम गतिज ऊर्जा EK तथा आपतित फोटॉनों की आवृत्ति υe के मध्य खींचा गया वक्र चित्र में दर्शाया गया है। इस वक्र का ढाल दर्शाता है-
 View Solution
Which one of the following graphs represent the variation of kinetic energy (k) with time ?
01:27View SolutionWhich one of the following graphs represent the variation of kinetic energy (k) with time ?
03:13View SolutionFor the photoelectric effect, the maximum kinetic energy Ek of the emitted photoelectrons is plotted against the frequency of the incident photons as shown in the figure. The slope of the curve gives
 03:41View Solution
For photoelectric effect, the graph of the maximum kinetic energy K of the emitted photo-electron against the incident photon of frequency v is shown in the figure. shows the slope of the curve
02:43View SolutionThe maximum kinetic energy of emitted electrons in a photoelectric effect does not depend upon
View SolutionThe maximum kinetic energy of emitted electrons in a photoelectric effect does not depend upon
03:08View SolutionIn photoelectric effect, maximum kinetic energy of the emitted electron depends upon
View Solution
