Which one of the following graphs represent the variation of kinetic energy (k) with time ?


The correct Answer is:B
Kinetic energy varies with time but is never negative.
Topper's Solved these Questions
- OSCILLATIONS Book:PREMIERS PUBLISHERSChapter:OSCILLATIONS Exercise:OTHER IMPORTANT QUESTIONS & ANSWERS ( VERY SHORT ANSWER QUESTIONS )
Explore 28 Videos
- OSCILLATIONS Book:PREMIERS PUBLISHERSChapter:OSCILLATIONS Exercise:OTHER IMPORTANT QUESTIONS & ANSWERS ( SHORT ANSWER QUESTIONS )
Explore 46 Videos
- OSCILLATIONS Book:PREMIERS PUBLISHERSChapter:OSCILLATIONS Exercise:EVALUATION TEXTBOOK QUESTIONS AND ANSWERS ( NUMERICAL PROBLEMS )
Explore 24 Videos
- NATURE OF PHYSICAL WORLD AND MEASUREMENTBook:PREMIERS PUBLISHERSChapter:NATURE OF PHYSICAL WORLD AND MEASUREMENTExercise:OTHER IMPORTANT QUESTIONS & ANSWERS (III. Short Answer Questions.)
Explore 24 Videos
- PROPERTIES OF MATTERBook:PREMIERS PUBLISHERSChapter:PROPERTIES OF MATTERExercise:OTHER IMPORTANT QUESTION & ANSWERS (NUMERICAL PROBLEMS)
Explore 56 Videos
Similar Questions
A body moves from rest with a constant acceleration. Which one of the following graphs represents the variation of its kinetic energy K with the distance travelled x?
View SolutionA body moves from rest with a constant acceleration. Which one of the following graphs represents the variation of its kinetic energy K with the distance travelled x?
View Solution
Knowledge Check
A body moves from rest with a constant acceleration. Which one of the following graphs represents the variation of its kinetic energy K with the distance travelled x?
A B
B C
C D
D
A body moves from rest with a constant acceleration. Which one of the following graphs represents the variation of its kinetic energy K with the distance travelled x?
A B
B C
C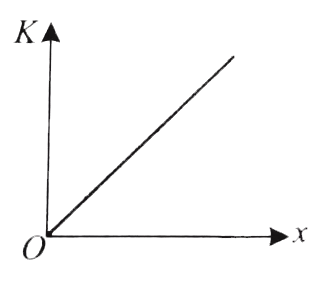 D
D
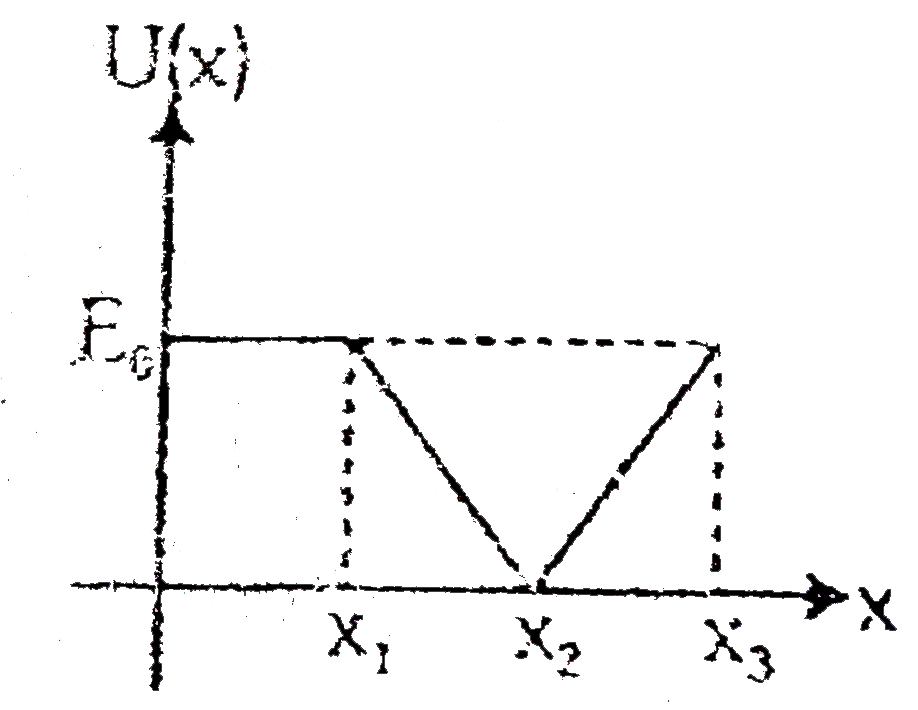
The potential energy U(x) of a particle moving along x−axis is shown in figure. Which one of the following graphs represents the variation of kinetic energy of this particel if its total mechanical enery is E0
 A
A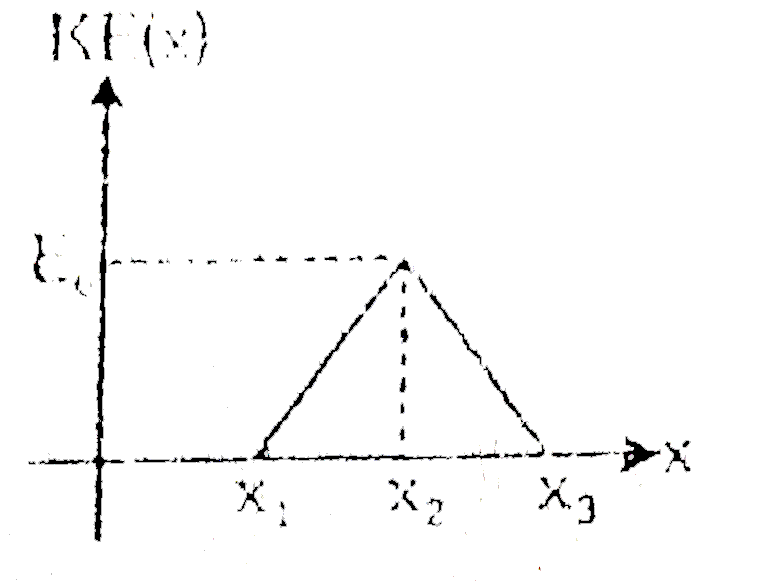 B
B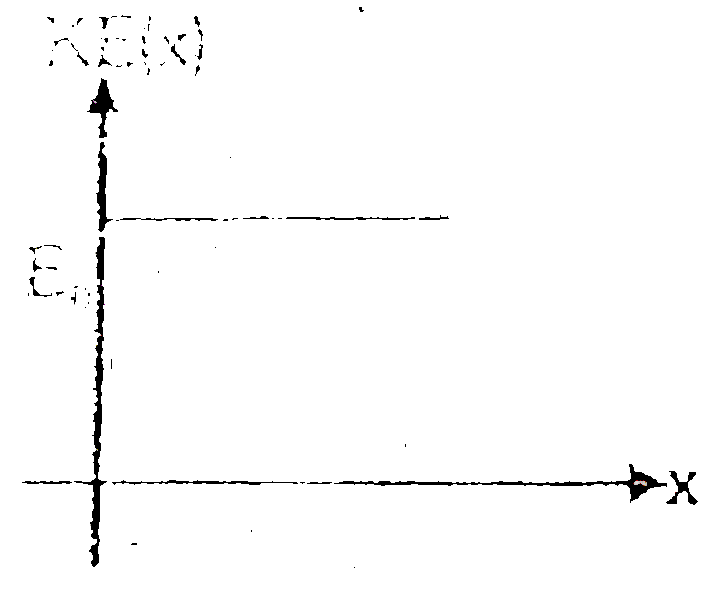 C
C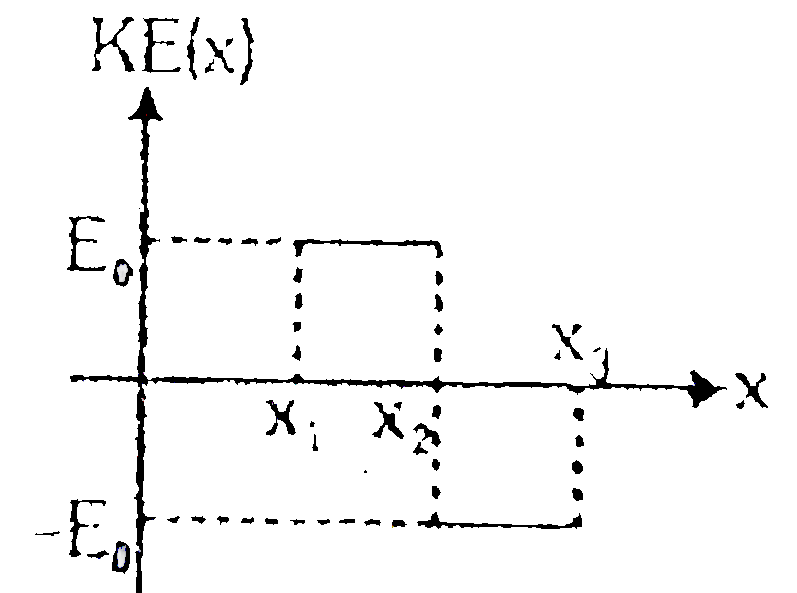 D
D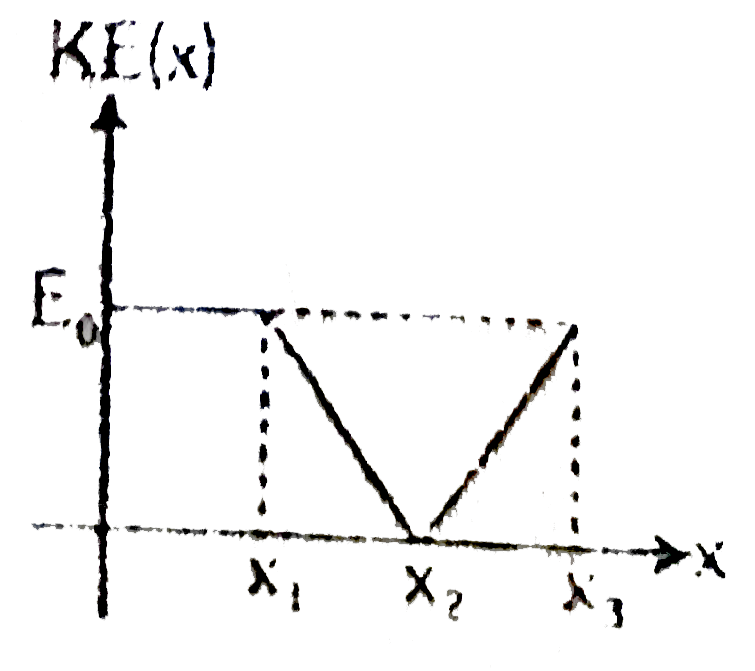
The potential energy U(x) of a particle moving along x−axis is shown in figure. Which one of the following graphs represents the variation of kinetic energy of this particel if its total mechanical enery is E0

View SolutionWhich one of the following graphs represents the variation of maximum kinetic energy (EK) of the emitted electrons with frequency u in photoelectric effect correctly ?
View SolutionWhich one of the following given graphs represents the variation of rate constant (k) with temperature (f) for an endothermic reaction ?
View SolutionA body moves from rest with a constant ac- celeration. Which of the following graphs represents the variation of its kinetic energy (E) with distance travelled (x)?
View SolutionLiquid oxygen at 50K is heated to 300K at constant pressure of 1atm. The rate of heating is constant. Which of the following graphs represents the variation of temperature with time?
View Solution
