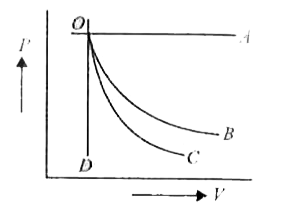
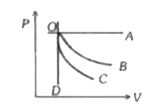
A graph of pressure versus volume for an ideal gas for different process is as shown. In the graph curve OC represents
 Solution in Kannada
isochoric process
isothermal process
isobaric process
adiabatic process
The correct Answer is:D
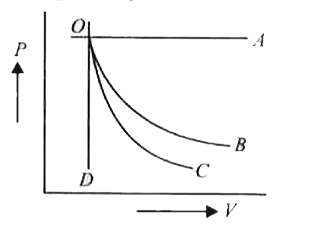
In the graph
(i) Curve OA represents isobaric process(pressure in constant).
The slope of adiabatic process is more steeper than the isothermal process. Hence
(ii) Curve OB represents isothermal process
(iii) Curve OC represents adiabatic process (steeper than OB)
(iv) curve OD represents isochoric process (volume is constant).
Topper's Solved these Questions
Similar Questions
If μ0 is permeability of free space and ε0 is permittivity of free space , the speed of light in vacuum is given by
01:28View SolutionAll capacitors used in the diagram are identical and each is capacitance C .Then the effective capacitance between the points A and B is
 02:14View Solution
Pressure versus temperature graph of an ideal gas of equal number of moles of different volumes is plotted as shown in Fig. Choose the correct alternative.
01:41View SolutionPressure versus temperature graph of an ideal gas as shown in Fig. Corresponding density (rho) versus volume (V) graph will be
01:31View SolutionTemperature versus pressure graph of an ideal gas is shown in Fig. During the process AB
03:45View SolutionAn ideal monatomic gas undergoes a cyclic process ABCA as shown in the figure. Graph of pressure versus volume of the cyclic process ABCA is
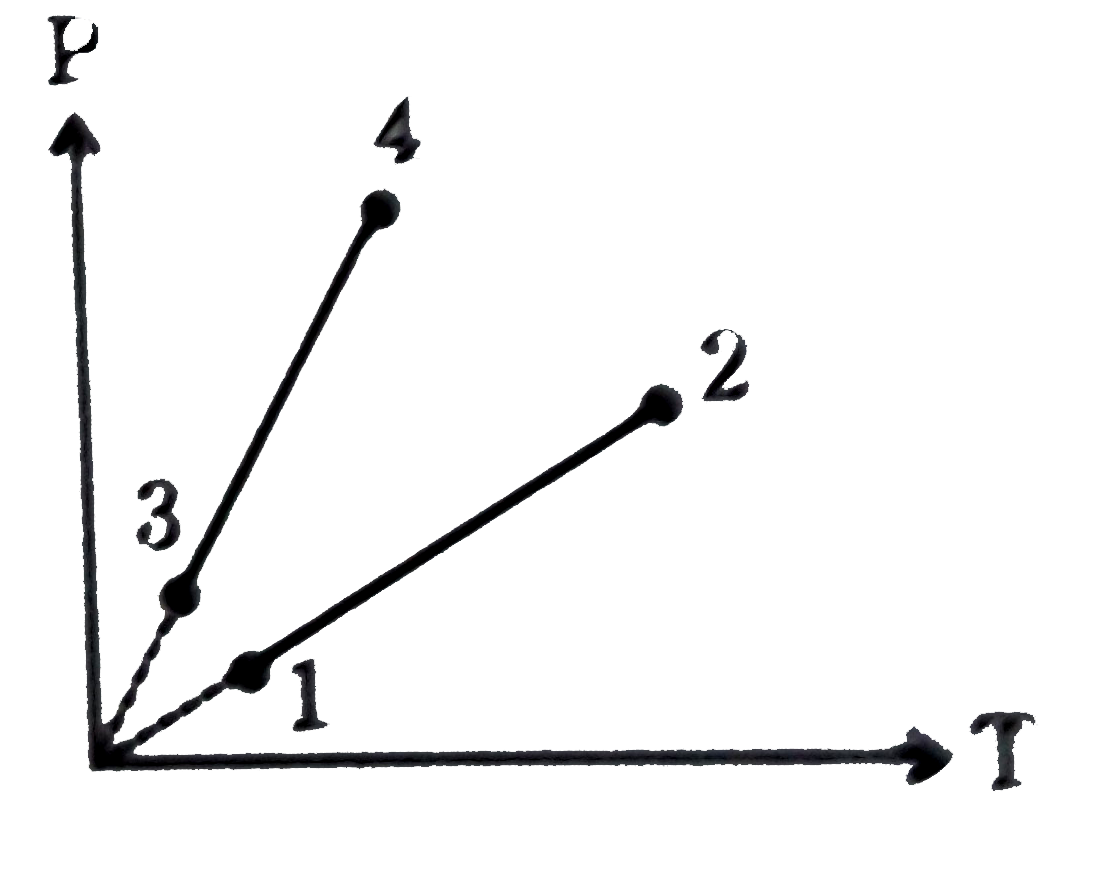
02:13View SolutionPressure versus temperature graph of an ideal gas of equal number of moles of different volumes is plotted as shown in figure. Choose the correct alternatives.
 01:52View Solution
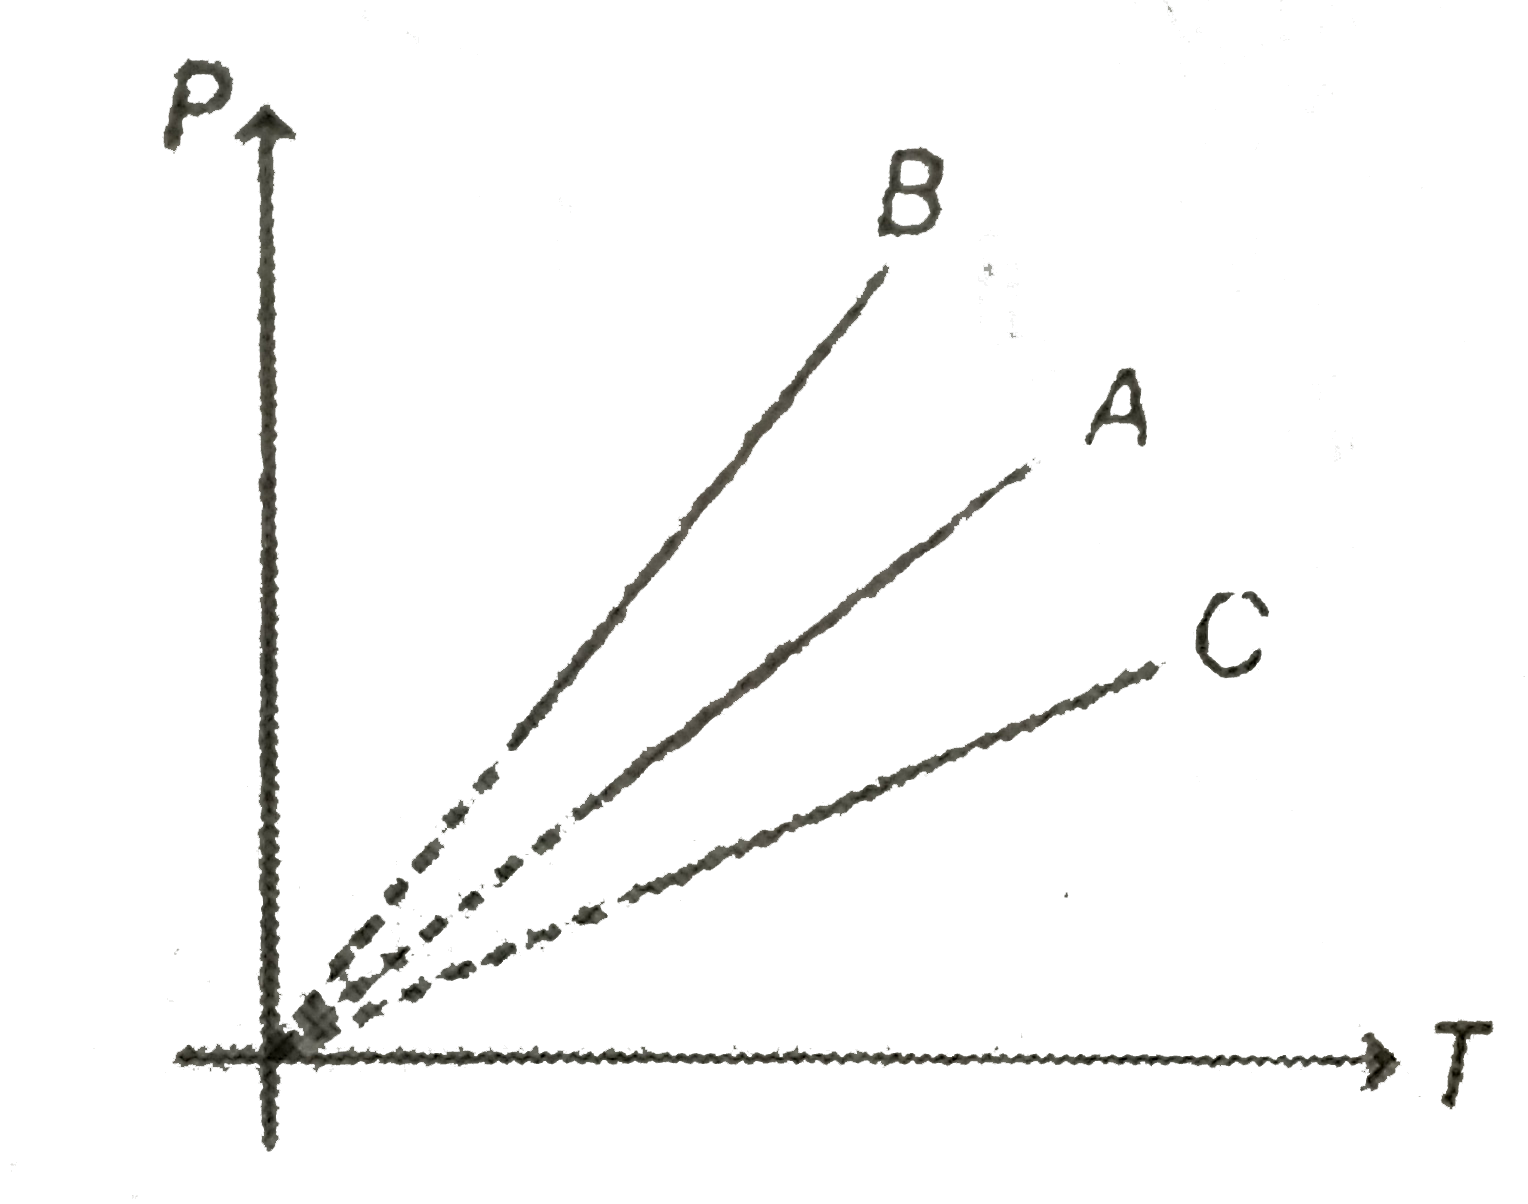
Pressure versus temperature graph of an ideal gas at constant volume V is shown by the straight line A. Now mass of the has is doubled and the volume is halved, then the corresponding pressure versus temperature graph will be shown by the line
 06:29View Solution
Pressure versus density graph of an ideal gas is shown in figure
02:34View Solutionआदर्श गैस के विभिन्न प्रक्रमों के लिए दाब तथा आयतन का ग्राफ प्रदर्शित है। ग्राफ में वक्र OC प्रदर्शित करता है
 View Solution
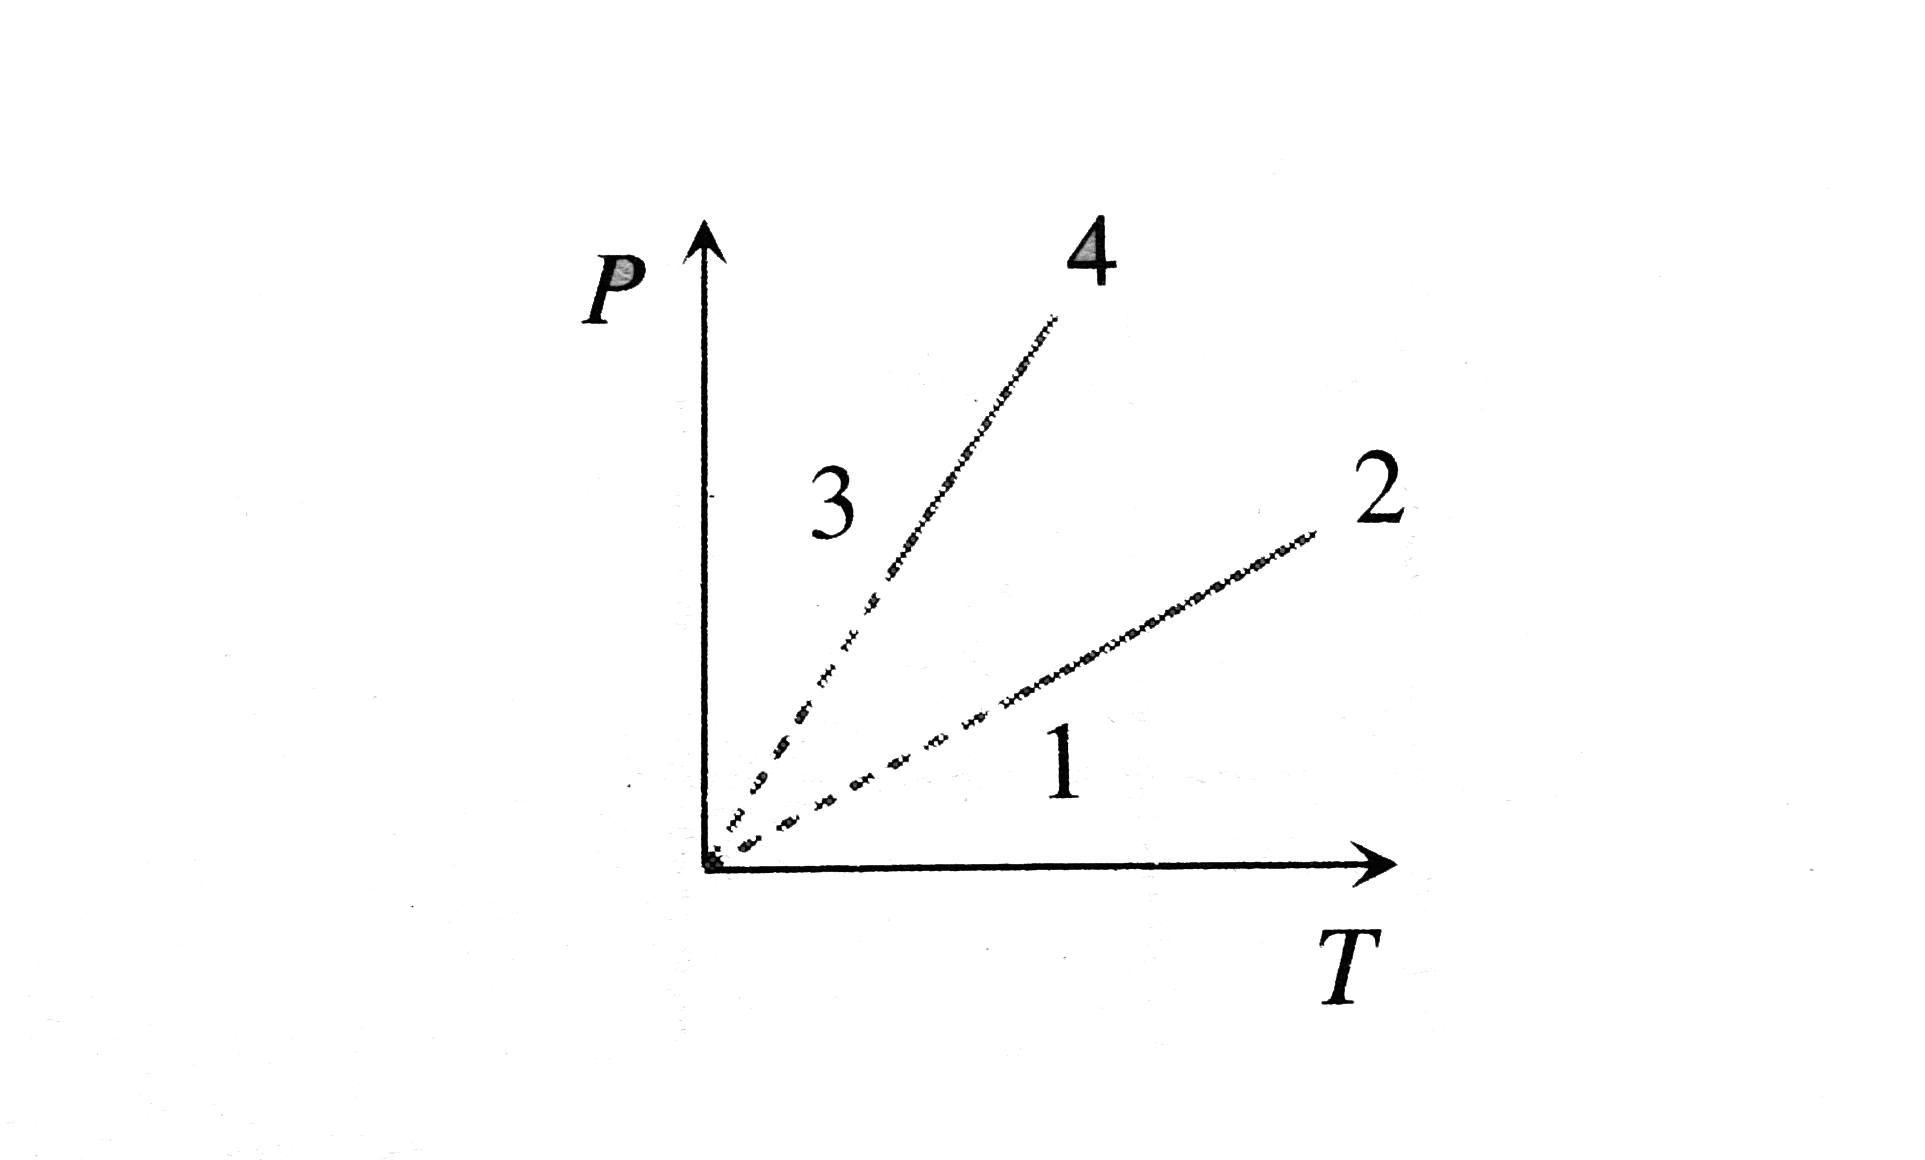
Pressure versus temperature graph of an ideal gas of equal number of moles of different volumes is plotted as shown in Fig. Choose the correct alternative.
 04:15View Solution
P-V diagram of an ideal gas for a process ABC is as shown in the figure.

Plot pressure versus density graph of the gas for the process ABC.01:36View SolutionPressure versus temperature graph of an ideal gas at constant volume V is shown by the straight line A. Now mass of the gas is doubled and the volume is halved, then the corresponding pressure versus temperature graph will be shown by the line
02:13View SolutionPressure versus density graph of an ideal gas is shown in figure
00:53View SolutionTemperature versus pressure graph of an ideal gas is shown in Fig. During the process AB
05:03View Solution

