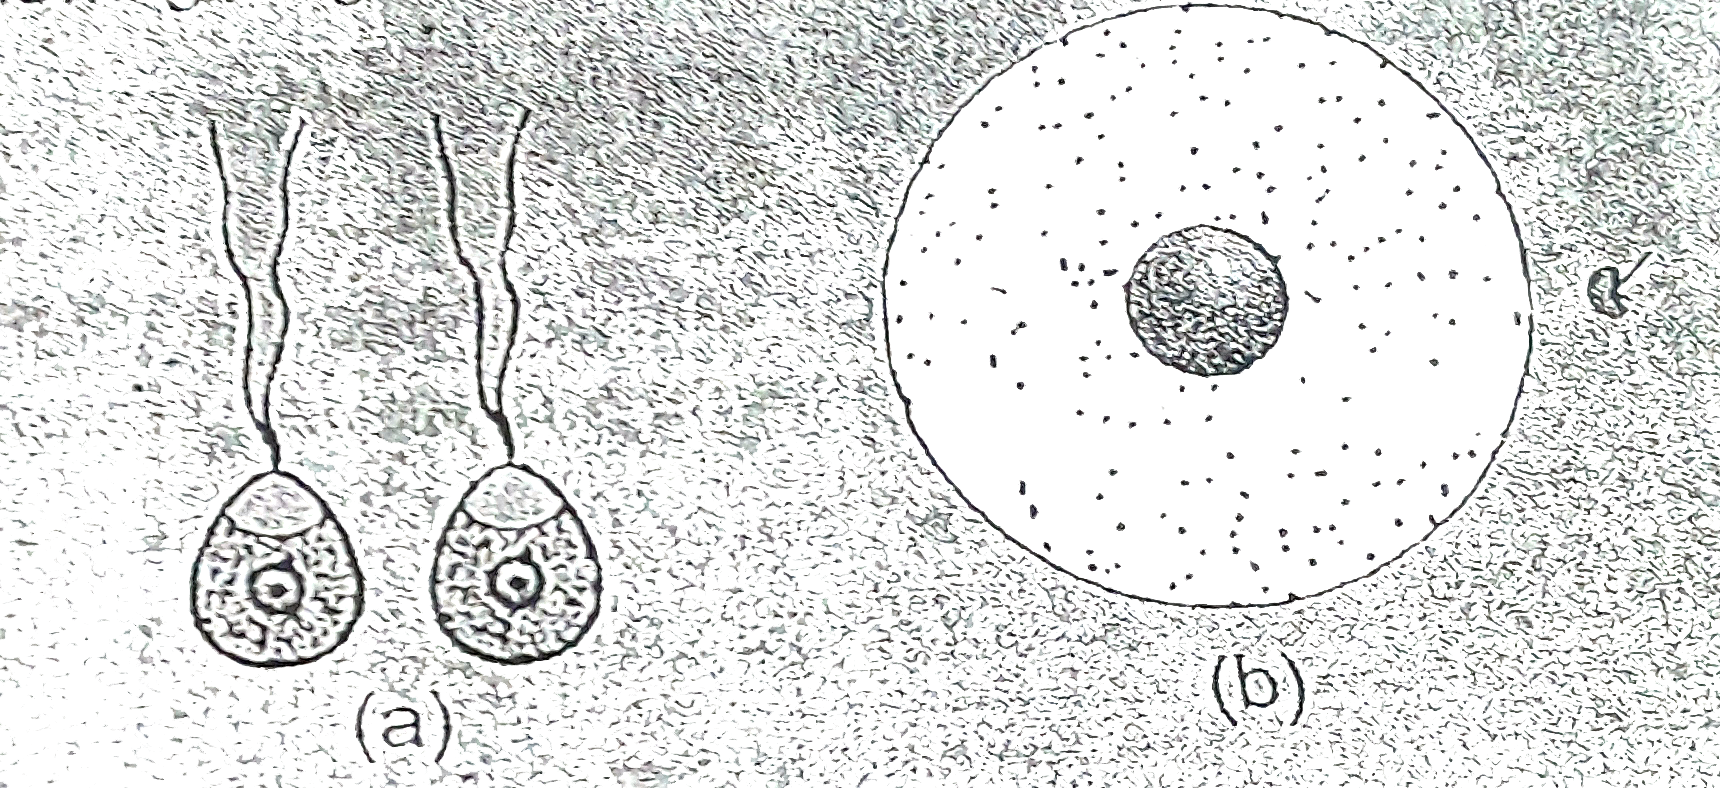
In the following diagram bunsen flame the (X ) represent.

Oxidising zone
Reducing zone
Lower temperature zone
Hottest portion of flame
The correct Answer is:B, C
Step by step video, text & image solution for In the following diagram bunsen flame the (X ) represent. by Chemistry experts to help you in doubts & scoring excellent marks in Class 12 exams.
Topper's Solved these Questions
- BOOK - RESONANCECHAPTER - QUALITATIVE ANALYSIS (ANION)EXERCISE - Exercise-310videos
QUALITATIVE ANALYSIS (ANION)
- BOOK - RESONANCECHAPTER - QUALITATIVE ANALYSIS (ANION)EXERCISE - Additional Problems for Self Practice (APSP)30videos
QUALITATIVE ANALYSIS (ANION)
- BOOK - RESONANCECHAPTER - QUALITATIVE ANALYSIS (ANION)EXERCISE - Exercise-159videos
QUALITATIVE ANALYSIS (ANION)
- BOOK - RESONANCECHAPTER - QUALITATIVE ANALYSISEXERCISE - INORGANIC CHMISTRY(Qualitative analysis)35videos
QUALITATIVE ANALYSIS
- BOOK - RESONANCECHAPTER - QUALITATIVE ANALYSIS PART 1EXERCISE - A.L.P39videos
QUALITATIVE ANALYSIS PART 1
Similar Questions
Knowledge Check
- Question 1 - Select One
The following diagram represents:

a) Adaptive radiation
b) Divergent evolution
c) Convergent evolution
d) Both (a) and (b)AAdaptive radiationBDivergent evolutionCConvergent ecolutionDBoth (a) and (b) - Question 2 - Select One
Break-even point in the following diagram is represented by :
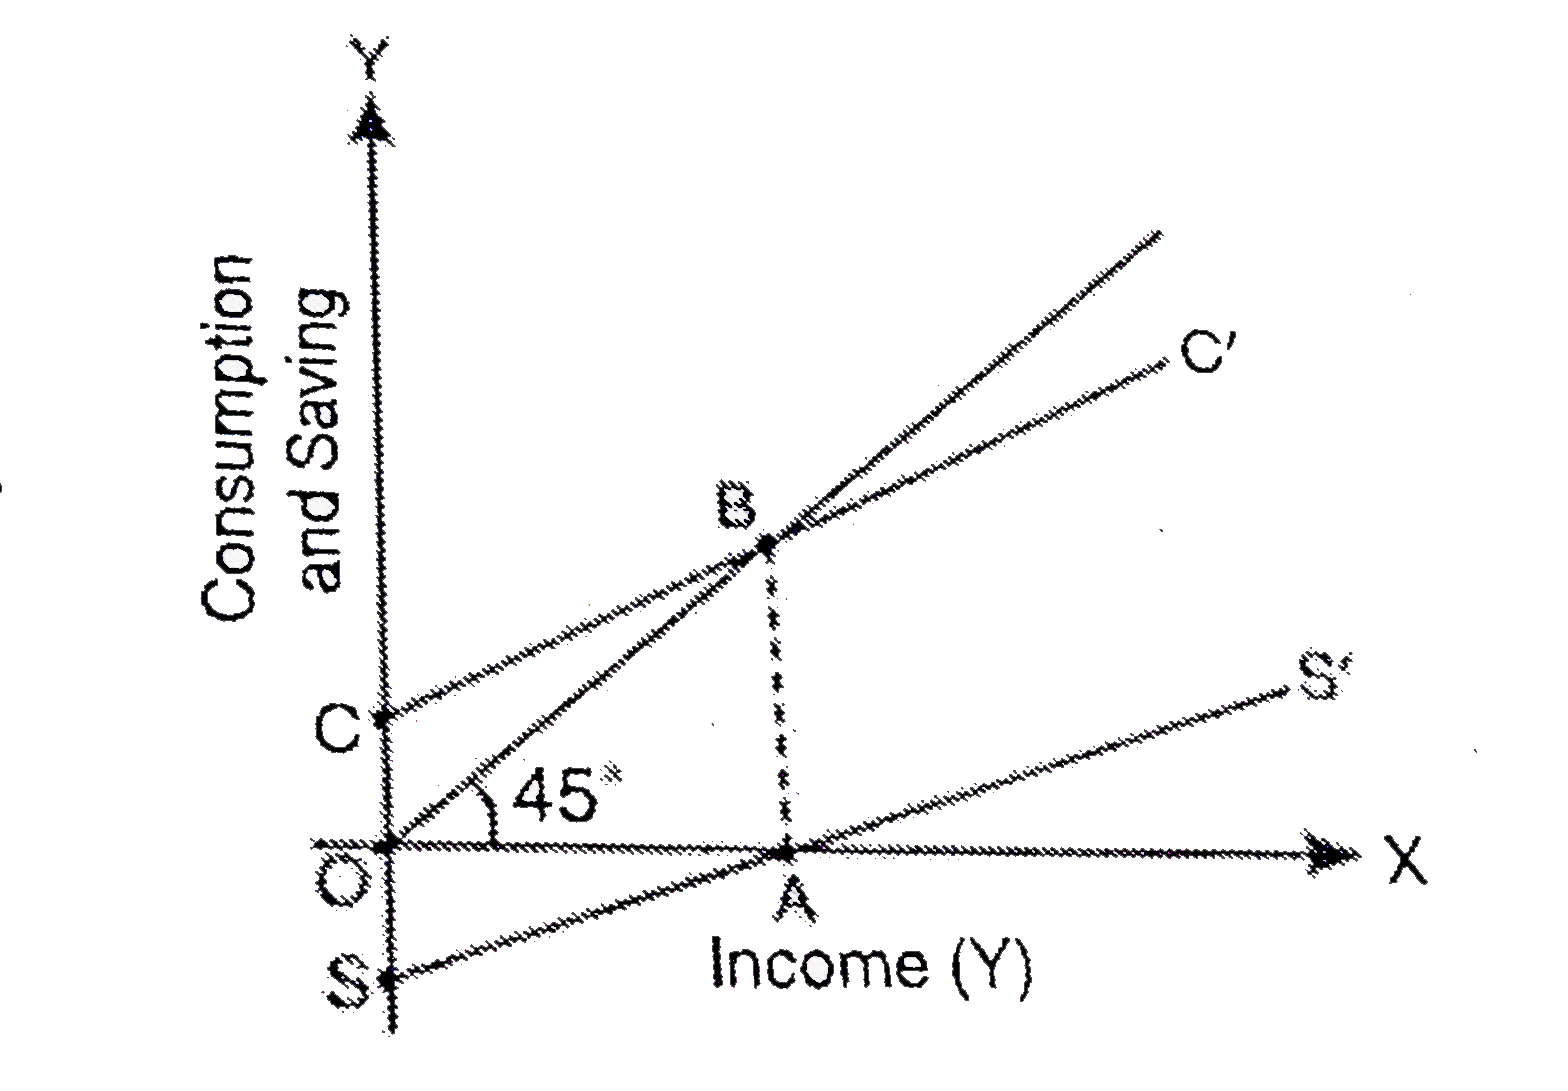 APoint BBPoint ACBoth (a) and (b)DNeither (a) nor (b)
 - Question 3 - Select One
In the following diagram of budget line, point ''D'' represents :
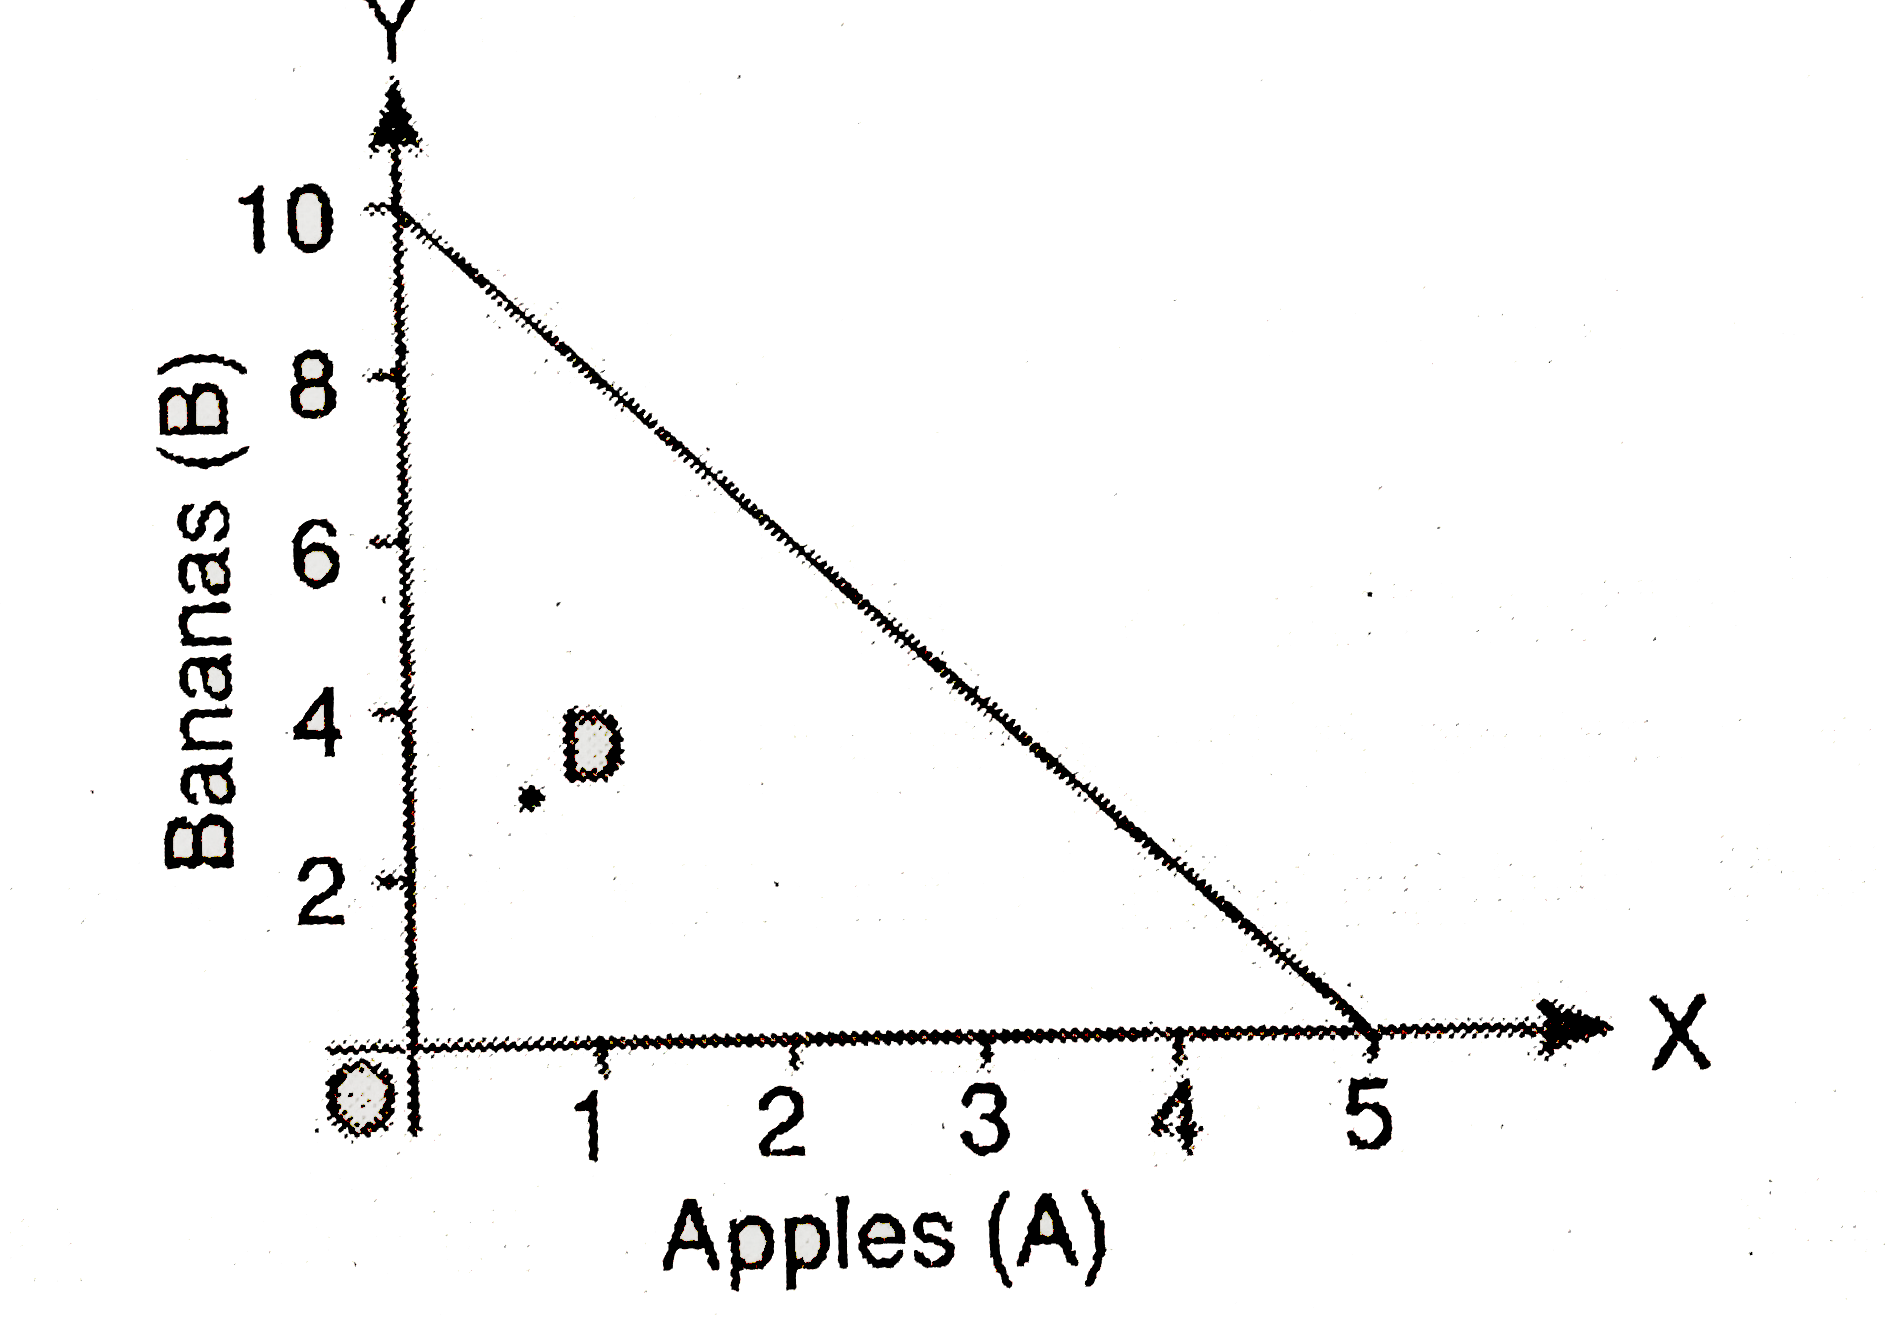 ABundle which cost equal to money income of consumerBBundle which cost less than money income of consumerCBundle which cost greater than money income of consumerDNone of these
Which of the following diagrams does not represent a streamline flow?
View SolutionThe voltage across a pure inductor is represented by the following diagram. Which one of the following diagrams will represent the current
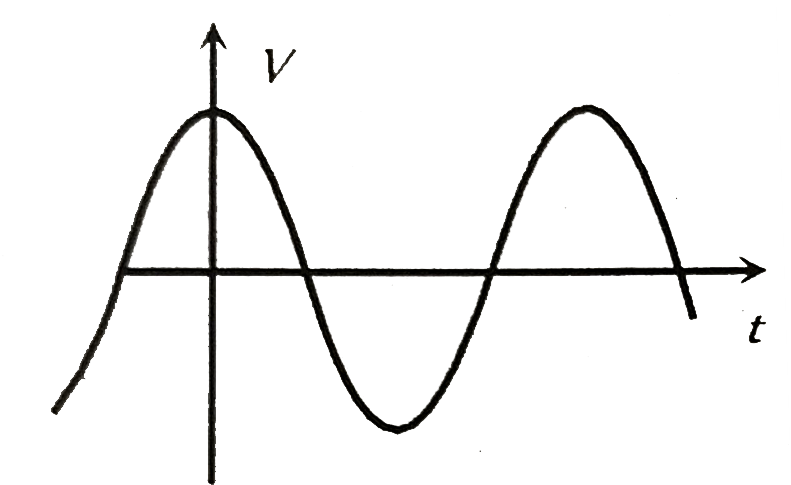 View Solution
What does the following diagram represents ?
 View Solution
Which of the following diagrams correctly represents the counter pattern ?
View SolutionWhich one of the following diagrams represents the placentation in Dianthus
View Solution


