An isolated non-conducting solid sphere of radius R is given an electric charge. The charge is uniformly distributed in the volume of sphere. The graph which shows the correct variation of magnitude of electric field with distance from the centre of the sphere is
Step by step video & image solution for An isolated non-conducting solid sphere of radius R is given an electric charge. The charge is uniformly distributed in the volume of sphere. The graph which shows the correct variation of magnitude of electric field with distance from the centre of the sphere is by Physics experts to help you in doubts & scoring excellent marks in Class 12 exams.
Updated on:21/07/2023Topper's Solved these Questions
- ELECTRIC CHARGES AND FIELDS BOOK - MODERN PUBLICATIONCHAPTER - ELECTRIC CHARGES AND FIELDS EXERCISE - Revision Exercises (Numerical Problems )
7 Videos
- ELECTRIC CHARGES AND FIELDS BOOK - MODERN PUBLICATIONCHAPTER - ELECTRIC CHARGES AND FIELDS EXERCISE - COMPETITION FILE ( Objective Question (A.MCQ) )
56 Videos
- ELECTRIC CHARGES AND FIELDS BOOK - MODERN PUBLICATIONCHAPTER - ELECTRIC CHARGES AND FIELDS EXERCISE - Revision Exercises (Short Answer )
38 Videos
- DUAL NATURE OF RADIATION AND MATTER BOOK - MODERN PUBLICATIONCHAPTER - DUAL NATURE OF RADIATION AND MATTER EXERCISE - CHAPTER PRACTICE TEST
15 Videos
- ELECTROMAGNETIC INDUCTIONBOOK - MODERN PUBLICATIONCHAPTER - ELECTROMAGNETIC INDUCTIONEXERCISE - CHAPTER PRACTICE TEST FOR BOARD EXAMINATION
14 Videos
Similar Questions
A non-conducting sphere of radius R is given a charge Q. Charge is uniformly distributed in its volume. The electric potential at centre and at the surface of sphere respectively are
View SolutionA non-conducting sphere of radius R is given a charge Q. Charge is uniformly distributed in its volume. The electric potential at centre and at the surface of sphere respectively are
View Solution
Knowledge Check
For a uniformly charged non conducting sphere of radius R which of following shows a correct graph between the electric field intensity and the distance from the centre of sphere –
A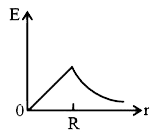 B
B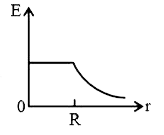 C
C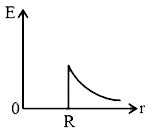 D
D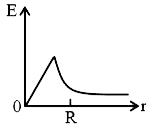
Which one of the following graphs represents the variation of electric field with distance r from the centre of a charged spherical conductor of radius R?
A B
B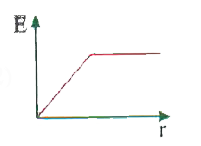 C
C D
D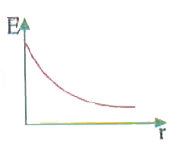
A conducting sphere of radius R is given a charge Q. The electric potential and the electric field at the centre of the sphere respectively are
AZero and Q4πε0R2BQ4πε0R2 and zeroCQ4πε0R and Q4πε0R2DBoth are zero
An isolated solid metallic sphere is given +Q charge. The charge will be distributed on the sphere
View SolutionA hollow charged sphere of radius R has a constant surface charge density o. Of the following graphs the one, which shows the variation of the electric field strength E with distance X from the centre of the sphere is (A) E I=R x (B) E 1
View SolutionAn isolated solid metal sphere of radius R is given an electric charge. The variation of the intensity of the electric field with the distance r from the centre of the sphere is best shown by
View SolutionFind out energy stored inside a solid non-conducting sphere of total charge Q and radius R. [Assume charge is uniformly distributed in its volume.]
View SolutionA hollow insulated conducting sphere of radius 2m, is given a charge of 5 μC. What will be the electric field at the centre of the sphere?
View Solution
