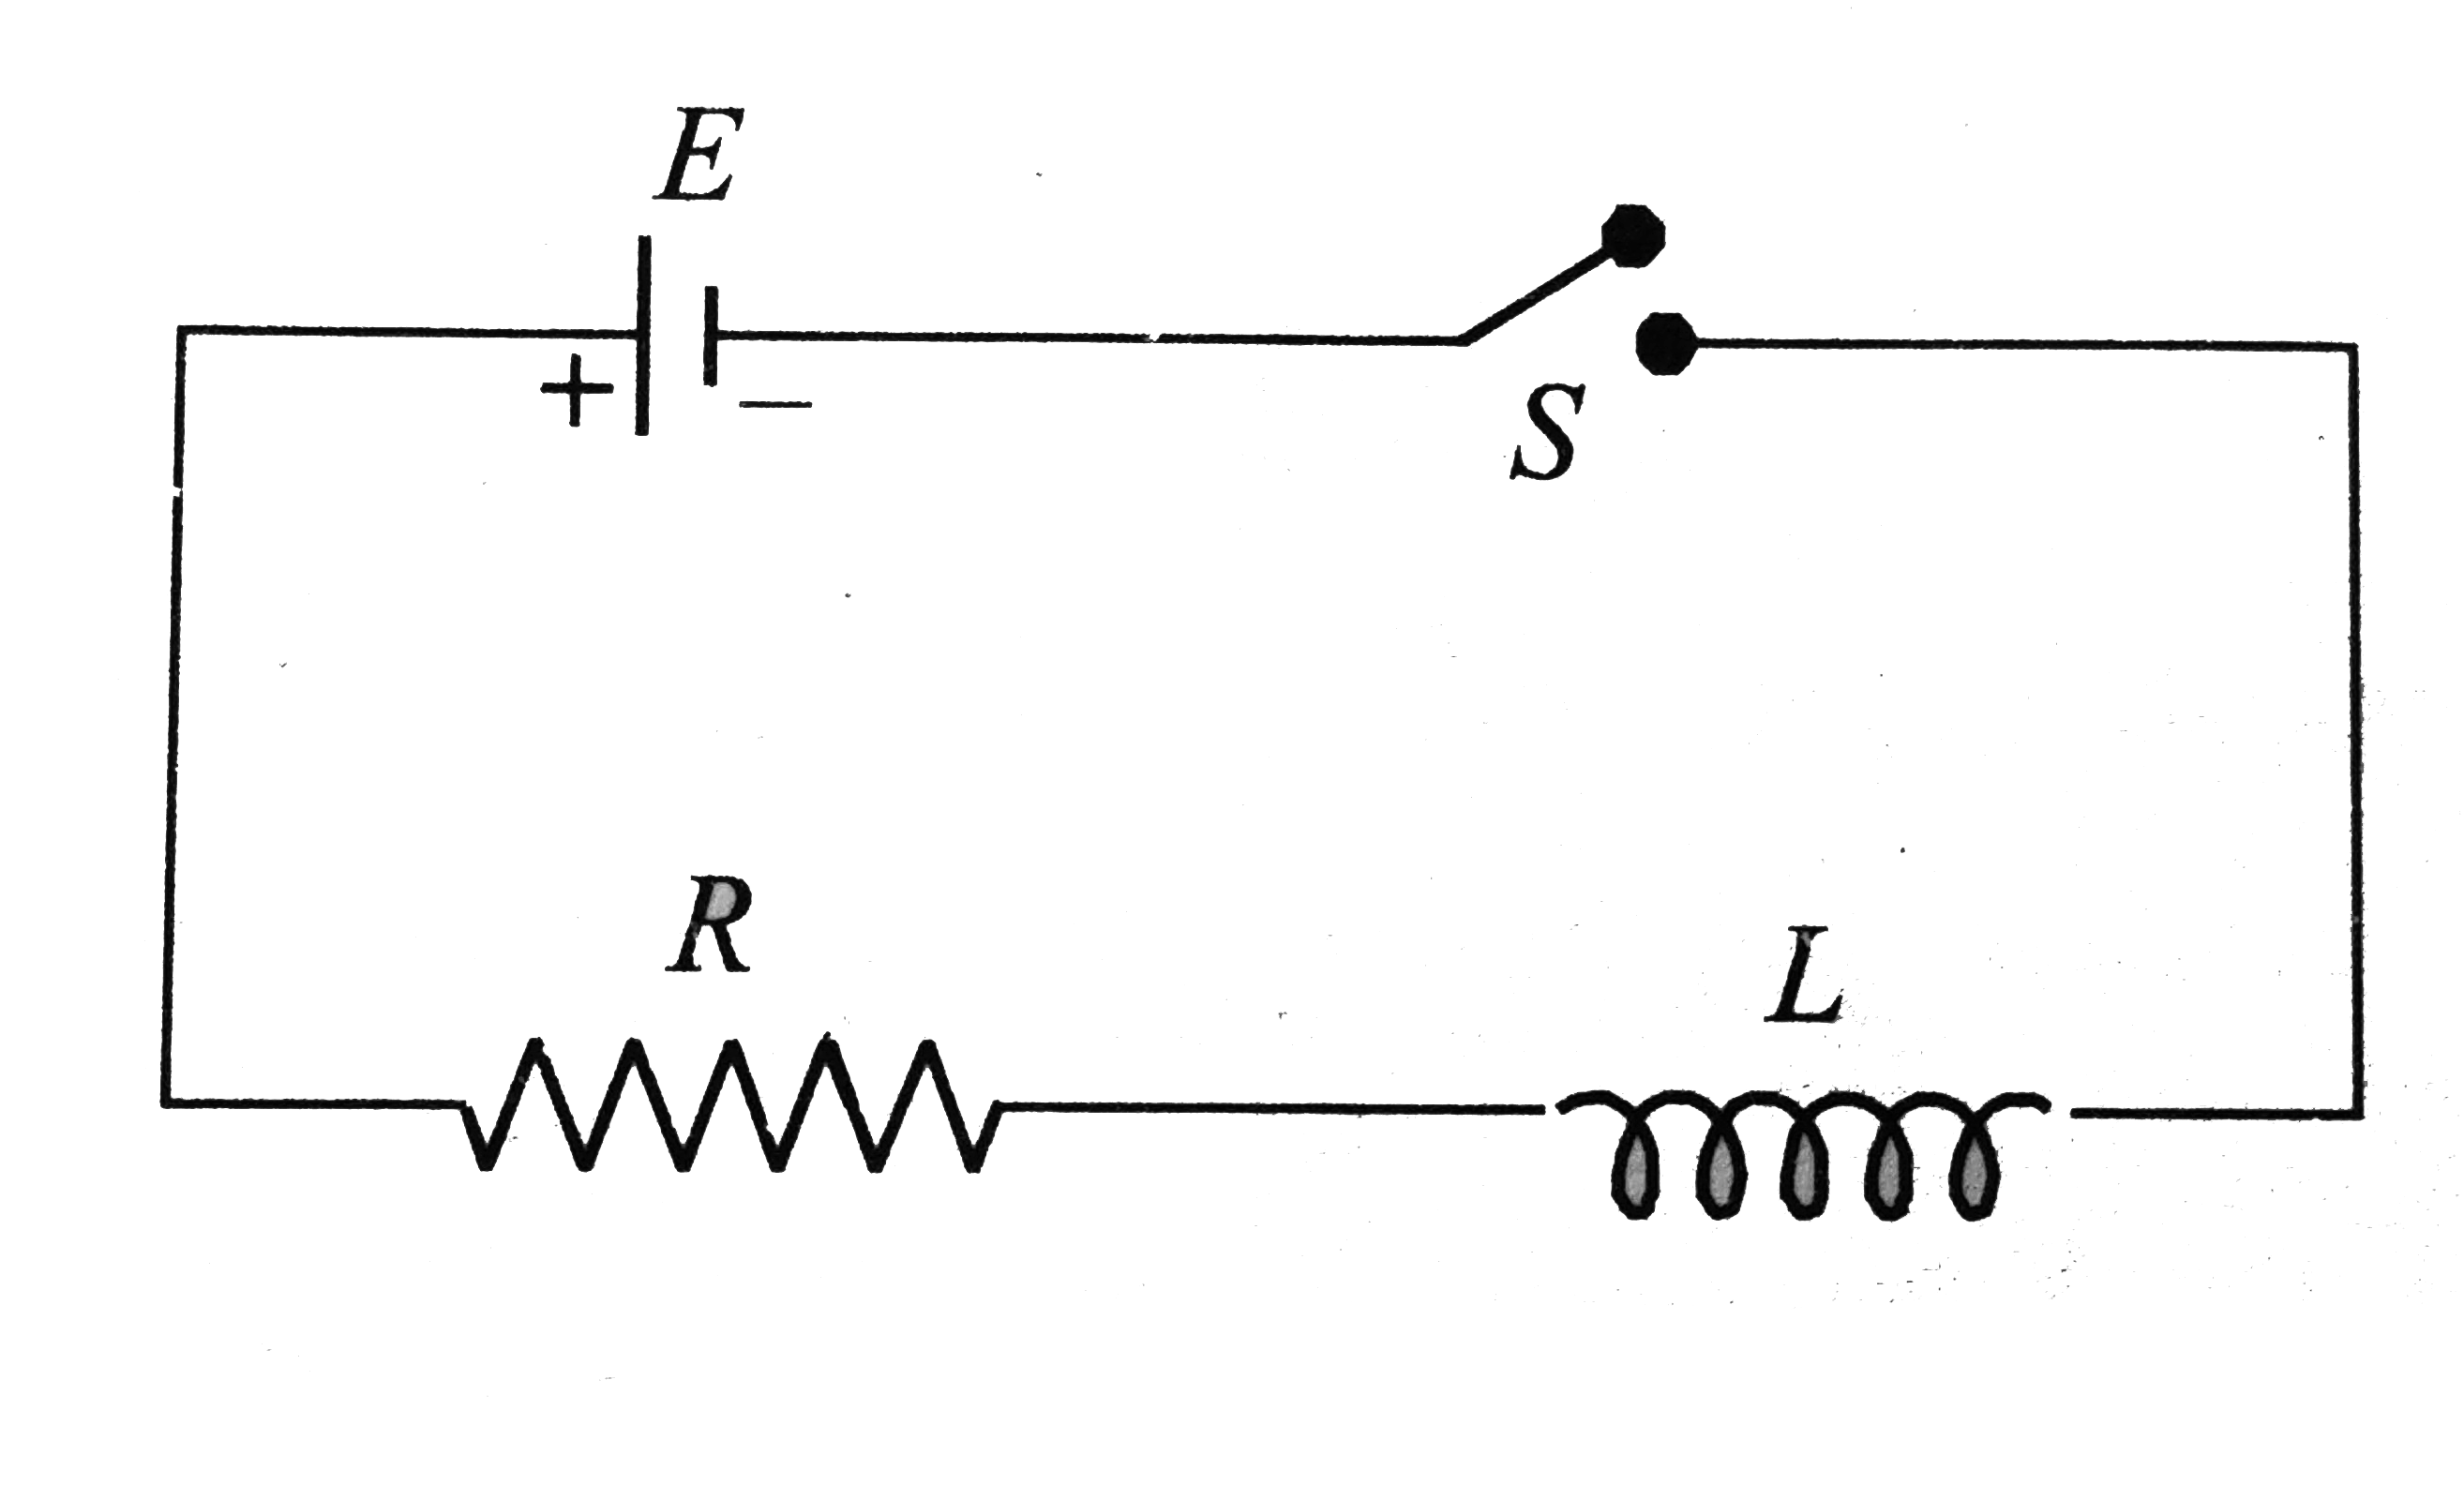
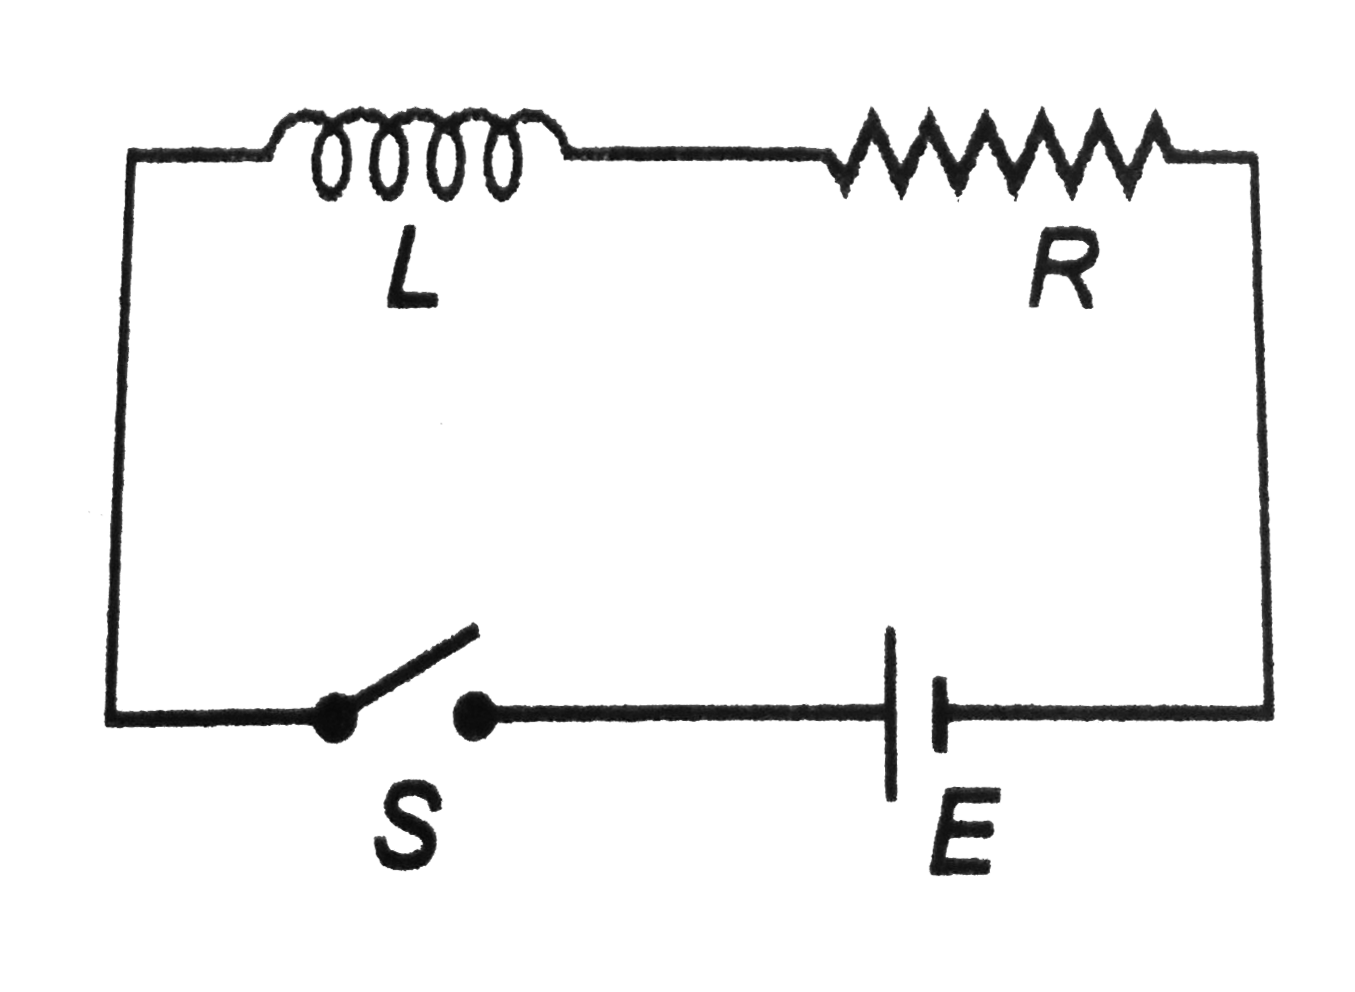
Here is one standard L-R circuit. And switch is closed at t = 0.

If E represents emf induced in inductor then which of the following graphs represente correct variation of induced emf and current flowing in the circuit.


The correct Answer is:B
When switch ia closed then variation of current with time can be written as follows:
i=E0R(1−e−t/(τ))
Emf induced in the inductor can be written as follows:
E=−Ldi/dt
E=LE0R1τe(−t)/(τ) Substituting τ=L/R we get the following:
E=E0e(−t)/(τ)
We can substitute e(−t)/(τ)=1−iRE0
E=E0(1−iRE0)
E=E0−iR
Topper's Solved these Questions
- BOOK - MODERN PUBLICATIONCHAPTER - ELECTROMAGNETIC INDUCTIONEXERCISE - COMPETITION FILE (MULTIPLE CHOICE QUESTIONS) (AIPMT/NEET & Other State Boards for Medical Entrance)8videos
ELECTROMAGNETIC INDUCTION
- BOOK - MODERN PUBLICATIONCHAPTER - ELECTROMAGNETIC INDUCTIONEXERCISE - COMPETITION FILE (MULTIPLE CHOICE QUESTIONS) (JEE (Main) & Other State Boards for Engineering Entrance)38videos
ELECTROMAGNETIC INDUCTION
- BOOK - MODERN PUBLICATIONCHAPTER - ELECTROMAGNETIC INDUCTIONEXERCISE - REVISION EXERCISE (Numerical Problems)16videos
ELECTROMAGNETIC INDUCTION
- BOOK - MODERN PUBLICATIONCHAPTER - ELECTRIC CHARGES AND FIELDS EXERCISE - Chapter Practice Test15videos
ELECTRIC CHARGES AND FIELDS
- BOOK - MODERN PUBLICATIONCHAPTER - ELECTROMAGNETIC WAVESEXERCISE - CHAPTER PRACTICE TEST14videos
ELECTROMAGNETIC WAVES
Similar Questions
Switch S of the circuit shows in Fig. is closed at t=0. If e denotes the induced emf in L and i the current flowing through the circuit at time t, then which of the following graphs correctly represents the variation of e with i?
 View Solution
In an L-R circuit connected to a battery of constant emf E, switch is closed at time t=0. If e denotes the induced emf across inductor and I the current in the circuit at any time t. Then which of the following graphs shown the variation of e with i?
View Solution
Knowledge Check
- Question 1 - Select One
The induced e.m.f in a circuit
ADecreases the magnetic flux through the circuitBincreases the magnetic flux through the circuitCMay increase or decrease the magnetic flux through the circuitDLeaves the magnetic flux through the circuit unchanged - Question 2 - Select One
Switch S of the circuit shows in Fig. is closed at t=0. If e denotes the induced emf in L and i the current flowing through the circuit at time t, then which of the following graphs correctly represents the variation of e with i?
 A
A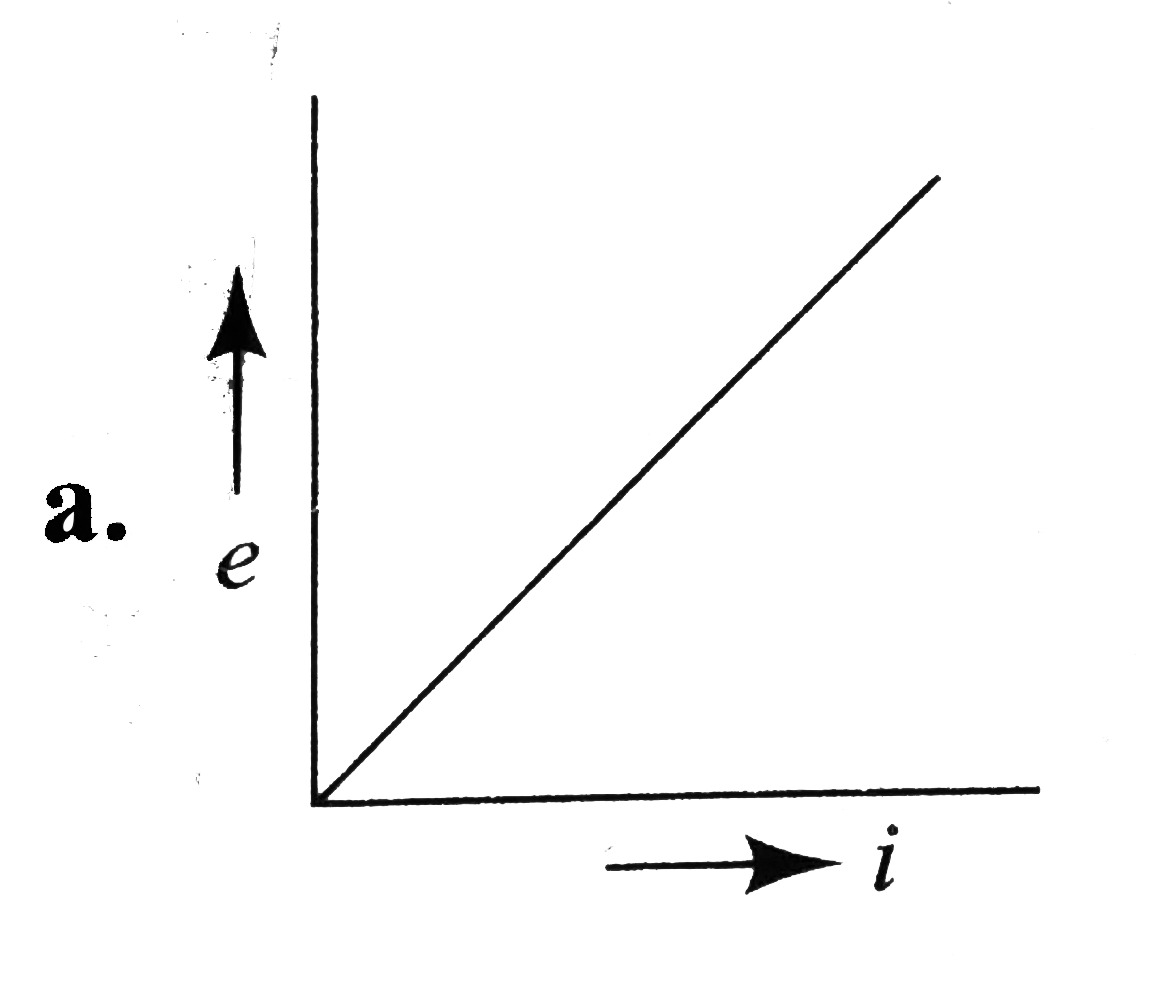 B
B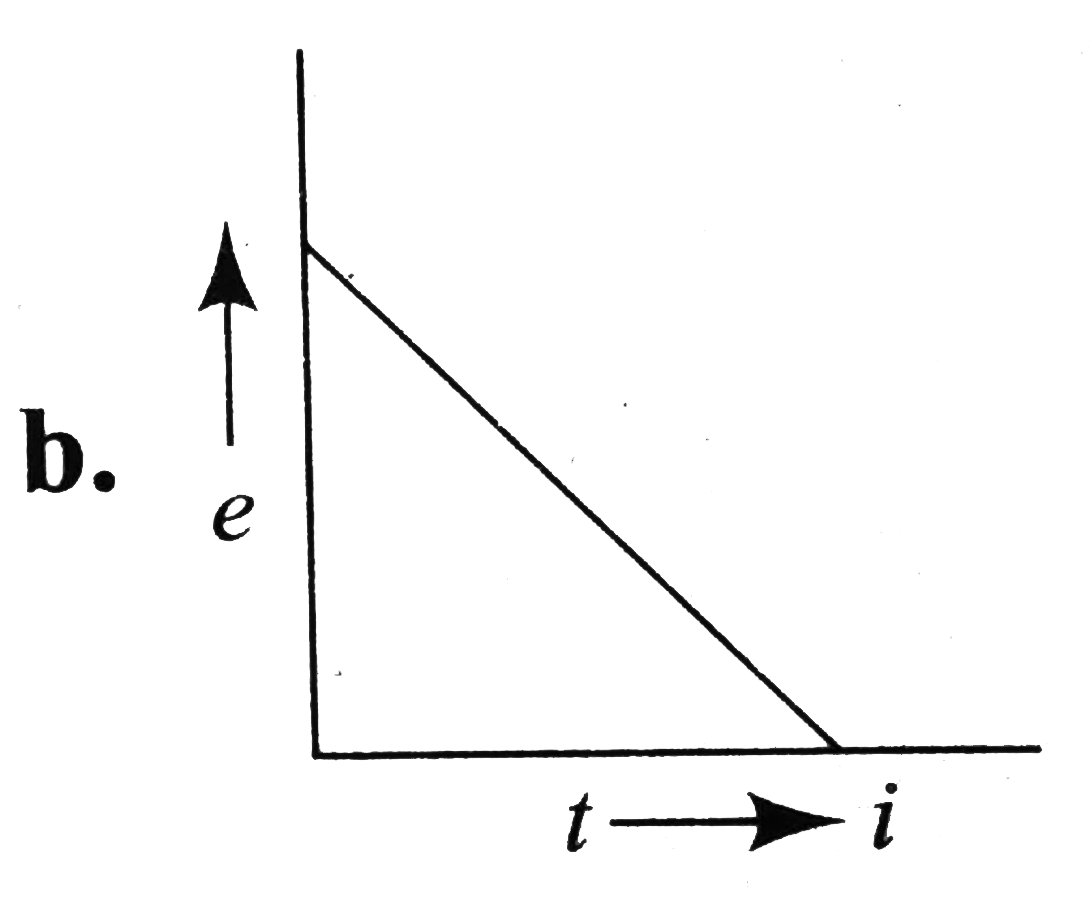 C
C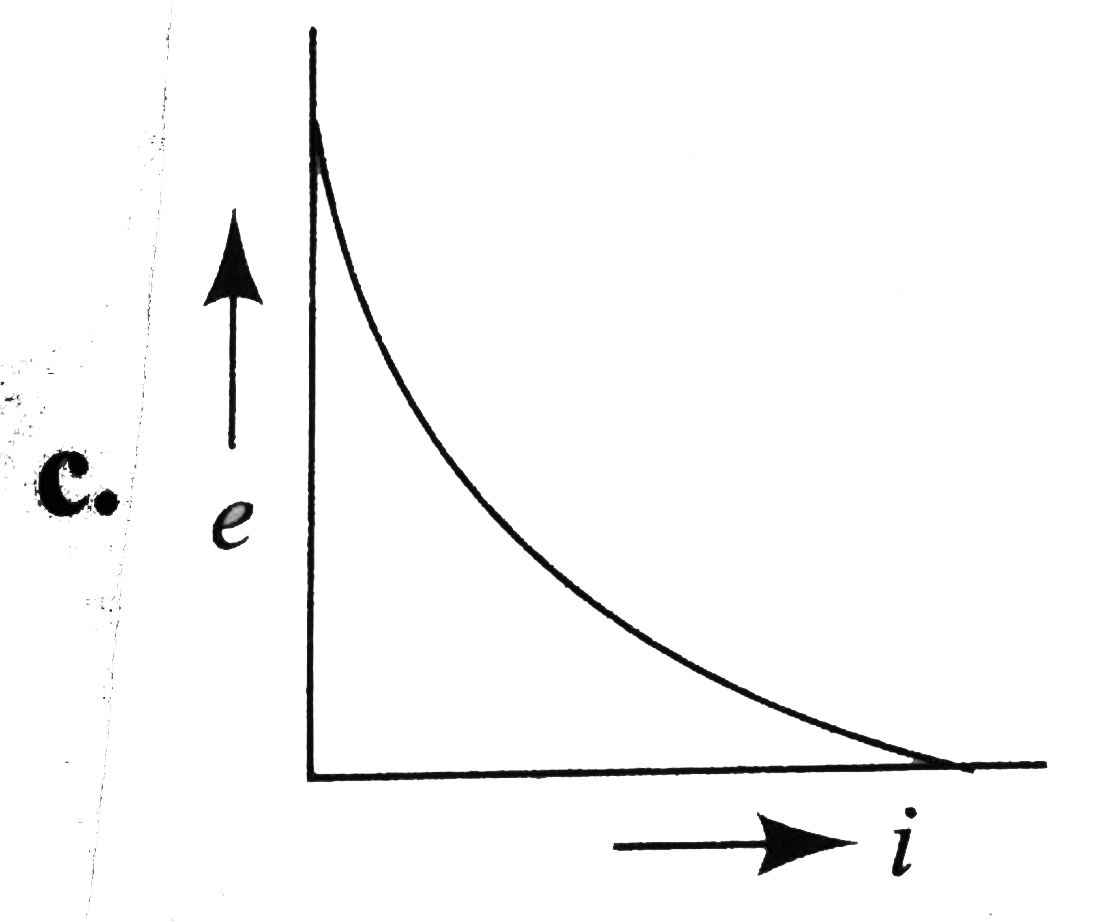 D
D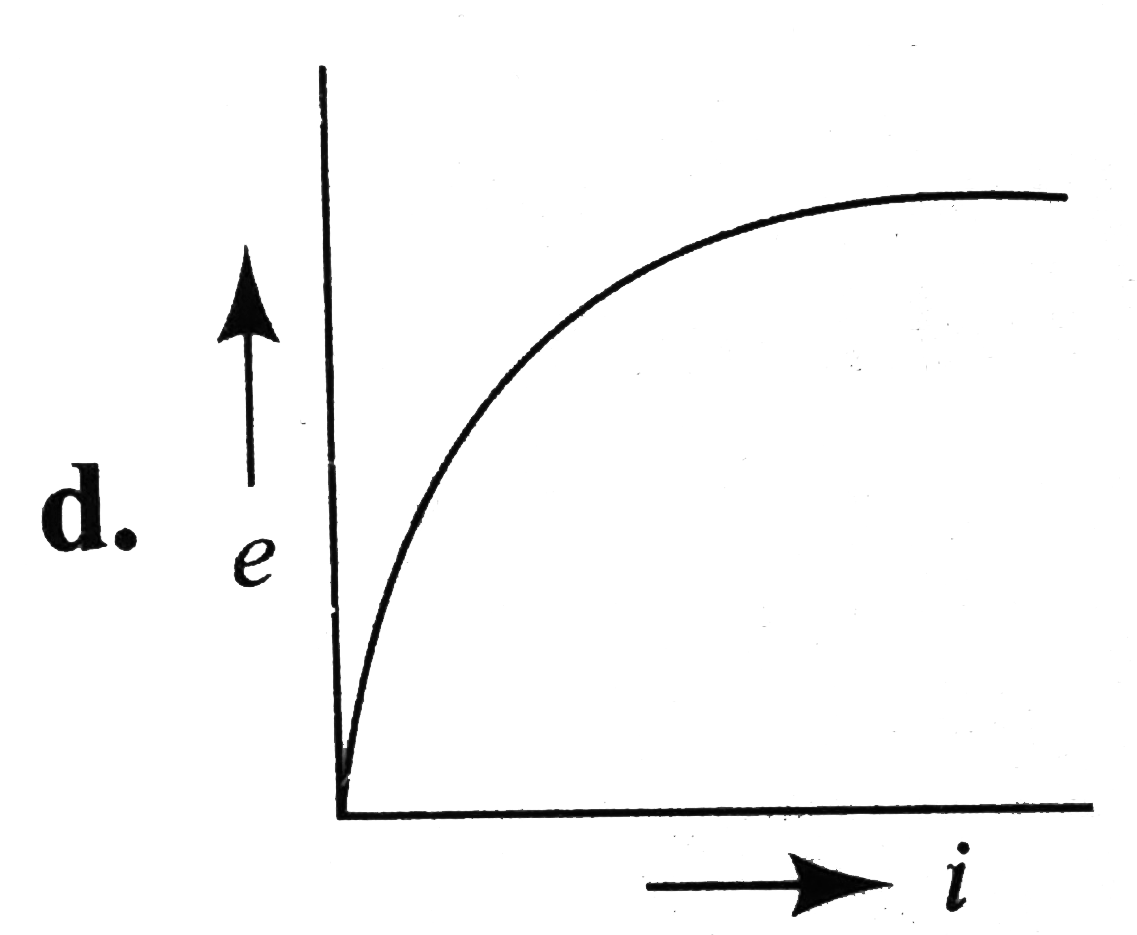
- Question 3 - Select One
In the circuit shown in figure, the switch S is closed at t=0. If VL is the voltge induced across the inductor and i is the instantaneous current, the correct variation of VL versus is given by
 A
A B
B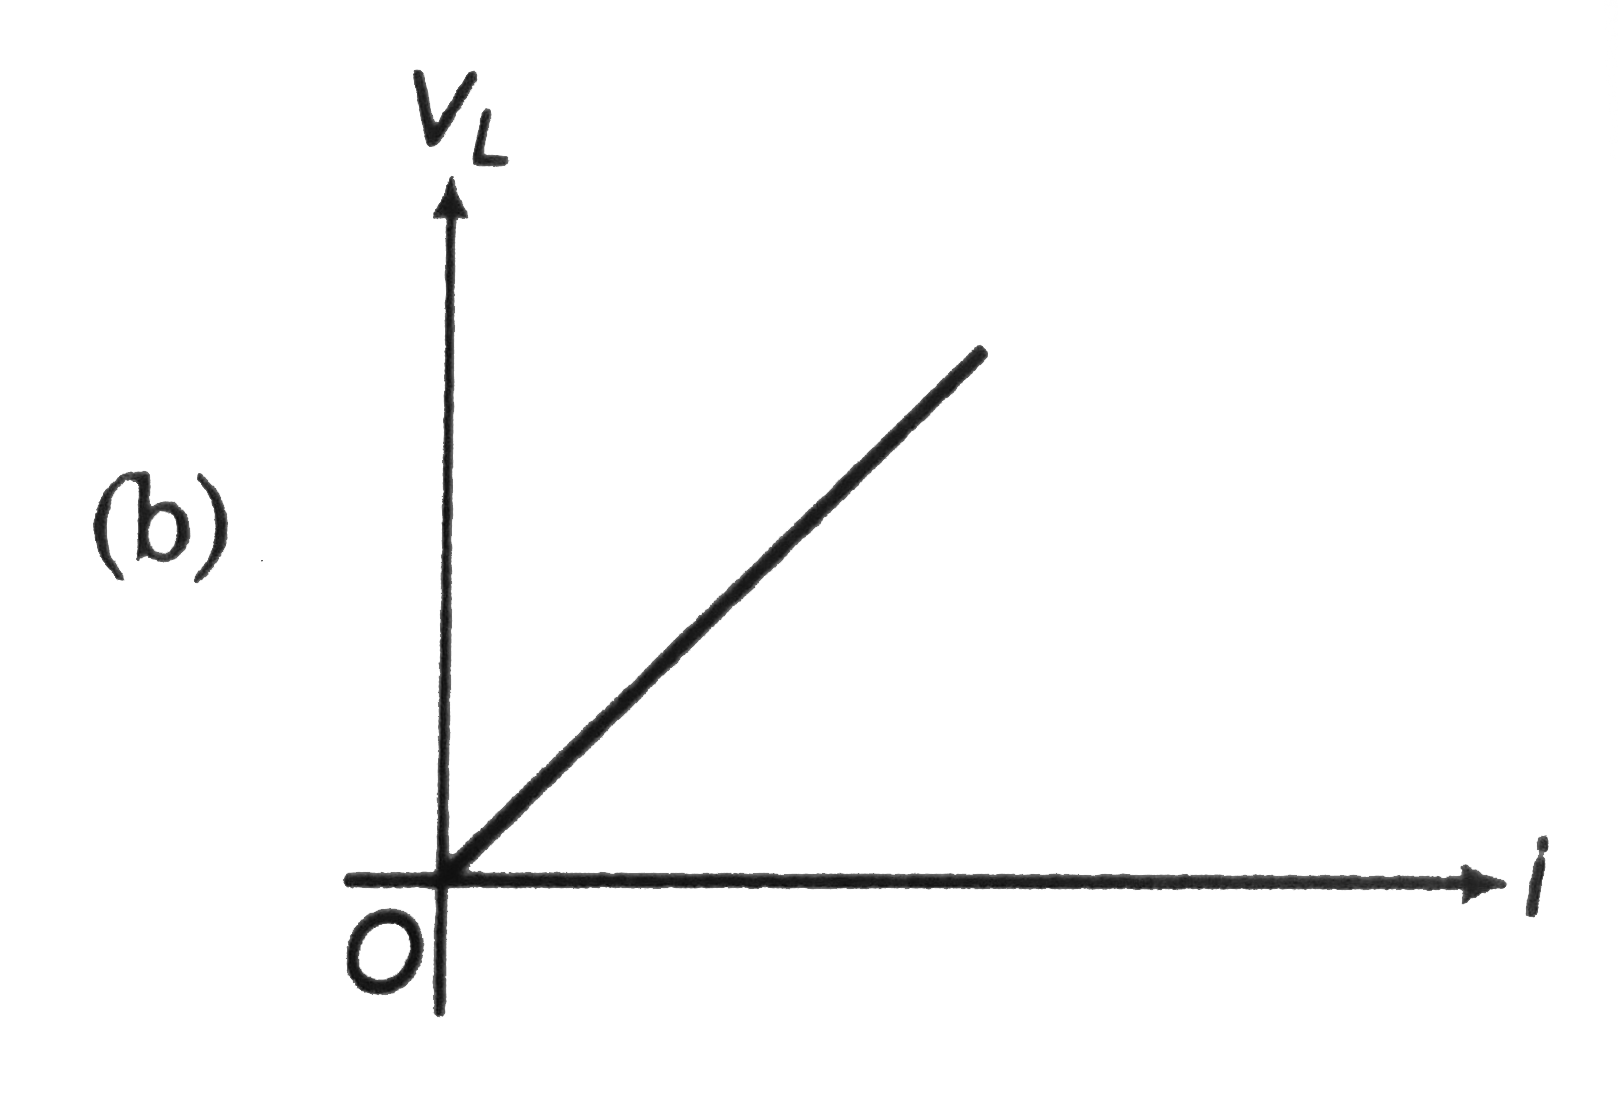 C
C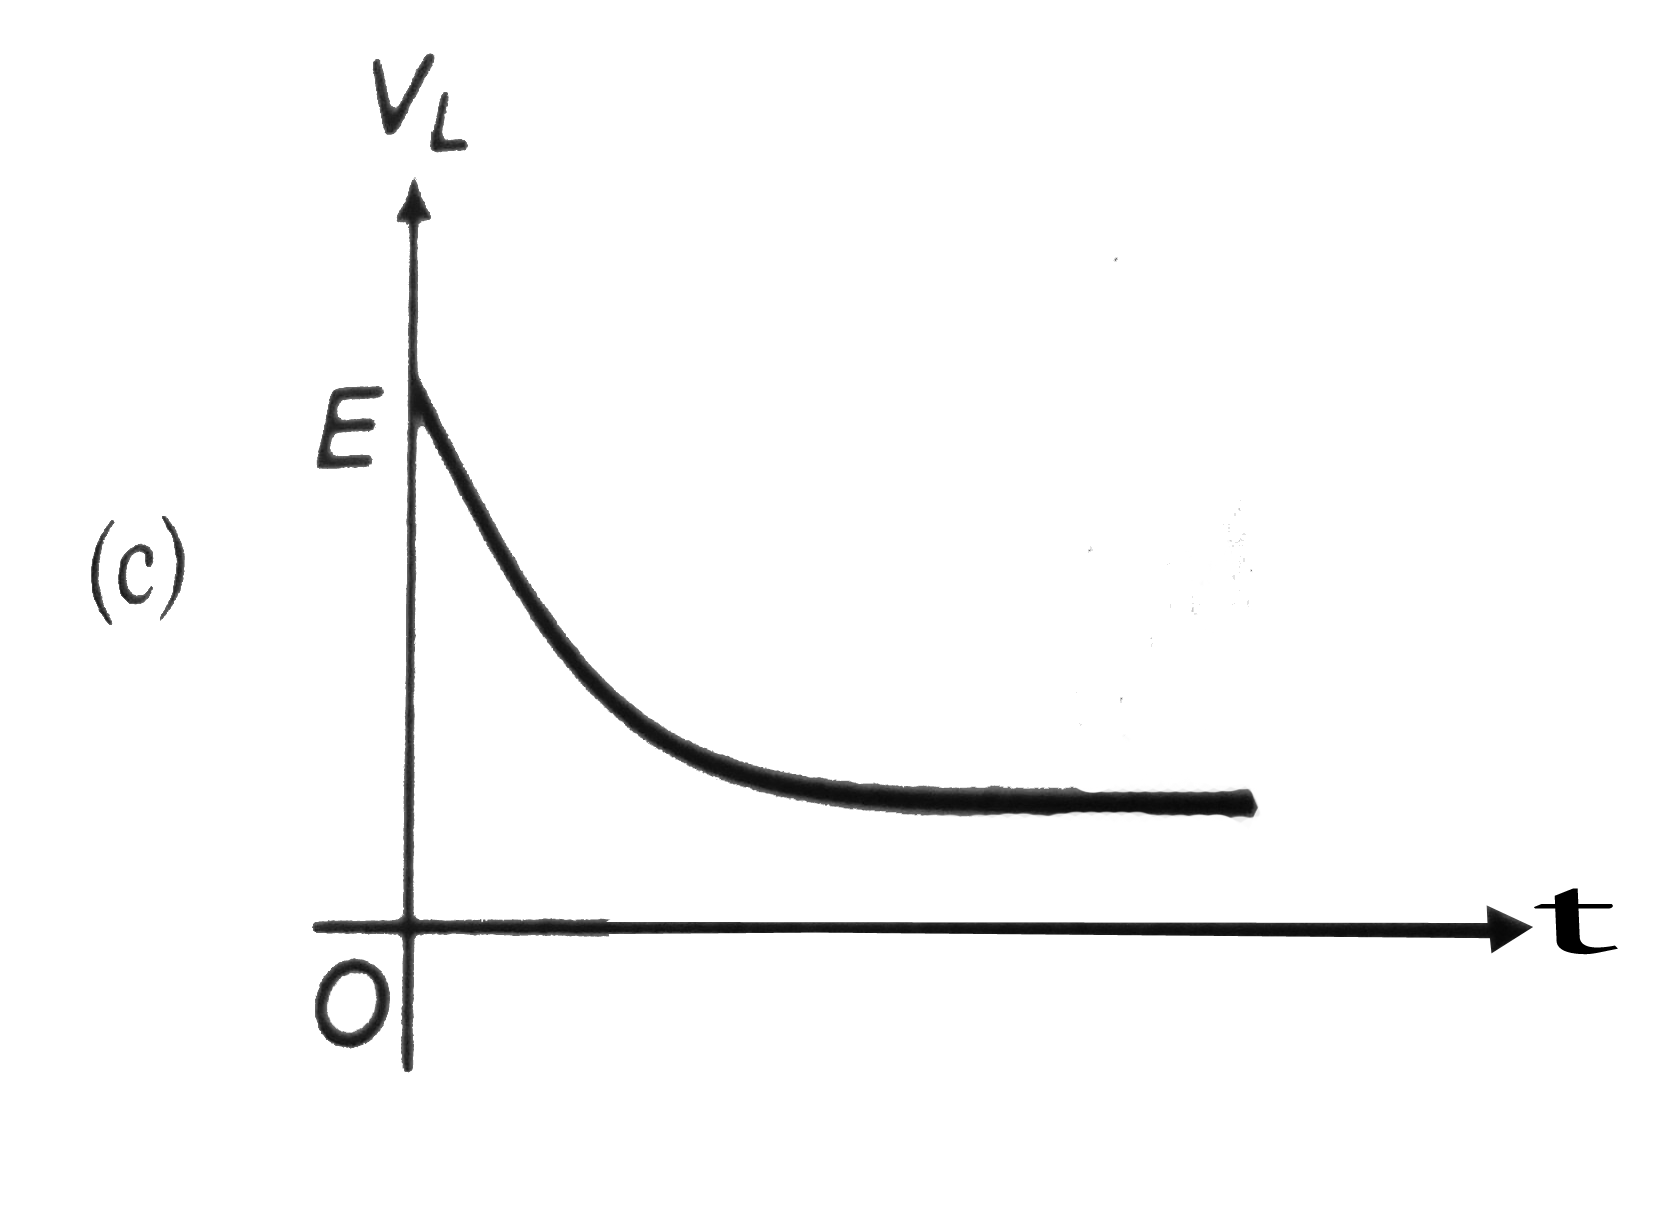 D
D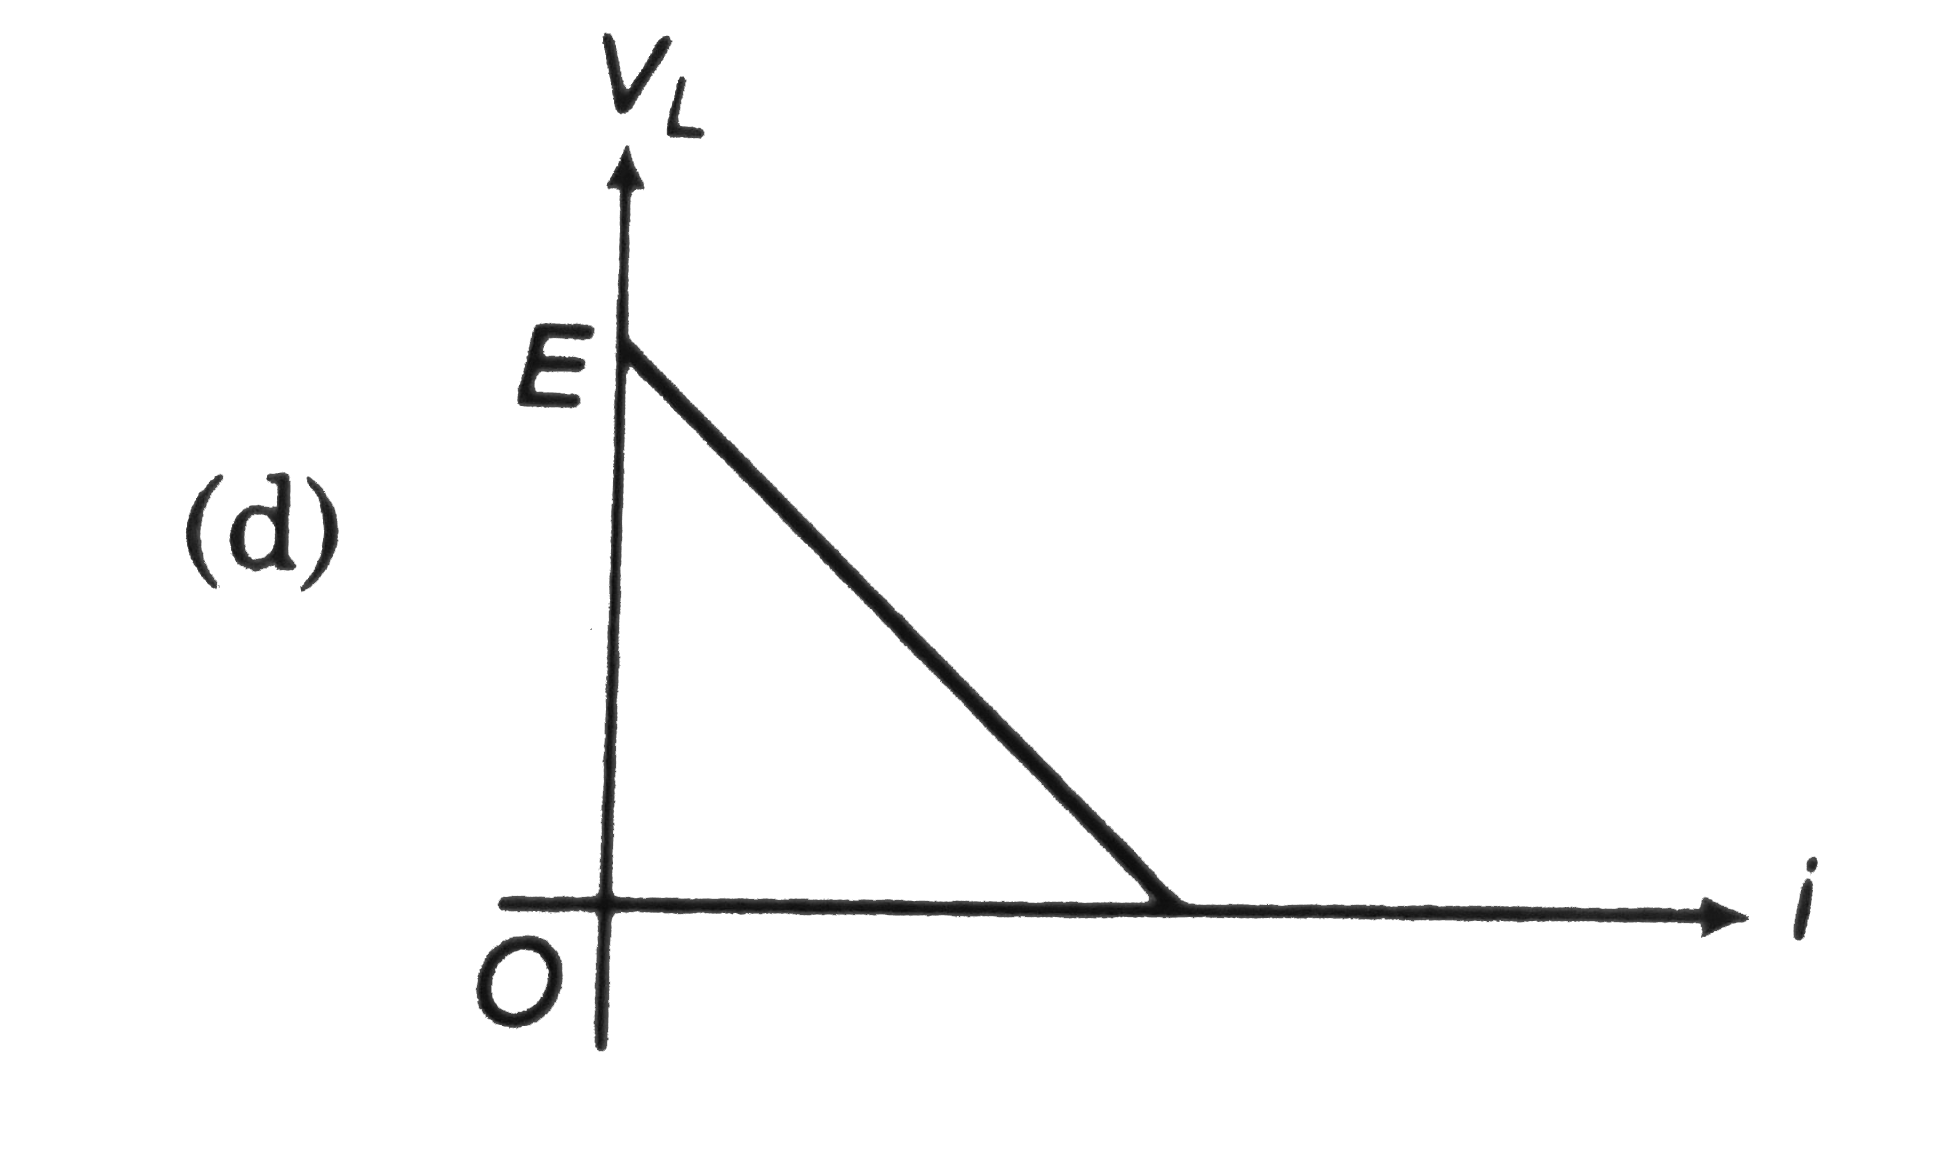
In the circuit shown in figure, the switch S is closed at t=0. If VL is the voltge induced across the inductor and i is the instantaneous current, the correct variation of VL versus is given by
 View Solution
Switch is closed at t=0 then the current in the circuit at t=L2R is
_PHY_E06_157_Q01.png) View Solution
View SolutionSwitch is closed at t=0 then the current in the circuit at t=L2R is
_PHY_E06_157_Q01.png) View Solution
View SolutionPlot a graph showing varñation of induced e.m.f. with the rate of change of current flowing through a coil.
View SolutionIn an L-R circuit connected to a battery of constant emf E, switched is closed at time t=0. If denotes the induced emf across inductor and I the current in the circuit at any time t. Then which of the following graphs shown the variation of e with i?
View Solution

