Draw a graph between potential energy of a pair of nucleons and separation between them. Also write its main features.
To solve the question of drawing a graph between the potential energy of a pair of nucleons and their separation, we will follow these steps:
Step 1: Understand the forces involved
Nucleons (protons and neutrons) experience two types of forces when they are close to each other:
- Electrostatic Force: This is a repulsive force that acts between protons due to their positive charge.
- Nuclear Force: This is an attractive force that acts between nucleons and is much stronger than the electrostatic force at short distances.
Step 2: Identify the behavior of potential energy with respect to separation
- At very short distances (when nucleons are extremely close), the repulsive electrostatic force dominates, leading to a high potential energy (positive value).
- As the nucleons move apart, the attractive nuclear force begins to dominate, causing the potential energy to decrease.
- There exists a point (denoted as R0) where the potential energy reaches a minimum value, indicating a stable configuration of nucleons.
- Beyond this point, as the nucleons are separated further, the potential energy starts to increase again, but at a much slower rate since the nuclear force is effective only at very short distances.
Step 3: Draw the graph
1. X-axis: Separation between nucleons (distance)
2. Y-axis: Potential Energy of the nucleons
- Start with a high positive value on the Y-axis when the separation is very small.
- As the separation increases, the potential energy decreases sharply until it reaches a minimum at R0.
- After reaching the minimum, the potential energy gradually increases as the separation continues to increase.
Step 4: Label the graph
- Mark the point of minimum potential energy as R0.
- Indicate the regions where repulsion dominates (high potential energy) and where attraction dominates (low potential energy).
Step 5: Write the main features of the graph
1. High Potential Energy at Short Distances: At very short separations, nucleons experience strong repulsion due to electrostatic forces.
2. Minimum Potential Energy: At the separation R0, the attractive nuclear force balances the repulsive electrostatic force, resulting in a stable configuration.
3. Increasing Potential Energy at Large Distances: Beyond R0, potential energy increases slowly as the nuclear force becomes negligible and the nucleons behave more like point charges.
Final Graph Representation
- The graph will show a curve that starts high, decreases to a minimum, and then increases again, resembling a "U" shape.
Nucleons (protons and neutrons) experience two types of forces when they are close to each other:
- Electrostatic Force: This is a repulsive force that acts between protons due to their positive charge.
- Nuclear Force: This is an attractive force that acts between nucleons and is much stronger than the electrostatic force at short distances.
- At very short distances (when nucleons are extremely close), the repulsive electrostatic force dominates, leading to a high potential energy (positive value).
- As the nucleons move apart, the attractive nuclear force begins to dominate, causing the potential energy to decrease.
- There exists a point (denoted as R0) where the potential energy reaches a minimum value, indicating a stable configuration of nucleons.
- Beyond this point, as the nucleons are separated further, the potential energy starts to increase again, but at a much slower rate since the nuclear force is effective only at very short distances.
1. X-axis: Separation between nucleons (distance)
2. Y-axis: Potential Energy of the nucleons
- As the separation increases, the potential energy decreases sharply until it reaches a minimum at R0.
- After reaching the minimum, the potential energy gradually increases as the separation continues to increase.
- Mark the point of minimum potential energy as R0.
- Indicate the regions where repulsion dominates (high potential energy) and where attraction dominates (low potential energy).
1. High Potential Energy at Short Distances: At very short separations, nucleons experience strong repulsion due to electrostatic forces.
2. Minimum Potential Energy: At the separation R0, the attractive nuclear force balances the repulsive electrostatic force, resulting in a stable configuration.
3. Increasing Potential Energy at Large Distances: Beyond R0, potential energy increases slowly as the nuclear force becomes negligible and the nucleons behave more like point charges.
- The graph will show a curve that starts high, decreases to a minimum, and then increases again, resembling a "U" shape.
Topper's Solved these Questions
- NUCLEIBOOK - MODERN PUBLICATIONCHAPTER - NUCLEIEXERCISE - REVISION EXERCISES (LONG ANSWER QUESTIONS)
7 Videos
- NUCLEIBOOK - MODERN PUBLICATIONCHAPTER - NUCLEIEXERCISE - REVISION EXERCISES (NUMERICAL PROBLEMS)
18 Videos
- NUCLEIBOOK - MODERN PUBLICATIONCHAPTER - NUCLEIEXERCISE - REVISION EXERCISES (FILL IN THE BLANKS)
10 Videos
- MOVING CHARGES AND MAGNETISMBOOK - MODERN PUBLICATIONCHAPTER - MOVING CHARGES AND MAGNETISMEXERCISE - CHAPTER PRACTICE TEST
13 Videos
- RAY OPTICS AND OPTICAL INSTRUMENTSBOOK - MODERN PUBLICATIONCHAPTER - RAY OPTICS AND OPTICAL INSTRUMENTSEXERCISE - CHAPTER PRACTICE TEST
14 Videos
Similar Questions
(a) The density of the nuclear matter is tremendously larger than the physical density of the material. Explain.
(b) The nuclear forces are not coulomb forces between nucleons. Explain.
(c) Draw a plot of the potential energy between a pair of nucleons as a function of distance between them inside a nucleus.
View SolutionDraw a plot of potential energy of a pair of nucleons as a function of their separation . Write two important conclusions which you can draw regarding the nature of nuclear forces .
View Solution
Knowledge Check
Which of the graph between potential energy and time is correct ?
AABBCEDFPotential Energy U(x) and associated force F(x) bears the relation F(x)=−ddxU(x).
Dependence of potential energy of a two−particle system separation x between them is shown in the following figure.
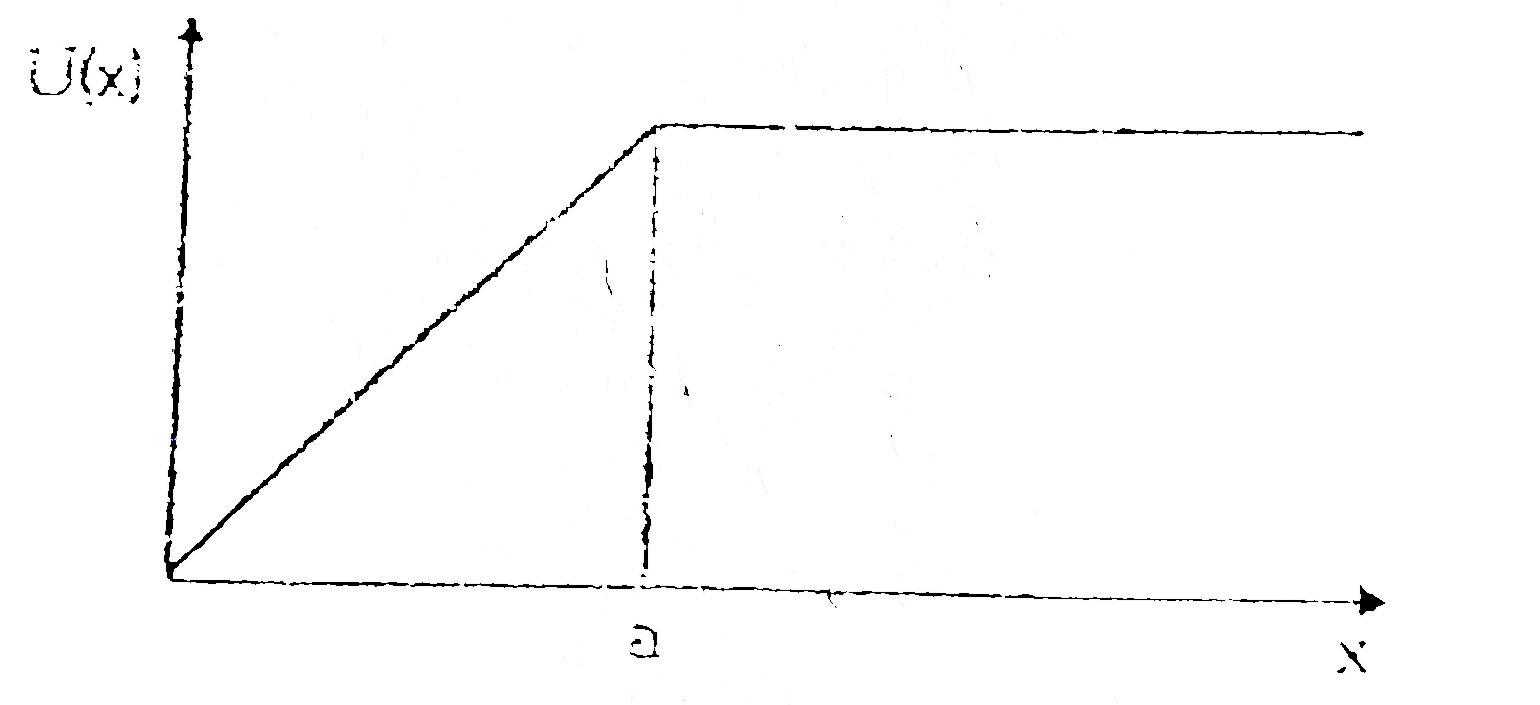
Which of the following graphs shows correct variation in assoicated force F(x) with x?A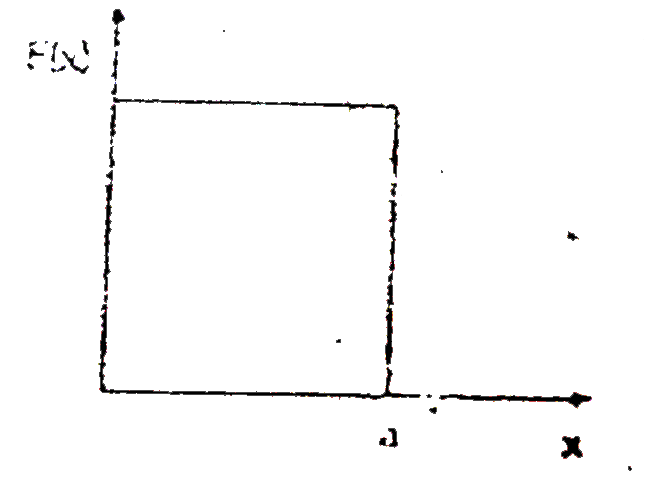 B
B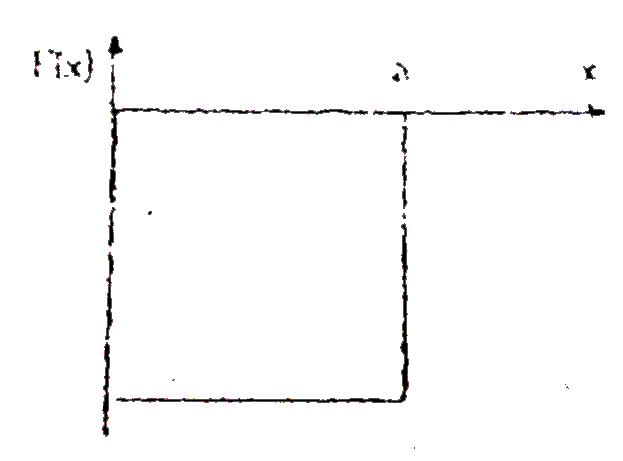 C
C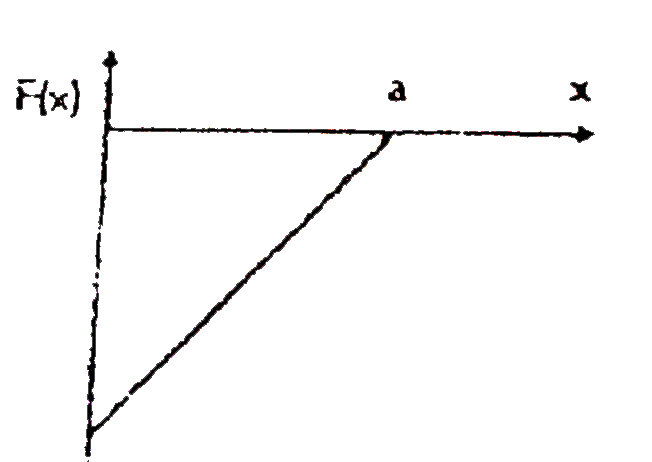 D
D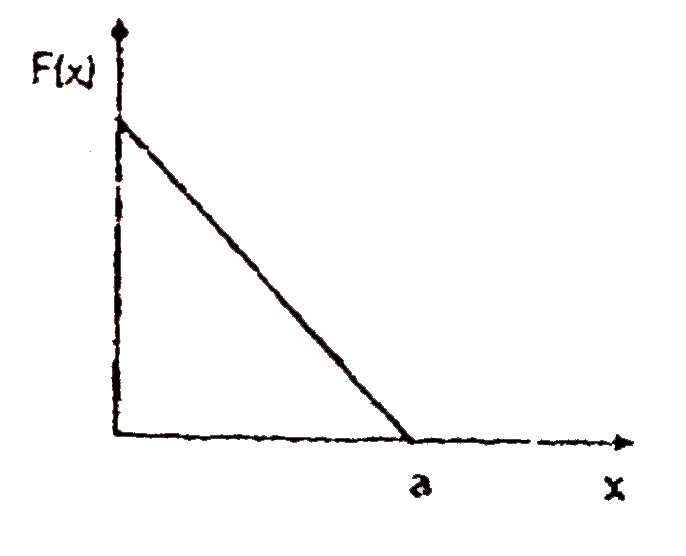
Draw a plot of potential energy of a pair of nucleons as a function of their separation. Write two important conclusions which you can draw regarding the nature of nuclear forces.
View SolutionDraw a plot of potential energy of a pair of nucleons as a function of their separation. What is the significance of negative potential energy in the graph drawn ?
View Solution(a) Draw a plot showing the variation of potential energy of a pair of nucleons as a function of their separation . Mark the regions where the nuclear force is :
(i) attractive and (ii) repulsive.
(b) In the nuclear reaction
n+235U→92aXe+54 94Sr+2nb determine the values of a and b .
View Solution(a) Draw a plot showing the variation of potential energy of a pair of nucleons as a function of their separation. Mark the regions where the nuclear force is (i) attractive, and (ii) repulsive.
(b) In the nuclear reaction
n+ 23592U→ a54Xe+ 97bSr+2n determine the values of ‘a’ and ‘b’.
View Solution(a) In a nuclear reaction 32He+32He→42He+11H+11H+12.86 MeV, though the number of nucleons is conserved on both sides of the reaction, yet the energy is released. How? Explain.
(b) Draw a plot of potential energy between a pair of nucleons as a function of their separation. Mark the regions where potential energy is (i) positive and (ii) negative.
View Solution(a) Draw a plot showing the variation of potential energy of a pair of nucleons as a function of their separation . Mark the regions where the nuclear force is :
(i) attractive and (ii) repulsive.
(b) In the nuclear reaction
n+235U→92aXe+54 94Sr+2nb determine the values of a and b .
View Solution
