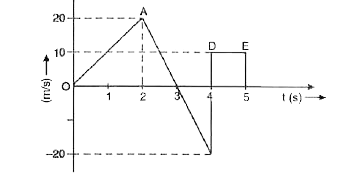
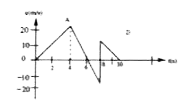
The velocity time graph of a body moving along a straight line is shown in Fig. The acceleration of the body during OA will be:
 Solution in Kannada
Zero
20 m/s2
10 m/s2
5 m/s2
The correct Answer is:c
The acceleration during OA =slope of graph
=202=10m/s2
Topper's Solved these Questions
- BOOK - MODERN PUBLICATIONCHAPTER - DESCRIPTION OF MOTION IN ONE DIMENSION EXERCISE - MULTIPLE CHOICE QUESTION (LEVEL-II)54videos
DESCRIPTION OF MOTION IN ONE DIMENSION
- BOOK - MODERN PUBLICATIONCHAPTER - DESCRIPTION OF MOTION IN ONE DIMENSION EXERCISE - Recent Competitive Question12videos
DESCRIPTION OF MOTION IN ONE DIMENSION
- BOOK - MODERN PUBLICATIONCHAPTER - CURRENT ELECTRICITYEXERCISE - RECENT COMPETITIVE QUESTIONS32videos
CURRENT ELECTRICITY
- BOOK - MODERN PUBLICATIONCHAPTER - DESCRIPTION OF MOTION IN TWO AND THREE DIMENSIONEXERCISE - Revision TEST36videos
DESCRIPTION OF MOTION IN TWO AND THREE DIMENSION
Similar Questions
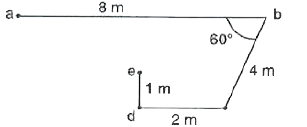
A man moves along the path abode as shown in the Fig. What is his displacement from the point of start?
 03:11View Solution
A train is moving slowly on a straight track with a constant speed of 2 m s−1 . A passengers in the train starts walking at a stready speed of 2 m s−1 to the back of the train in the opposite direction of the motion of the train. So to an observer standing on the platform directly in front of that passenger, the velocity of the passenger appears to be
02:21View SolutionA battery of emf E has an internal resistance r. A variable resistance R is connected to the terminals of the battery. A current i is drawn from the battery. V is the terminal potential difference. If R alone is gradually reduced to zero, which of the following best describes i and V?
01:49View SolutionThe torque of a force →F=−3ˆi+ˆj+5ˆk acting at a point is →τ. If the position vector of the point vector of the point is 7ˆi+3ˆj+ˆk, then →τ is :
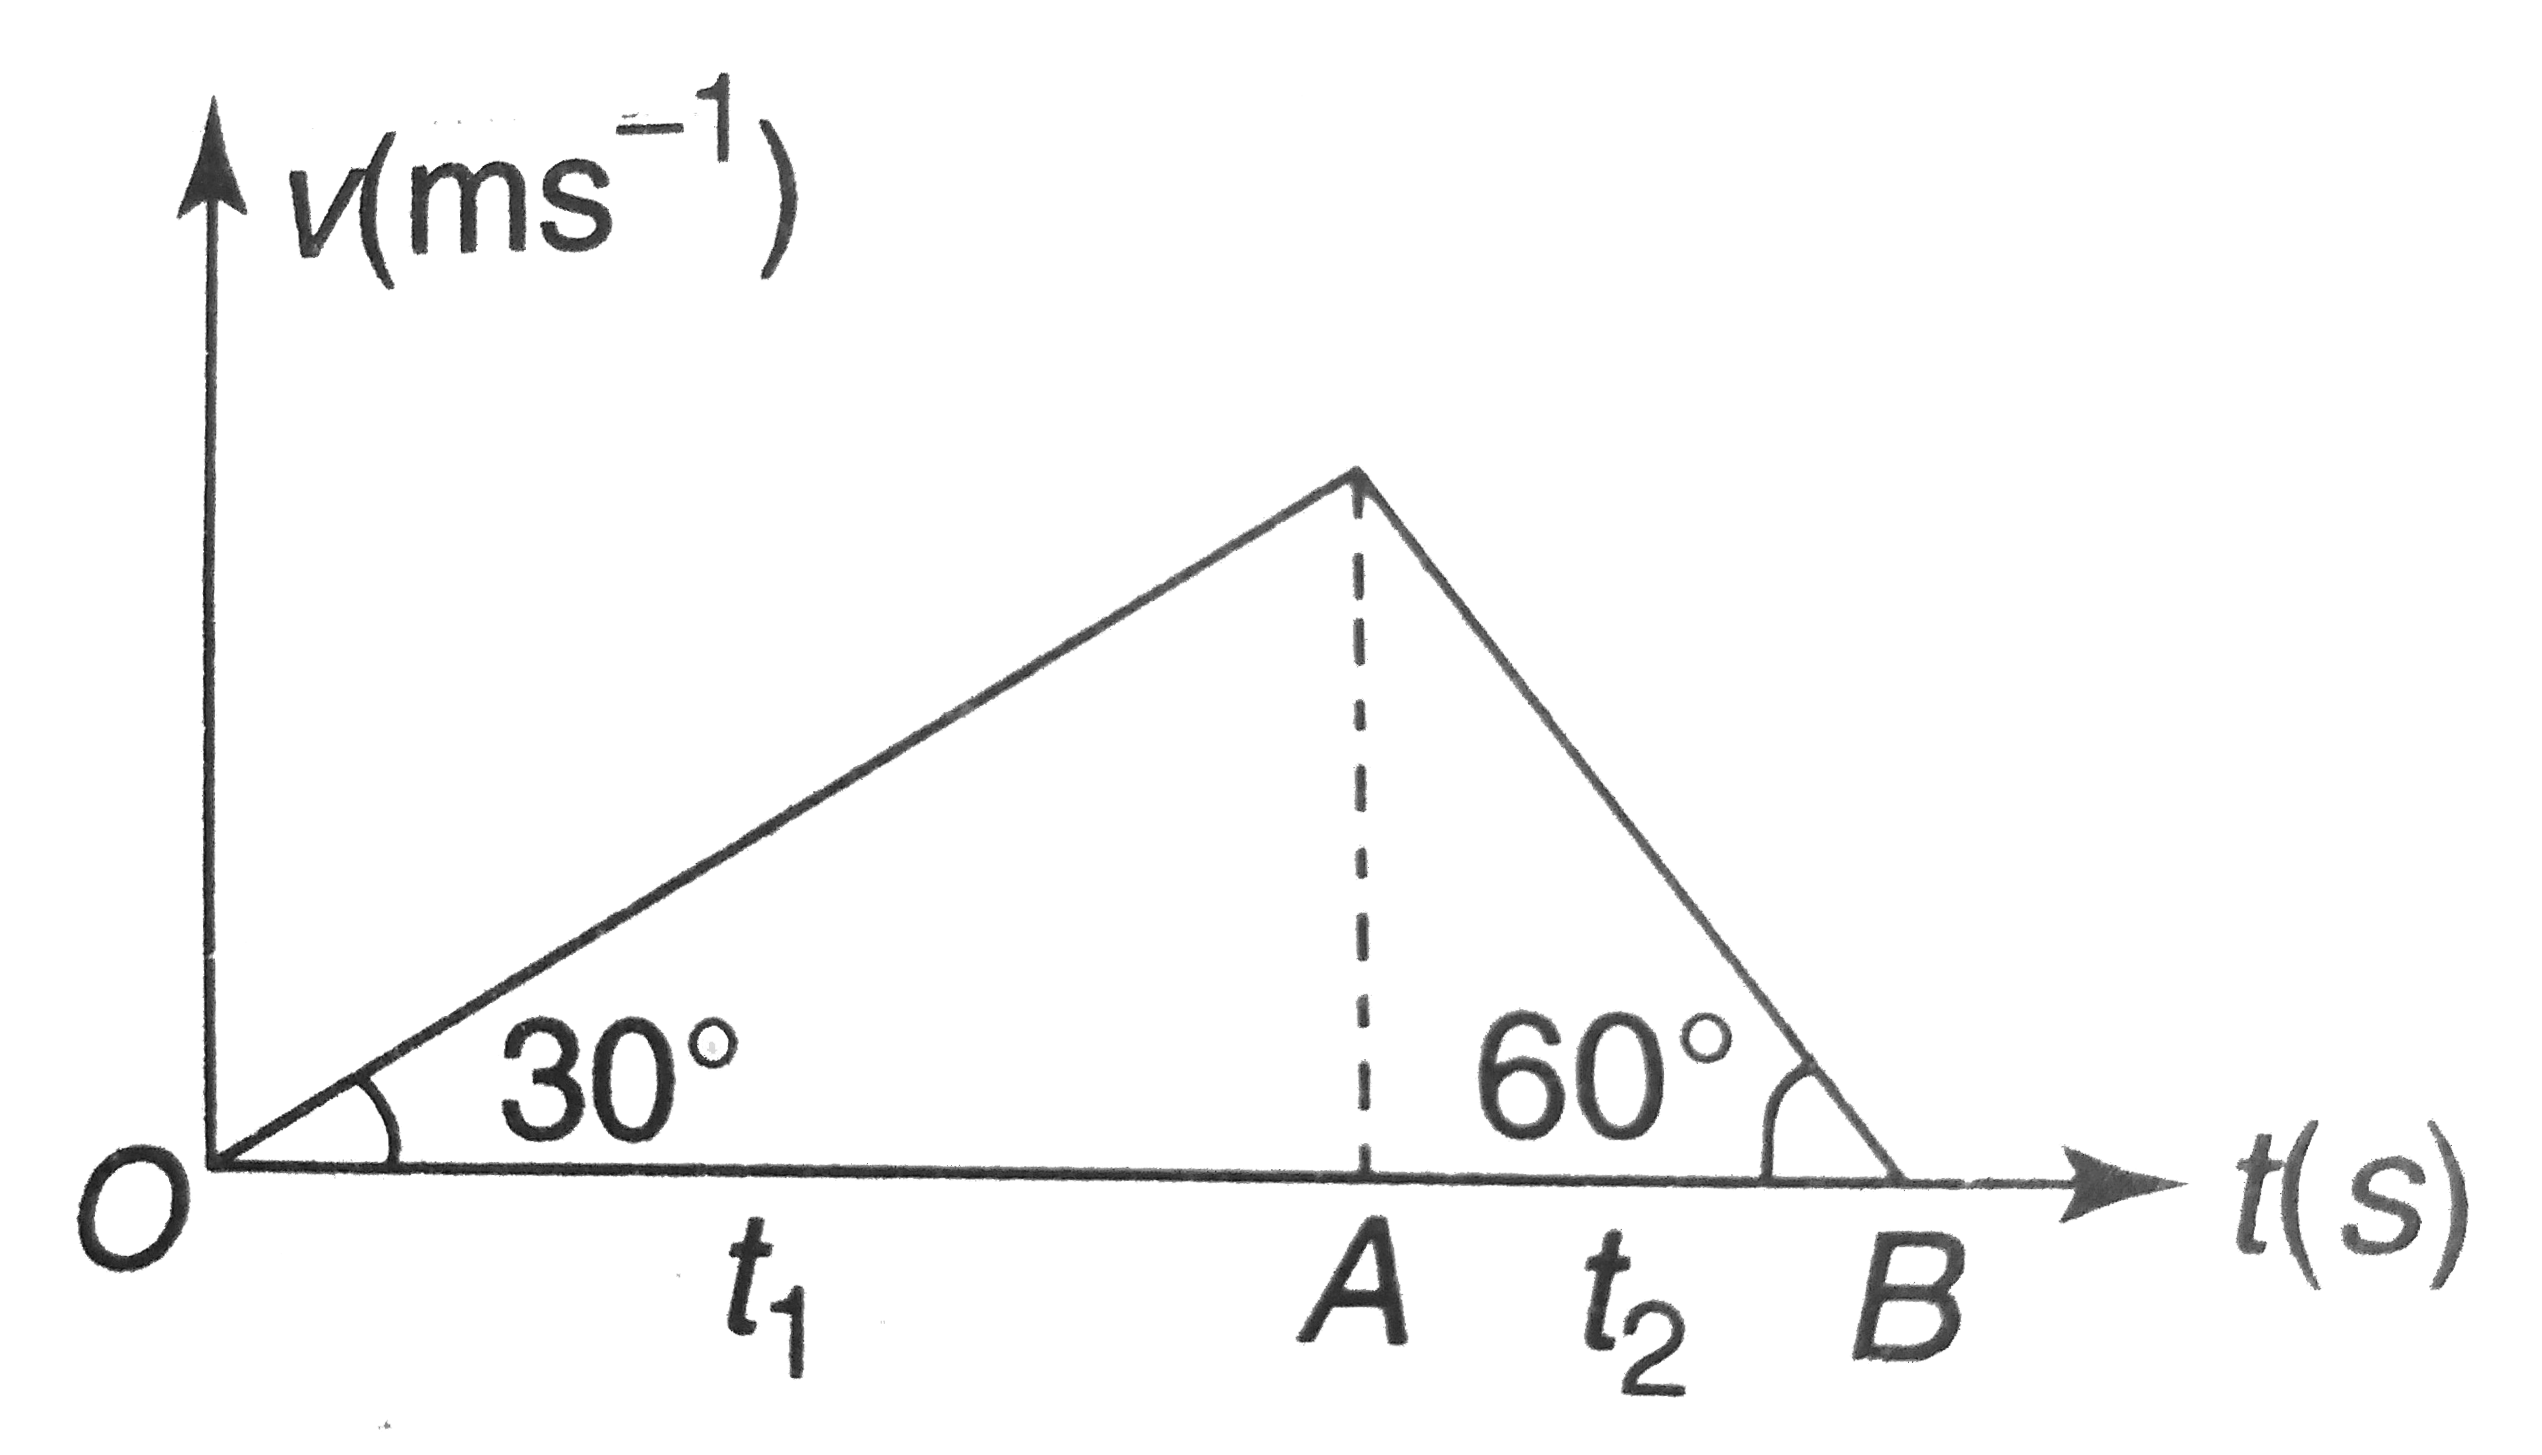
03:54View SolutionThe velocity time graph of a body moving along a straight line is shown in figure. The ratio of the average velocities during the time t1 and t2 is.
 04:29View Solution
The velocity-time graph of a body moving along straight line is as follows : The displacement of the body in 5 s is
01:46View SolutionThe velocity-time graph of a body moving in a straight line is shown below:

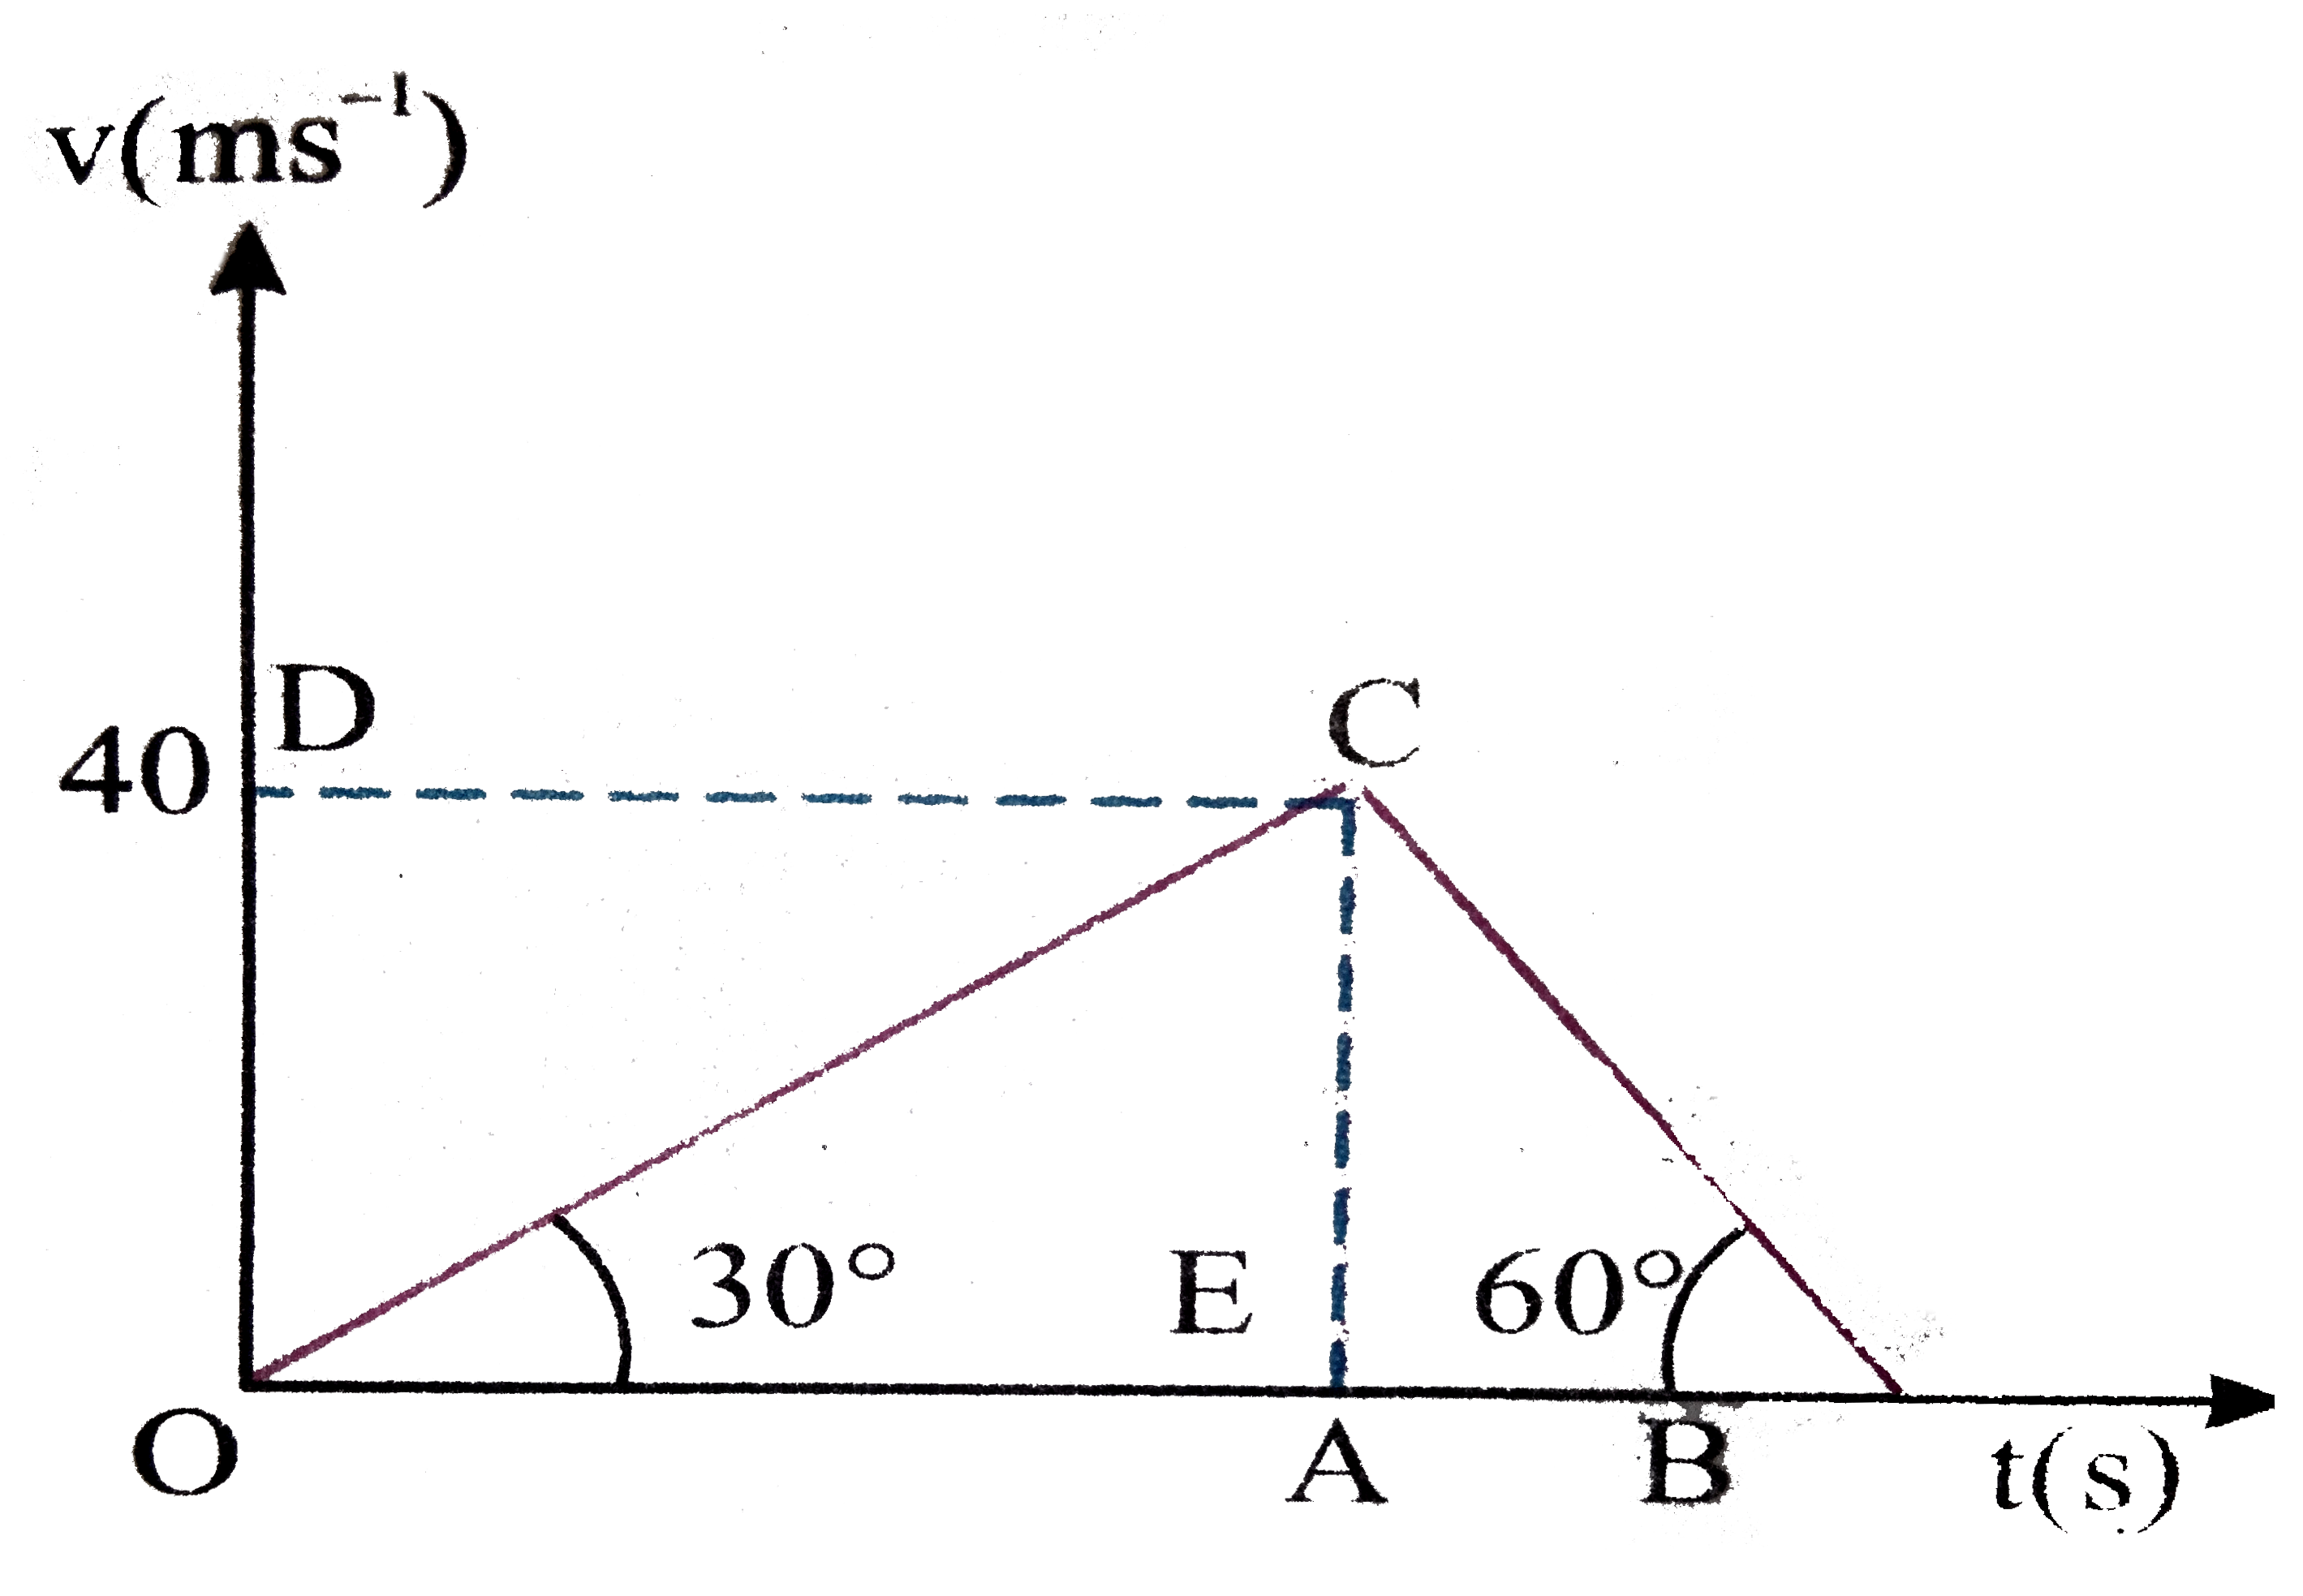
Which one of the following represents its acceleration time graph?02:44View SolutionThe velocity-time graph of a body is shown in figure. The ratio of magnitude of average acceleration during the intervals OA and AB is
 04:22View Solution
The velocity-time graph of a body moving in a straight line is shown in the figure.
03:53View SolutionThe velocity-time graph of a body moving with uniform velocity is a straight line parallel to __________
04:12View SolutionThe speed - time graph for a body moving along a straight line is shown in figure. The average acceleration of body may be
09:04View SolutionThe velocity versus time graph of a body moving along a straight line is as shown in figure. The ratio of displacement and distance covered body in 5 second is :-
View SolutionThe velocity-time graph of a particle moving along a straight line is shown in Fig. The displacement of the body in 5 second is :
06:12View SolutionThe velocity-time graph of a body moving in a straight line is shown in Fig. Find the displacement and distance travelled by the body in 10 sec.
 02:28View Solution
The velocity - time graph of a body is shown in fig. The ratio of the .....during the intervals OA and AB is _______
View Solution

