A ball is projected vertically upward with an initial velocity. Which of the following graphs best represents the K.E. of the ball as a function of time from the instant of projection till it reaches the point of projection :


The correct Answer is:c
Topper's Solved these Questions
Similar Questions
A ball thrown vertically upward with initial velocity u. Which of the following graphs represent the velocity of ball correctly as function of time?
(Take upward direction as positive)
View SolutionA particle is projected vertically upwards with a velocity v. It returns to the ground in time T. Which of the following graphs correctly represents the motion.
View Solution
Knowledge Check
A ball is projected vertically up with an initial velocity. Which of the following graphs represents the KE of the ball?
A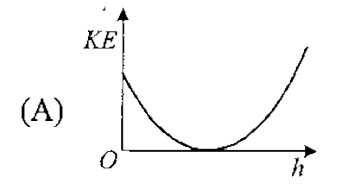 B
B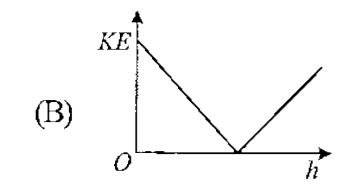 C
C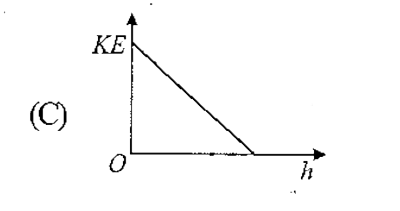 D
D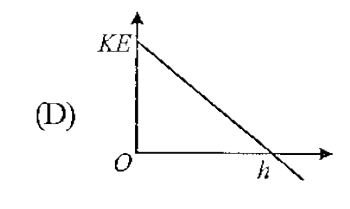
A ball thrown vertically upward with initial velocity u. Which of the following graphs represent the velocity of ball correctly as function of time?
(Take upward direction as positive)ABCDA ball is thrown vertically upwards. Which of the following graph/graphs represent velocity time graph of the ball during its flight ( air resistance is neglected).
A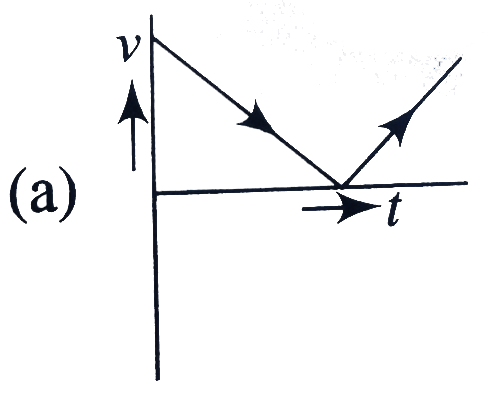 B
B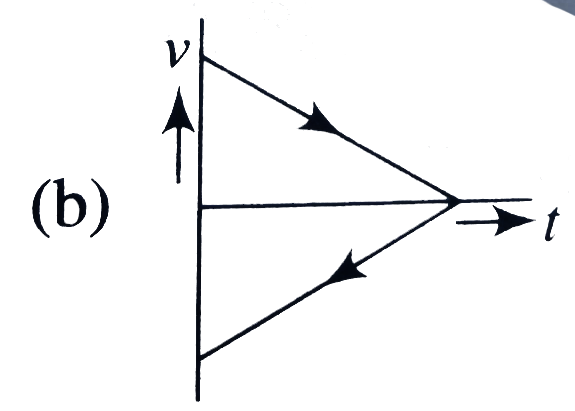 C
C D
D
A ball is thrown vertically upwards. Which of the following graph/graphs represent velocity-time graph of the ball during its flight (air resistance is neglected)
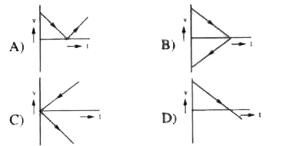
View SolutionA ball is projected vertically upward with a velocity 112m/s The time taken by it to return to the point of projection is (g=10m/s2) :
View SolutionA ball is projected vertically upward with a velocity 112m/s The time taken by it to return to the point of projection is (g=10m/s2) :
View SolutionA body is projected vertically upward from the surface of the earth, then the velocity-time graph is:-
View SolutionA body is projected vertically upward from the surface of the earth, then the velocity-time graph is:-
View Solution


