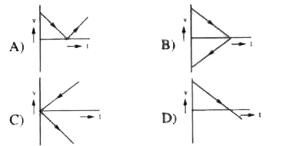
A ball thrown vertically upward with initial velocity u. Which of the following graphs represent the velocity of ball correctly as function of time?
(Take upward direction as positive)
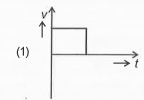
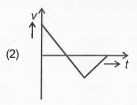
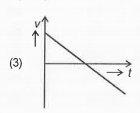
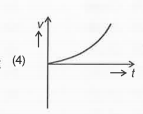
The correct Answer is:C
To determine the correct graph representing the velocity of a ball thrown vertically upward with an initial velocity u, we can analyze the motion step by step.
Step 1: Understand the motion of the ball
When a ball is thrown upward, it moves against the force of gravity. The initial velocity u is positive (upward direction), and as the ball rises, its velocity decreases due to gravitational acceleration g acting downwards.
Hint: Remember that gravity acts in the opposite direction to the initial velocity.
Step 2: Write the equation for velocity
The velocity v of the ball at any time t can be expressed using the equation:
v=u−gt
where:
- v is the velocity at time t,
- u is the initial velocity,
- g is the acceleration due to gravity (approximately 9.81m/s2),
- t is the time in seconds.
Hint: The negative sign in the equation indicates that gravity is acting in the opposite direction to the initial velocity.
Step 3: Analyze the velocity over time
1. At t=0, the velocity v=u (the ball is at its maximum upward speed).
2. As time increases, the term gt increases, causing the velocity v to decrease.
3. The ball will reach its maximum height when v=0. Setting the equation to zero:
0=u−gt⟹t=ug
4. After reaching the maximum height, the ball will start to fall back down, and the velocity will become negative (downward direction).
Hint: The point where the velocity becomes zero corresponds to the maximum height of the ball.
Step 4: Sketch the graph
- The graph starts at v=u (positive value).
- The velocity decreases linearly to zero at t=ug.
- After reaching zero, the velocity becomes negative and continues to decrease (in magnitude) as the ball falls back down.
Hint: The graph should show a straight line starting from a positive value, decreasing to zero, and then continuing downward into the negative region.
Conclusion
The correct graph representing the velocity of the ball as a function of time will start at u, decrease linearly to zero, and then continue into the negative region as the ball falls back down.
Final Answer: The correct option is C, which represents this behavior accurately.
When a ball is thrown upward, it moves against the force of gravity. The initial velocity u is positive (upward direction), and as the ball rises, its velocity decreases due to gravitational acceleration g acting downwards.
The velocity v of the ball at any time t can be expressed using the equation:
v=u−gt
where:
- v is the velocity at time t,
- u is the initial velocity,
- g is the acceleration due to gravity (approximately 9.81m/s2),
- t is the time in seconds.
1. At t=0, the velocity v=u (the ball is at its maximum upward speed).
2. As time increases, the term gt increases, causing the velocity v to decrease.
3. The ball will reach its maximum height when v=0. Setting the equation to zero:
0=u−gt⟹t=ug
4. After reaching the maximum height, the ball will start to fall back down, and the velocity will become negative (downward direction).
- The graph starts at v=u (positive value).
- The velocity decreases linearly to zero at t=ug.
- After reaching zero, the velocity becomes negative and continues to decrease (in magnitude) as the ball falls back down.
The correct graph representing the velocity of the ball as a function of time will start at u, decrease linearly to zero, and then continue into the negative region as the ball falls back down.
Topper's Solved these Questions
Similar Questions
Knowledge Check
A player throws a ball vertically upwards with velocity u. At highest point,
A1. both the velocity and acceleration of the ball are zero.B2. the velocity of the ball is u but its accelerationC3. the velocity of the ball is zero but its acceleration is g.D4. the velocity of the ball is u but its acceleration is g.
A ball is thrown vertically upward. What is the magnitude of velocity at the highest point ?
View SolutionA ball is thrown vertically upwards. Which of the following graph/graphs represent velocity-time graph of the ball during its flight (air resistance is neglected)
View SolutionA ball is thrown vertically upward with a speed of 20 m/s. Draw a graph showing the velocity of the ball as a function of time as it goes up and then comes back.
View SolutionA ball is thrown vertically upward with a velocity u from balloon descending with a constant velocity v. The vall will pass by the balloon after time
View SolutionA body is thrown vertically upwards with an initial velocity u. Write an expression for the maximum height attained by the body.
View SolutionA particle is thrown vertically upwards with a velocity v. It returns to the ground in time T. which of the following graphs correctly represents the motion ?
View SolutionA ball is thrown vertically upward with a velocity 'u' from the balloon descending with velocity v. After what time, the ball will pass by the balloon ?
View Solution