Which of the following graphs represent the behaviour of an ideal gas ?
A

B

C

D

Text Solution
The correct Answer is:A
According to Charle.s law,
V∝T
Therefore, graph is a straight line. Hence (a) is correct option.
Correct choice is (a).
|
Topper's Solved these Questions
- PROPERTIES OF MATTERBOOK - MODERN PUBLICATIONCHAPTER - PROPERTIES OF MATTEREXERCISE - MULTIPLE CHOICE QUESTIONS (LEVEL-II)
72 Videos
- PROPERTIES OF MATTERBOOK - MODERN PUBLICATIONCHAPTER - PROPERTIES OF MATTEREXERCISE - MULTIPLE CHOICE QUESTIONS (LEVEL-III)
13 Videos
- OSCILLATIONSBOOK - MODERN PUBLICATIONCHAPTER - OSCILLATIONSEXERCISE - RCQ
7 Videos
- RAY OPTICSBOOK - MODERN PUBLICATIONCHAPTER - RAY OPTICSEXERCISE - RECENT COMPETITIVE QUESTION
32 Videos
Similar Questions
Knowledge Check
Which of the following plots represents the behavior of an ideal binary liquid solution ?
APlot of PtotalvsYA (mol-fraction of A in vapour phase) is linearBplote of PtotalvsYB is linearCPlote of 1/PtotalvsYA is linearDPlote of 1/PtotalvsYB is non-linearWhich of the following plots does not represent the behaviour of an ideal binary liquid solution?
APlot of pA versus xA (mole fraction of A in liquid phase) is linearBPlot of pB versus xB is linearCPlot of ptotal versus xA (or xB) is linearDPlot of ptotal versus xA is non-linearThe graph that does represent the behaviour of an ideal gas is :
A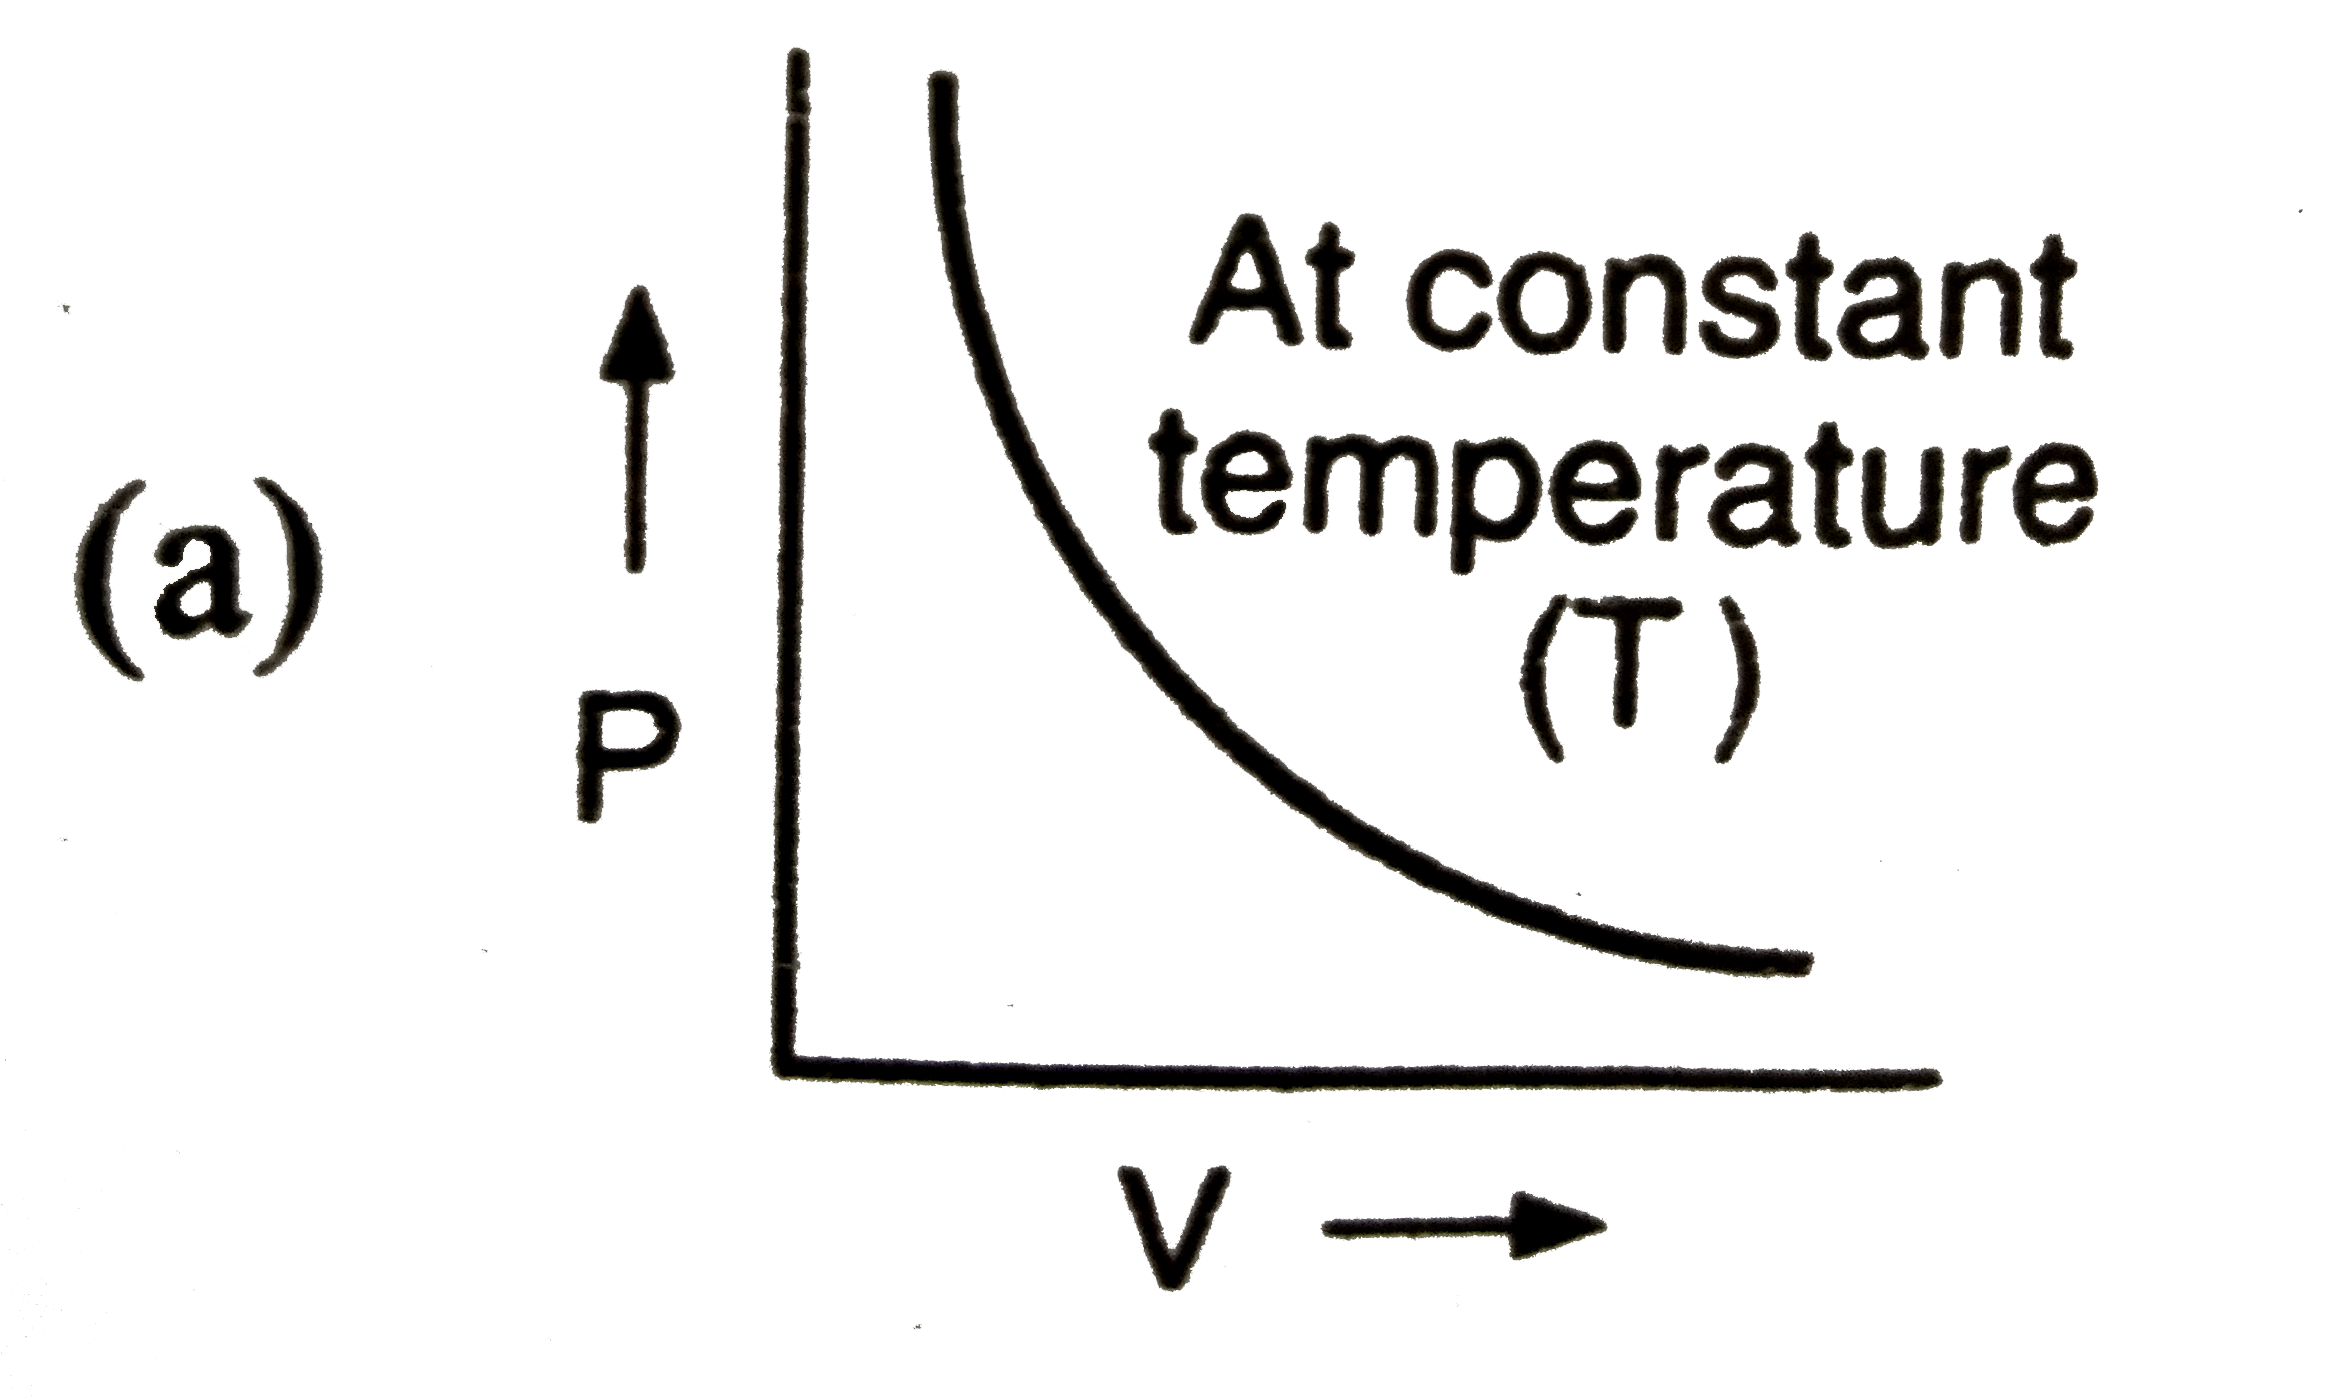 B
B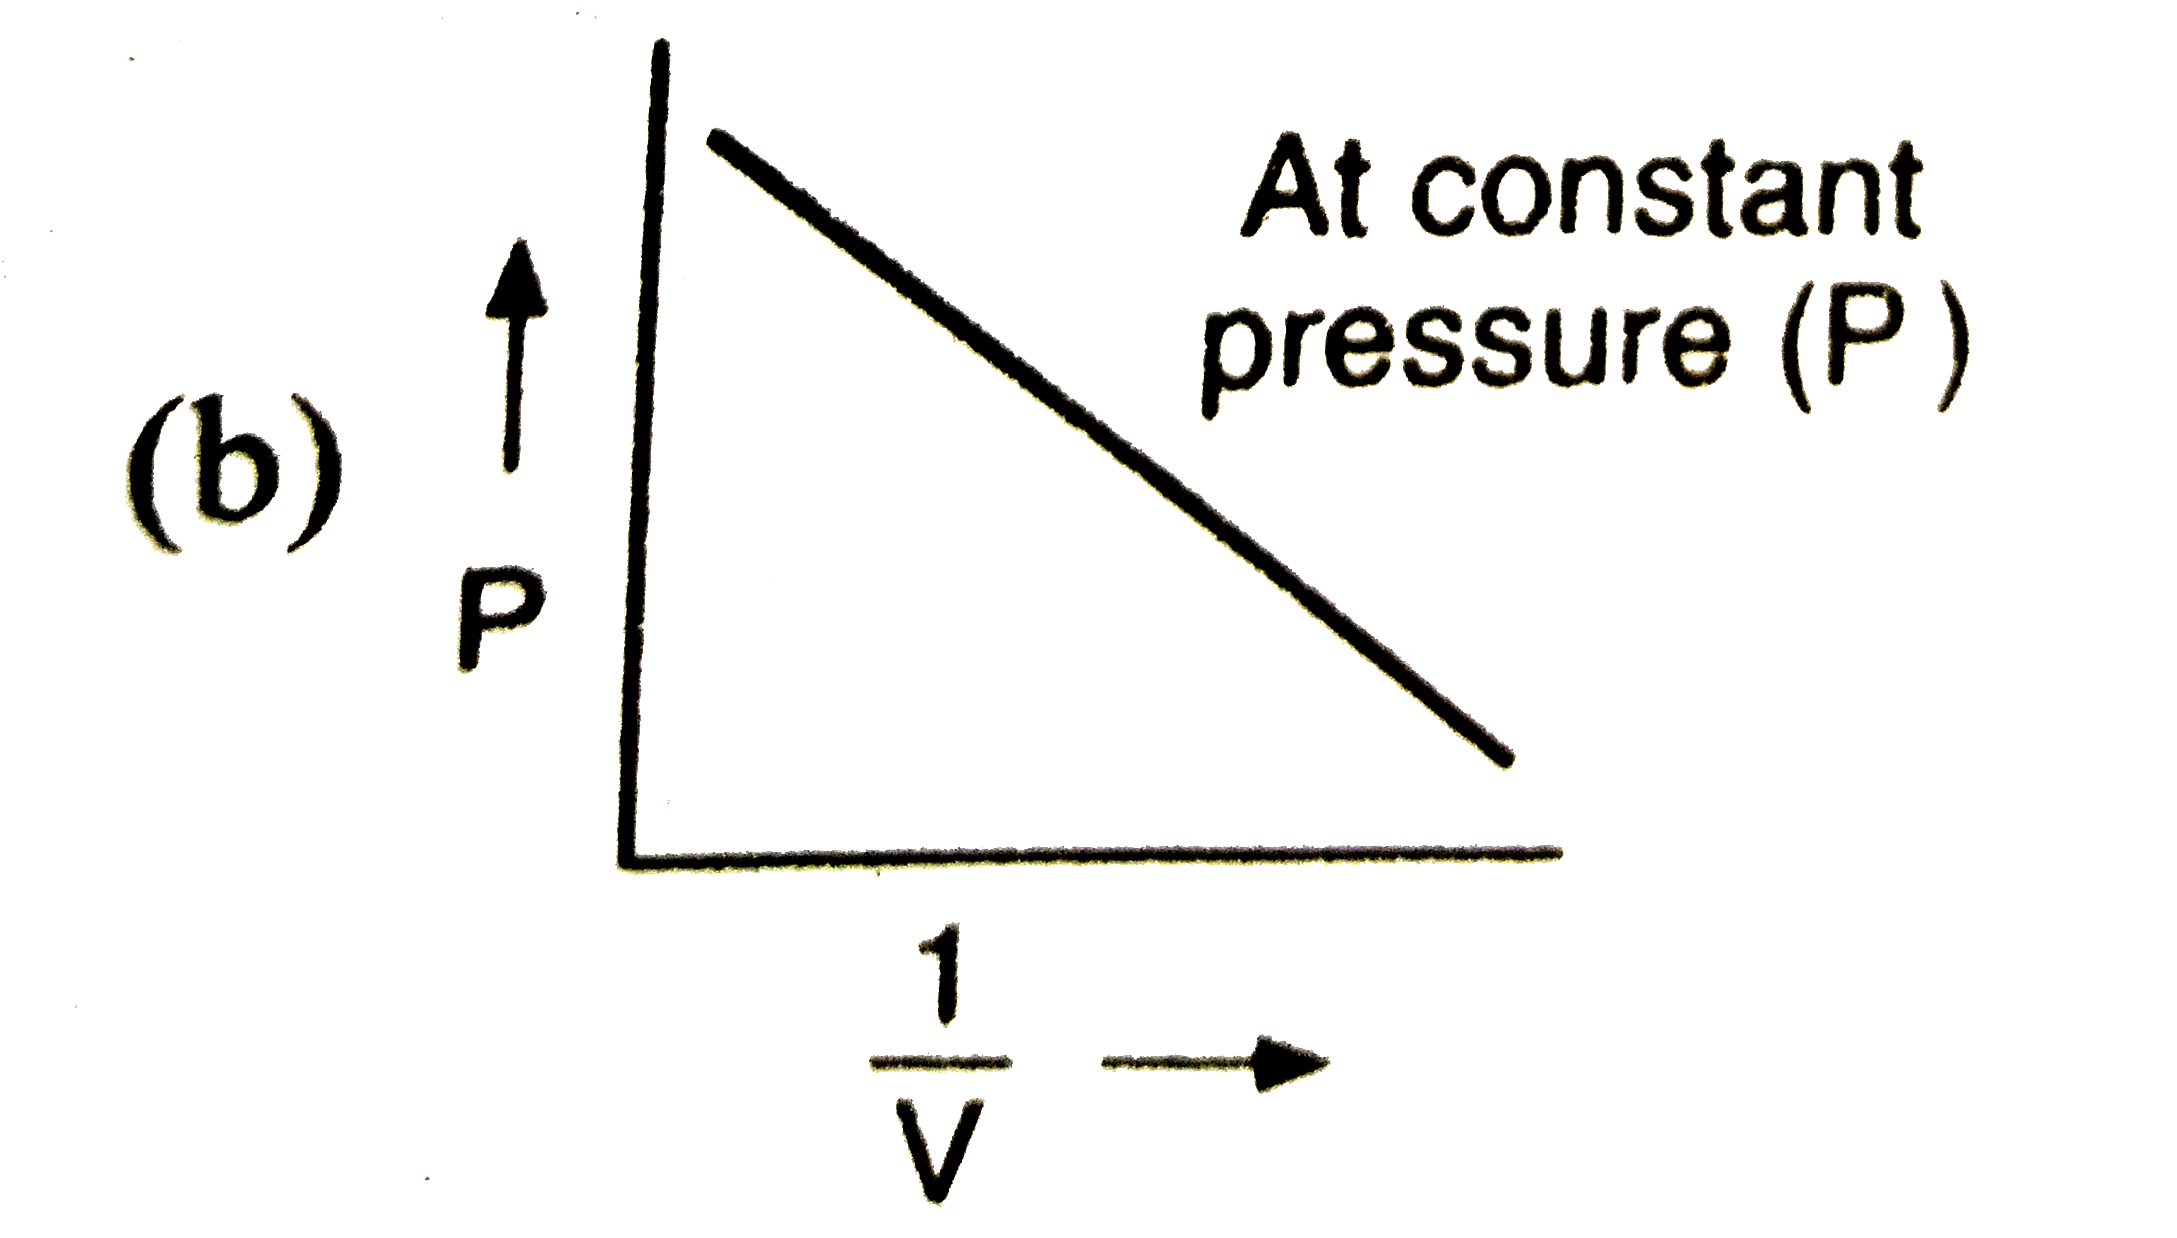 C
C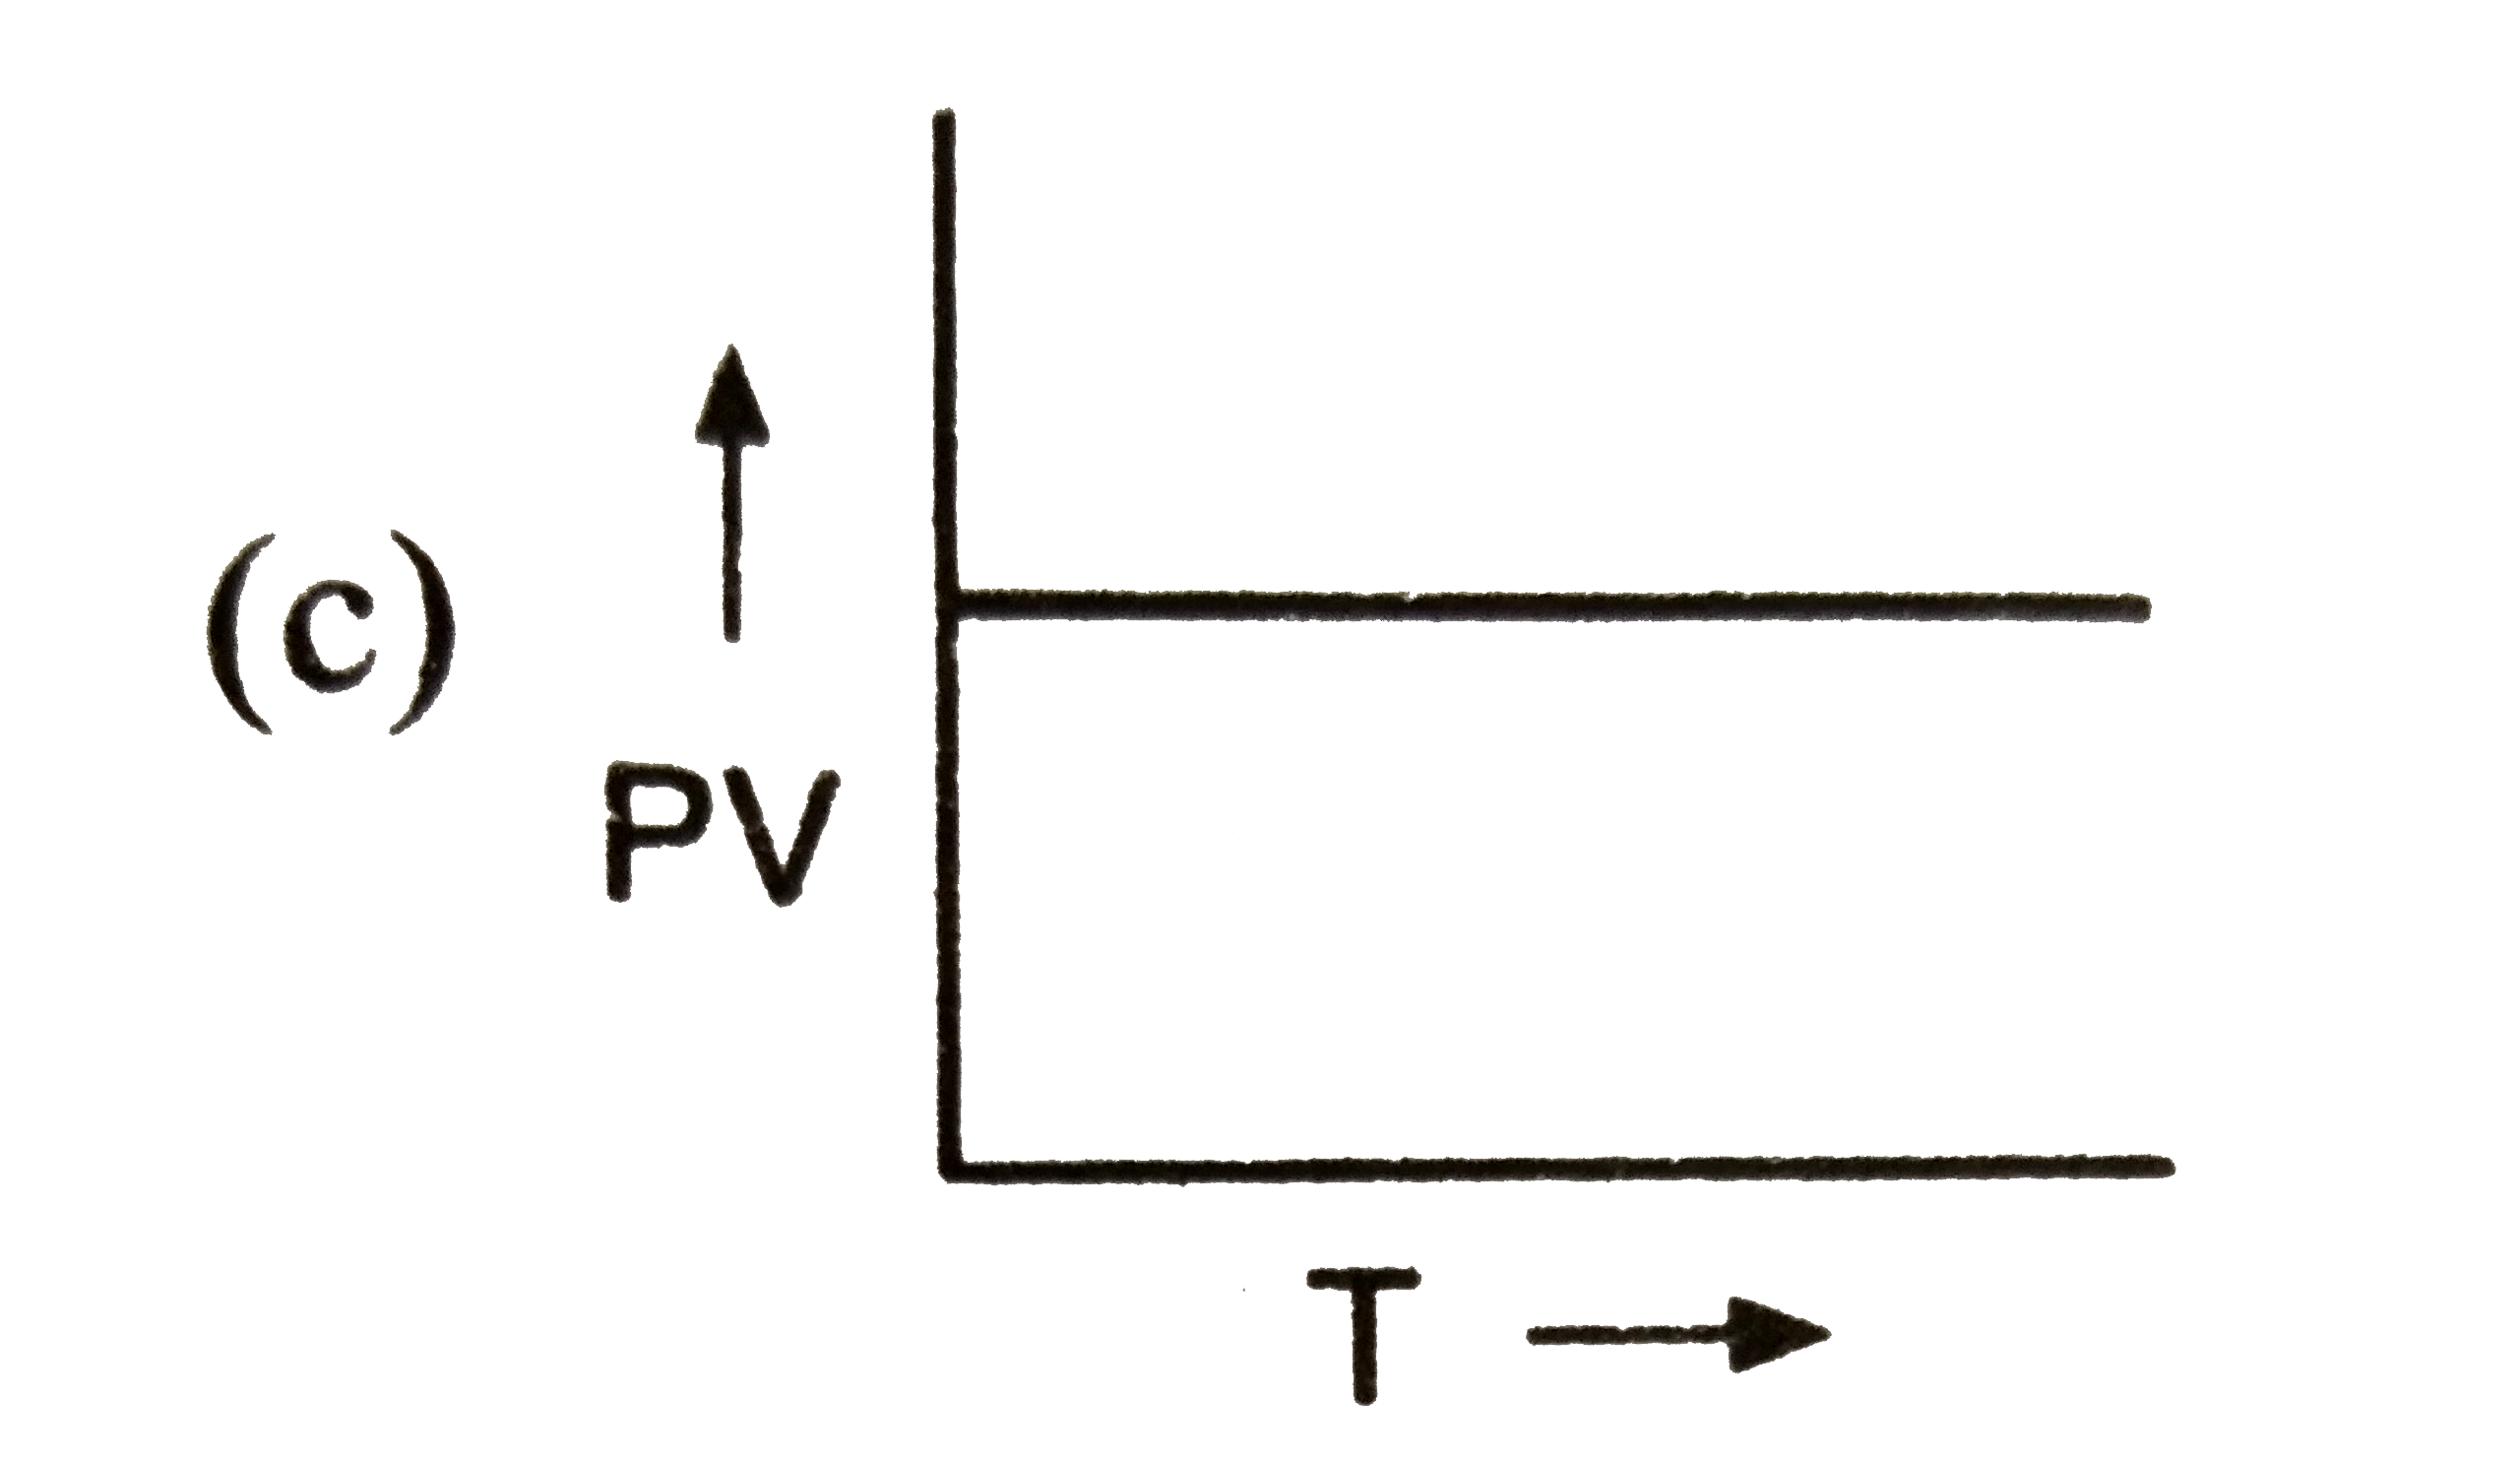 D
D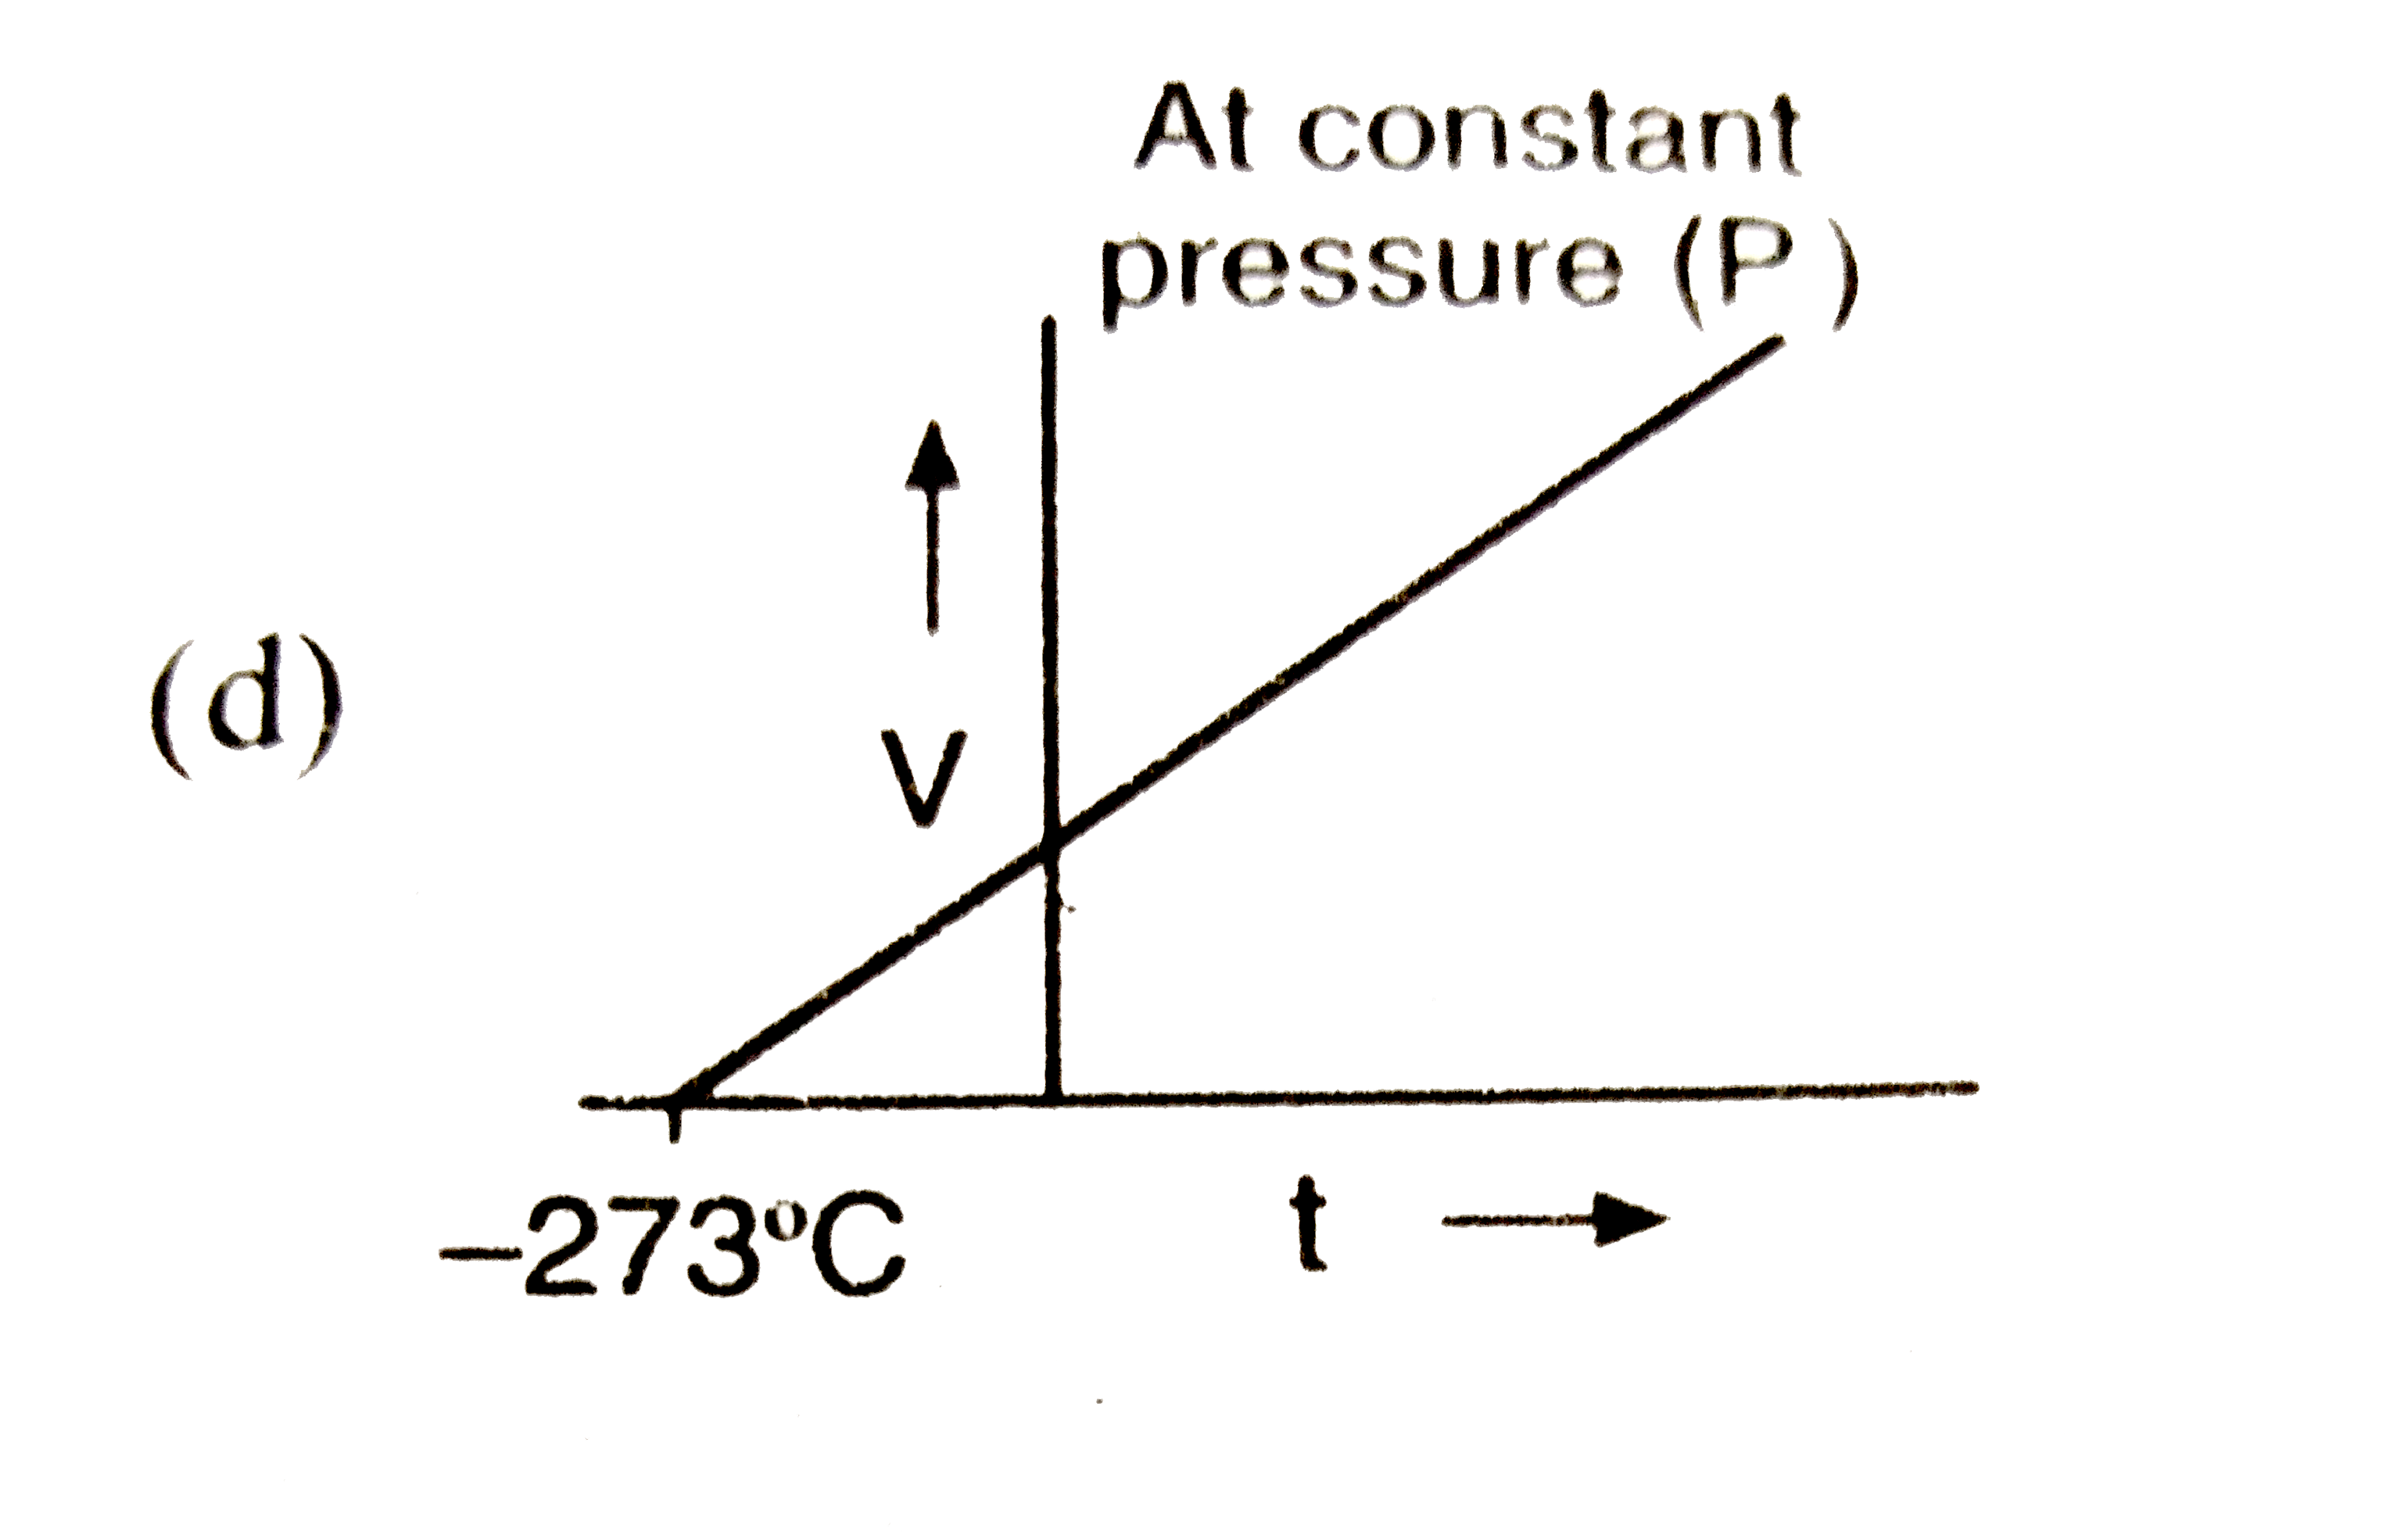
Which curve in the following graph represents the curve of ideal gas ?
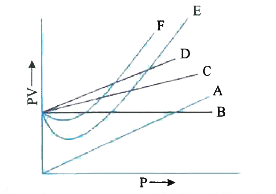
View SolutionWhich of the following graphs is not a straight line for an ideal gas ?
View SolutionThe graph that does not repersent the behaviour of an ideal gas is-
View SolutionWhich of the following graphs correctly represents the variation of β=−(dV/dP)/V with P for an ideal gas at constant temperature?
View SolutionWhich of the following graphs correctly represents the variation of β=−dV/dPV
with P for an ideal gas at constant temperature?
View Solution
