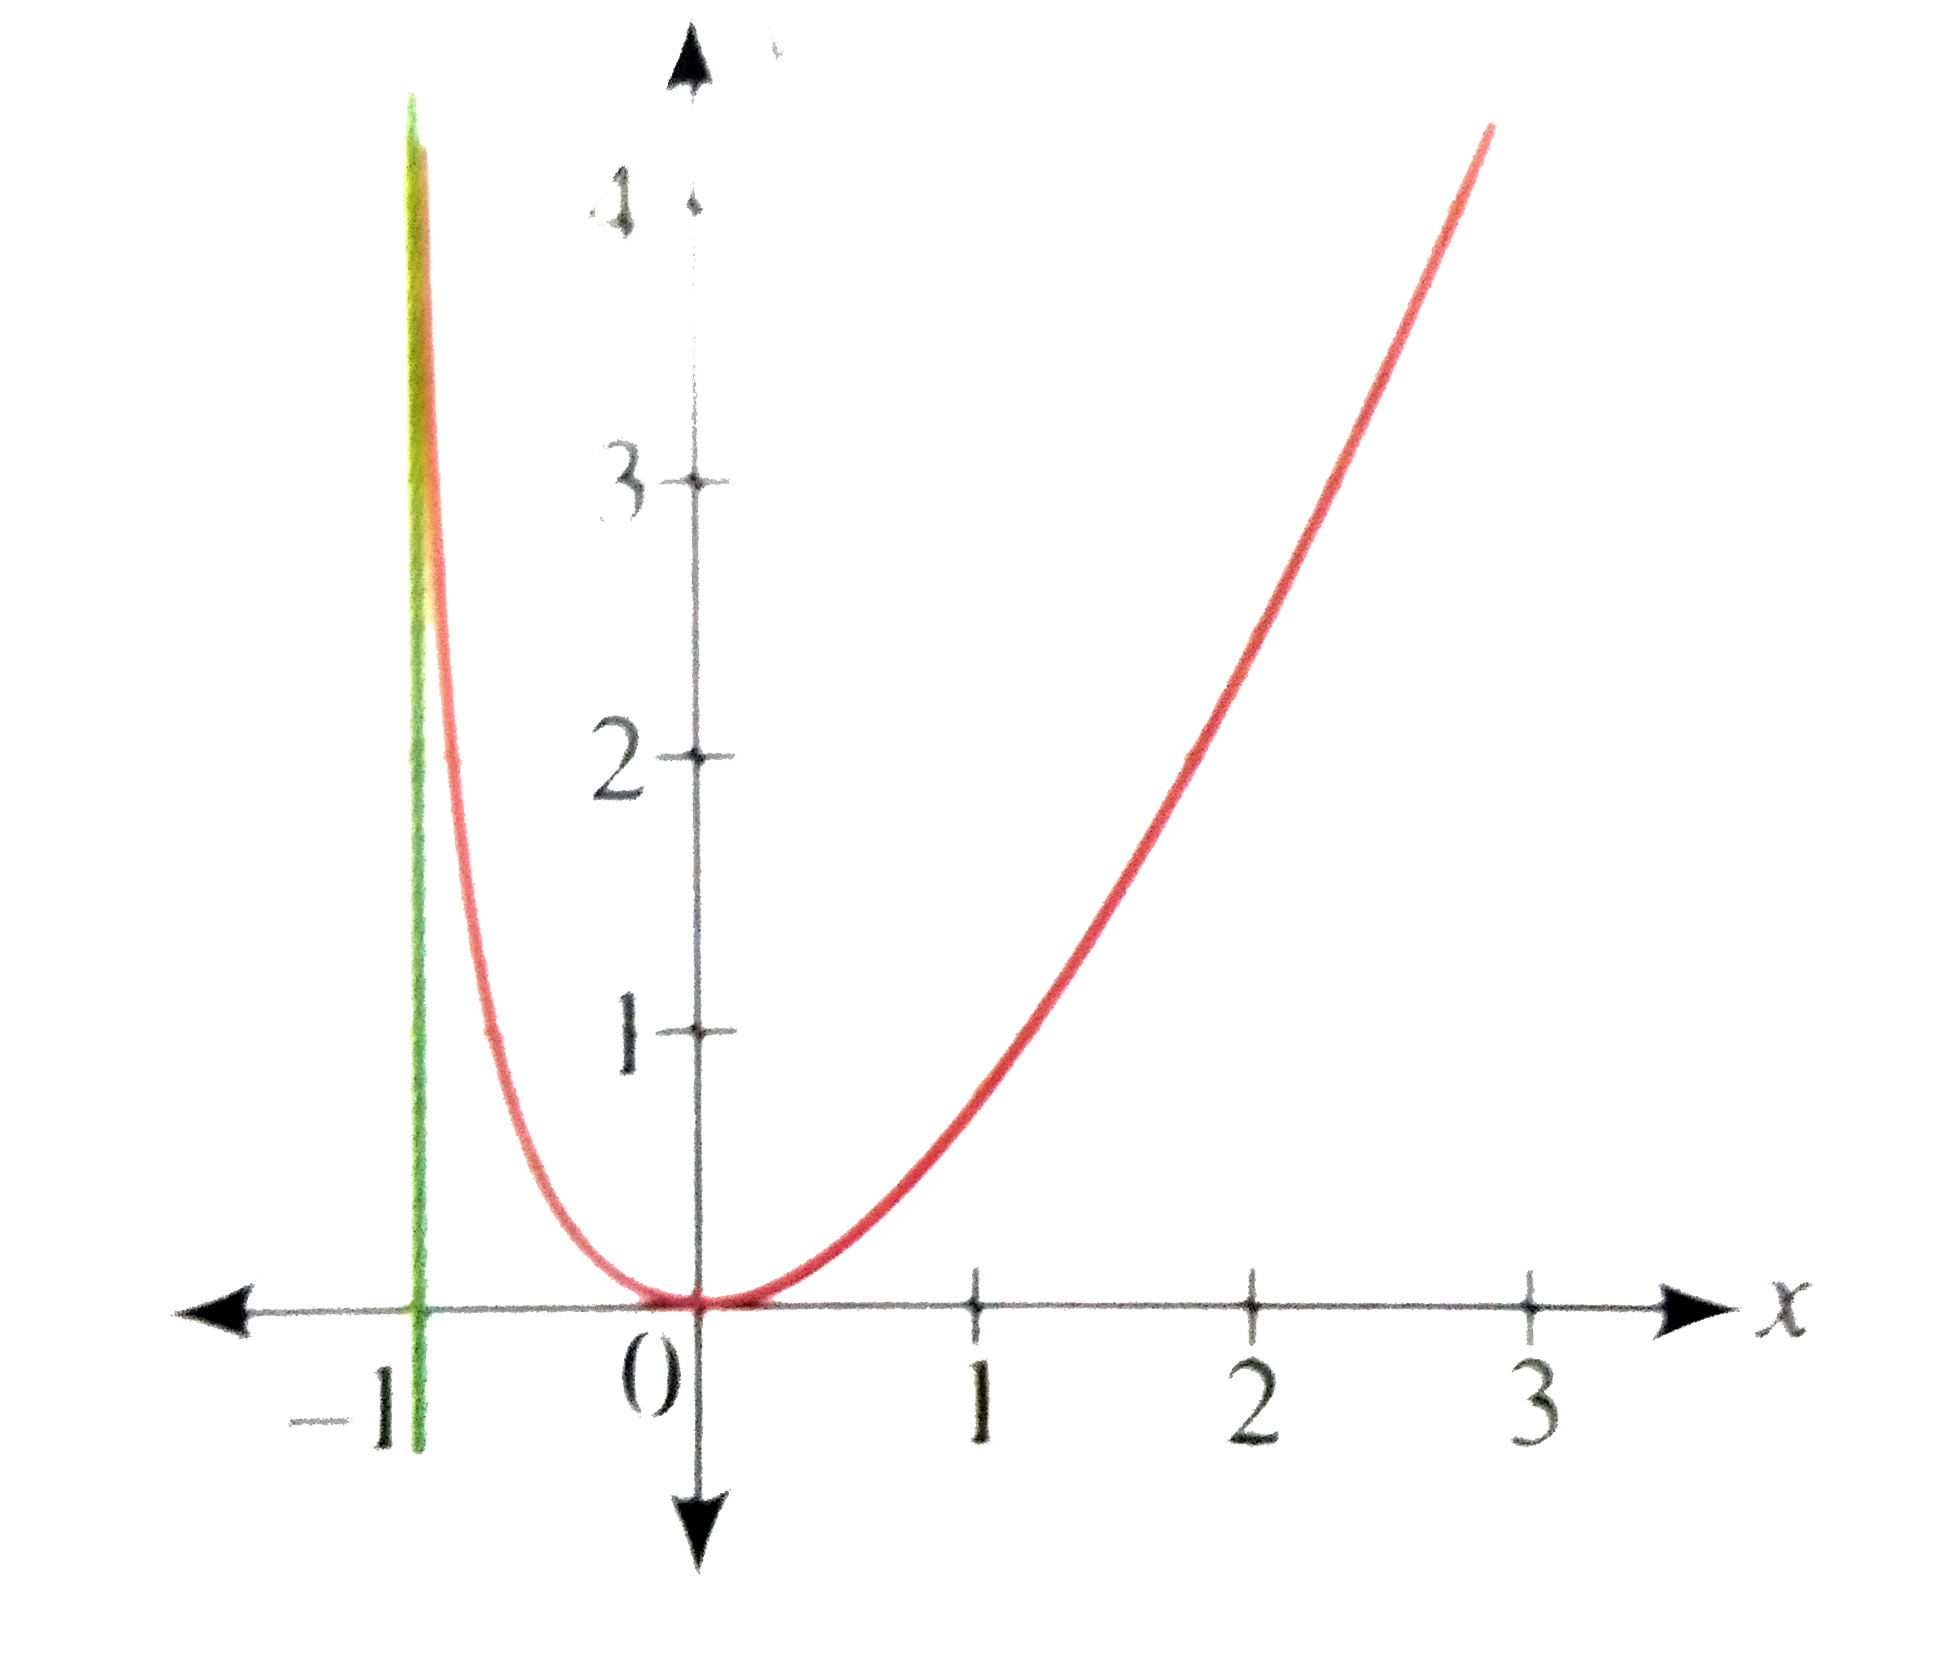
Draw the graph of y=x2√x+1
Video Solution
Text Solution
We have, y=f(x)=x2√x+1
Clearly, the domain of the function is (−1,∞).
x2√x+1≥0,∀x∈(−1,∞)
So the graph of y=f(x) lies entirely above the x-axis.
x2x→−1+√x+1=∞
f(0)=0
f′(x)=2x√x+1−x22√x+1/(x+1)
=4x(x+1)−x22(x+1)√x+1
=x(3x+4)2(x+1)√x+1
f′(x)<0 for −1<x<0. Where f(x) decreases and f′(x) increases. Hence, x=0 is point of minima.
limx→∞(x2√x+1)=∞
Hence graph of functions is as shown in the following figure.

|
Updated on:21/07/2023
Topper's Solved these Questions
Similar Questions
Draw the graph of y=x2+1
View SolutionDraw the graph of y=2x.
View SolutionDraw the graph of y=|x|
View SolutionDraw the graph of y=|x|+2
View SolutionDraw the graph of y=x+1x
View SolutionDraw the graph of y=1x2.
View SolutionDraw the graph of y=2−x.
View SolutionDraw the graph of y=(√x2+1−√x2−1)
View SolutionDraw the graph of y=f(x)=√1−cosx
View SolutionDraw the graph of y=1−x21+x2 and hence draw the graph of y=cos−1.1−x21+x2.
View Solution

