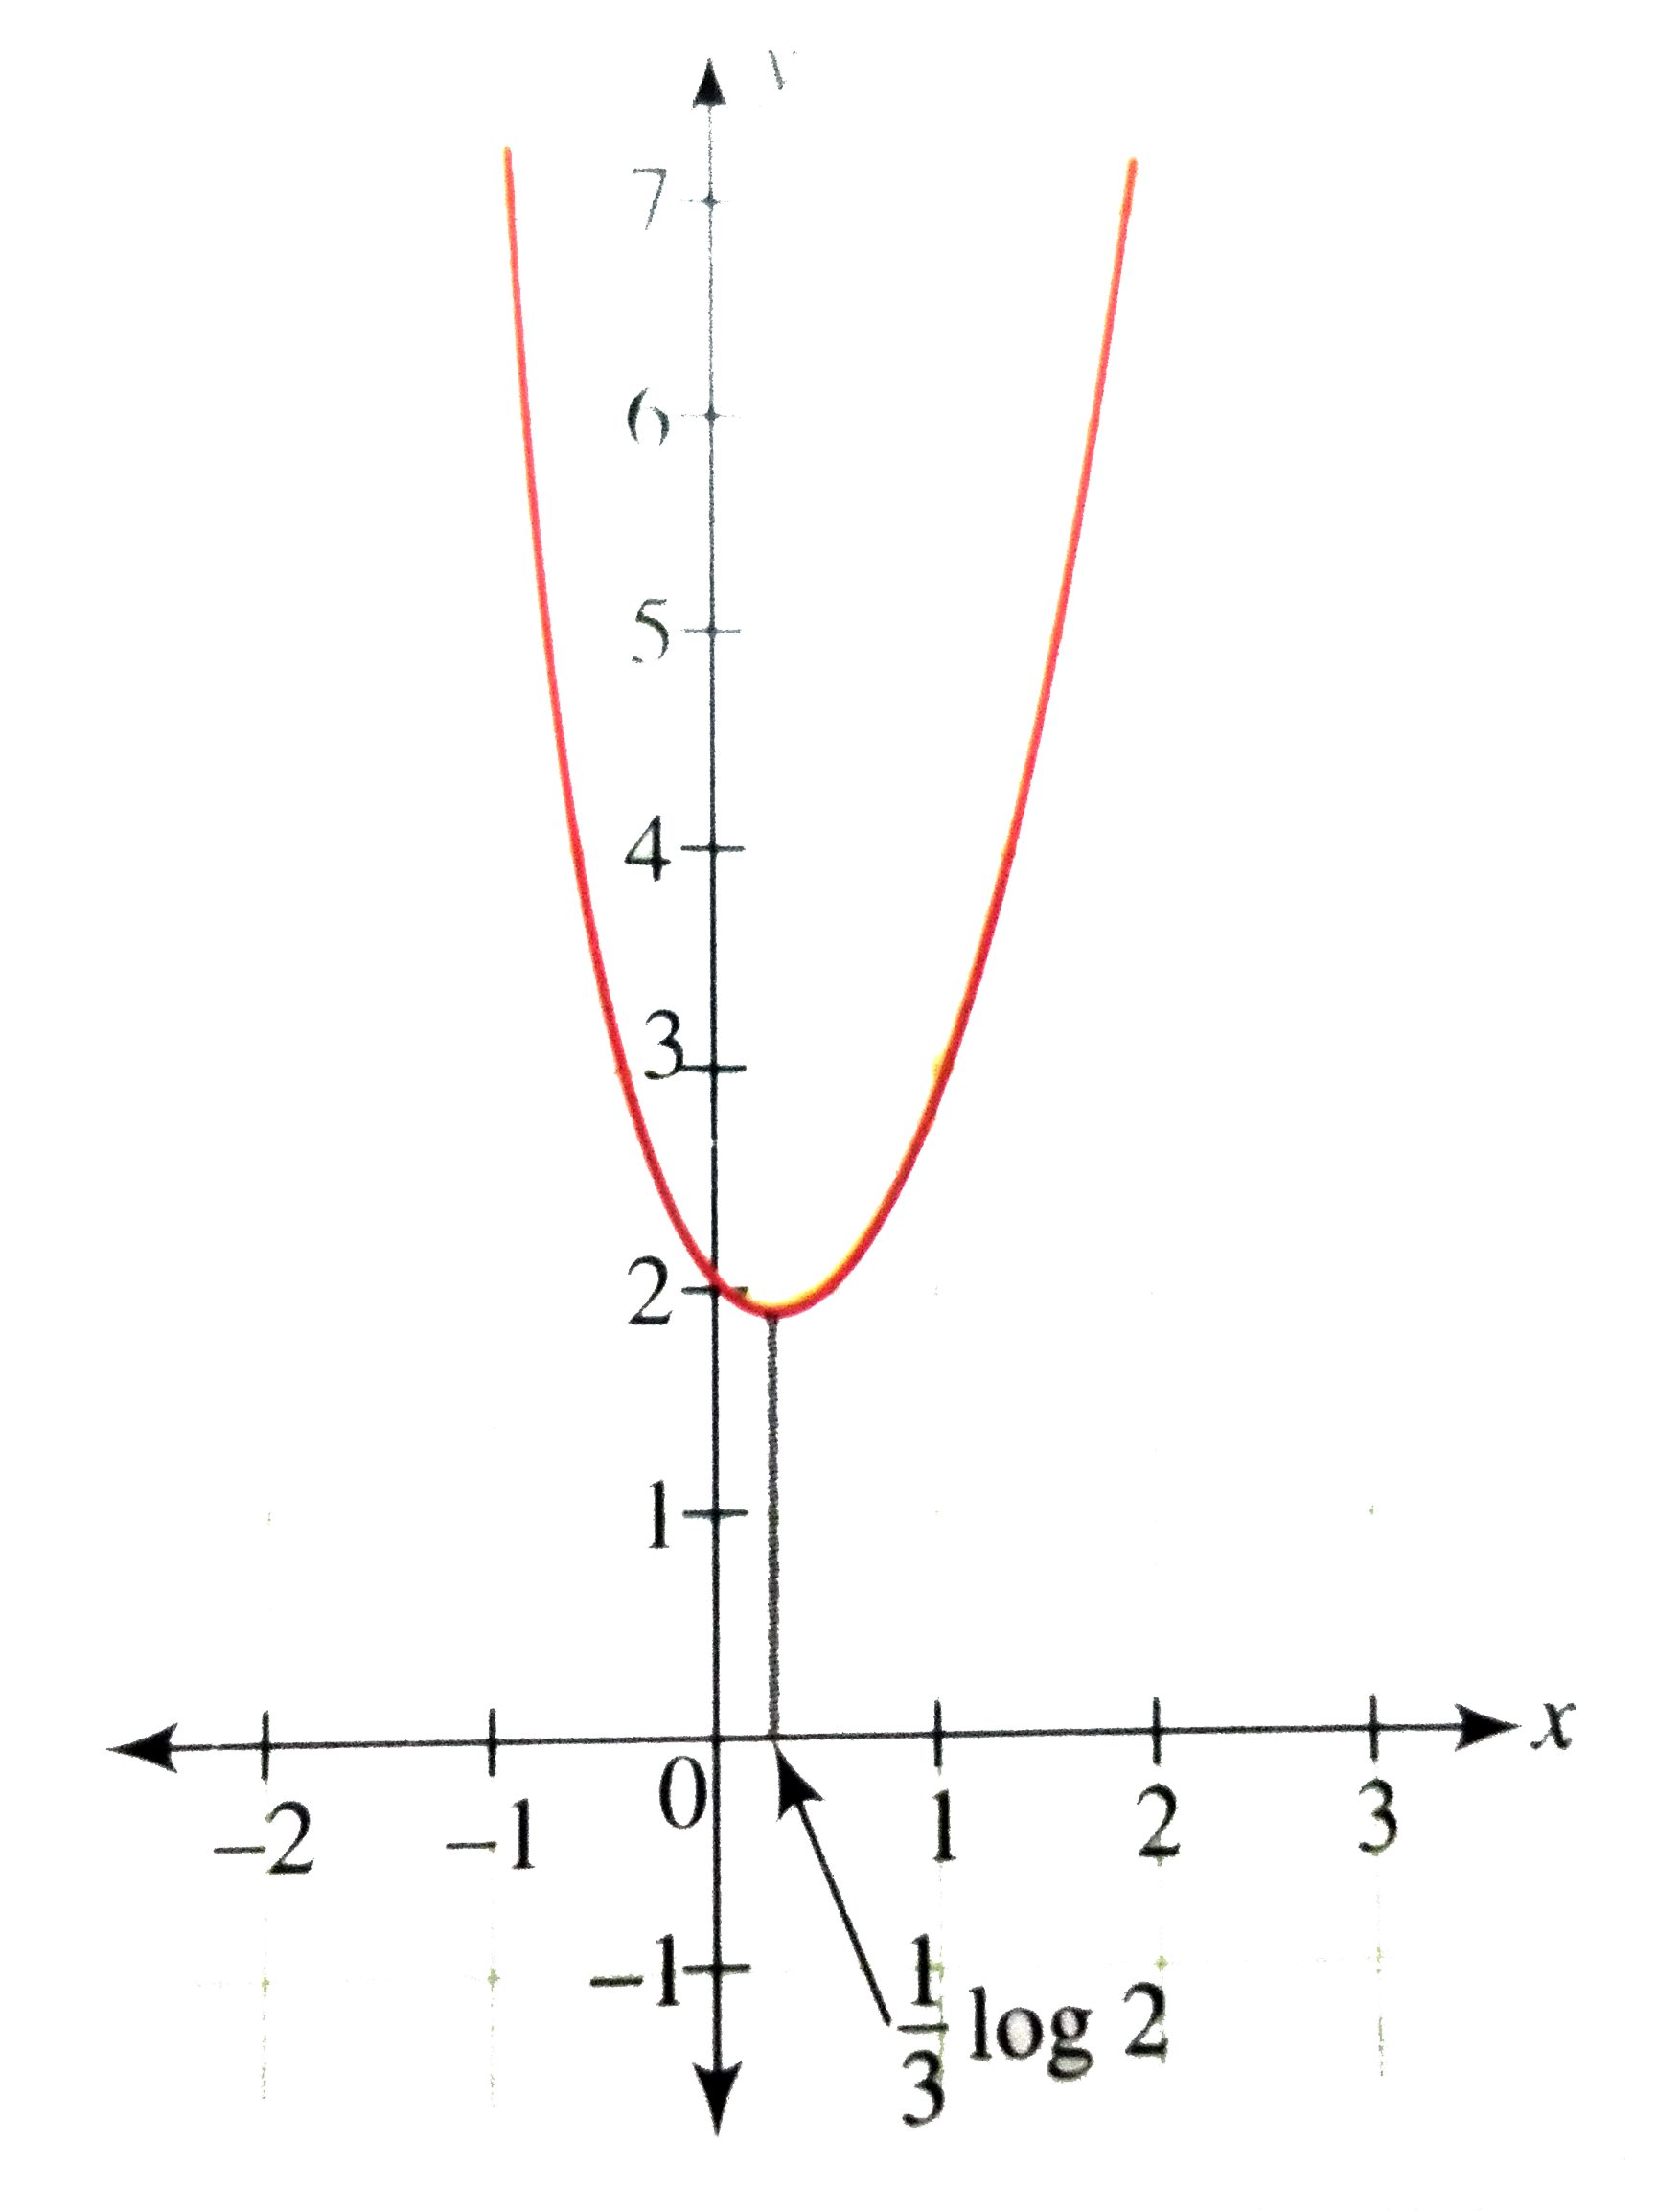
Draw the graph of y=ex+e−2x
Text Solution
We have y=f(x)=ex+e−2x
Clearly, the doamin of the function is R.
f(0)=1+1=2
Also f(x)>0,∀x∈R
f′(x)=ex−2e−x=e−2xe3x−2
f′(x)=0∴e3x=2 or x=13log2
f(13log2)e13log2+e−23log2=21/3+2−2/3=3223
f(x) decreases in (−∞,13log2) and increases in (13log2,∞)
Hence the graph of the function is as shown in the following figure.

|
Topper's Solved these Questions
Similar Questions
Draw the graph of y=ex−e−x2.
View SolutionDraw the graph of y=ex−e−x2.
View SolutionDraw the graph of y=(logex)2
View SolutionDraw the graph of y=(logex)2
View SolutionDraw the graph of y=e−x, when the graph of y=ex is known.
View SolutionDraw the graph of y=−ex when the graph of y=ex is known.
View SolutionDraw the graph of y=e−x, when the graph of y=ex is known.
View SolutionDraw the graph of y=−ex when the graph of y=ex is known.
View SolutionDraw the graph of y=loge(x2−1)
View SolutionDraw the graph of y=loge(x2−1)
View Solution
