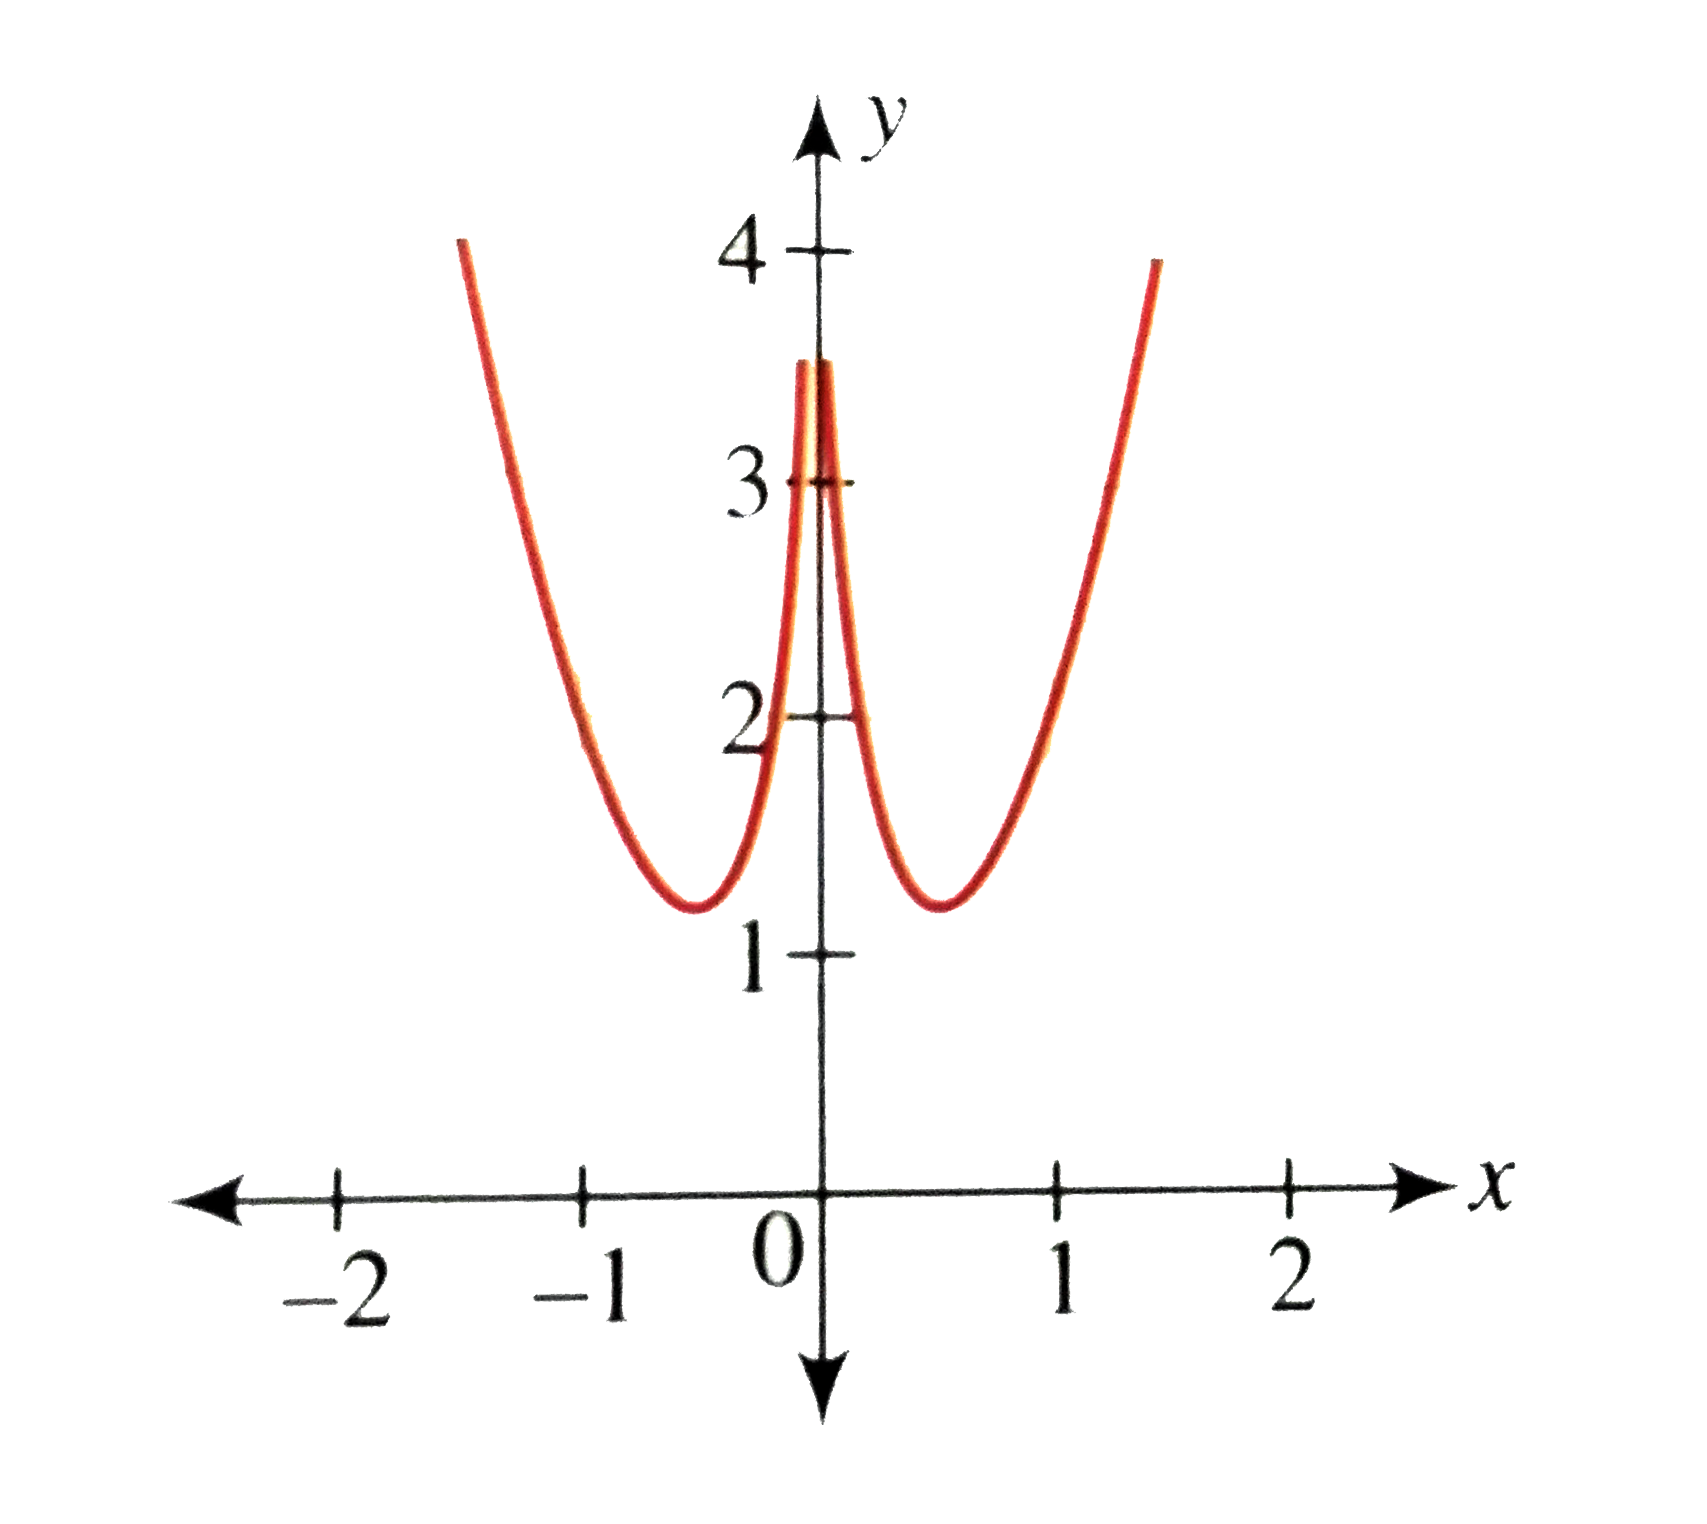
Draw the graph of the function f(x)=2x2−loge|x|
Text Solution
We have f(x)=2x2−loge|x|,x≠0
Clearly, f(x) is an even function, hence its graph is symmetrical about the y-axis.
limx→0+(2x2−loge|x|)=∞ and limx→±∞(2x2−loge|x|)=∞ (as difference between the value of 2x2 and ln|x| is infinite, loge|x| increases very slowly, but 2x2 increases faster)
Also f′(x)=4x−1x=4x2−1x
f′(x)=0⇒x=±12
From the limiting values of the function at x=0 and at inifinity, we can conclude that x=±12 are points of minima.
From the above discussion, the graph of the function is as shown in the following figure.

|
Topper's Solved these Questions
Similar Questions
Draw the graph of the function f(x)=2x−|x|
View SolutionDraw the graph of the function: f(x)=log|x|
View SolutionDraw the graph of the function: f(x)=log|x|
View SolutionDraw the graph of the function: f(x)=∣∣x2−3∣∣x|+2|
View SolutionDraw the graph of the function: f(x)=∣∣x2−3∣∣x|+2|
View SolutionDraw the graph of the following function.
f(2x)
View SolutionDraw the graph of the following function.
2f(x)
View SolutionDraw the graph of the following function.
2f(x)
View SolutionWrite the equivalent definition and draw the graphs of the following functions. f(x)=sgn((log)e|x|)
View SolutionDraw and discuss the graph of the function f(x)=e1/x
View Solution
