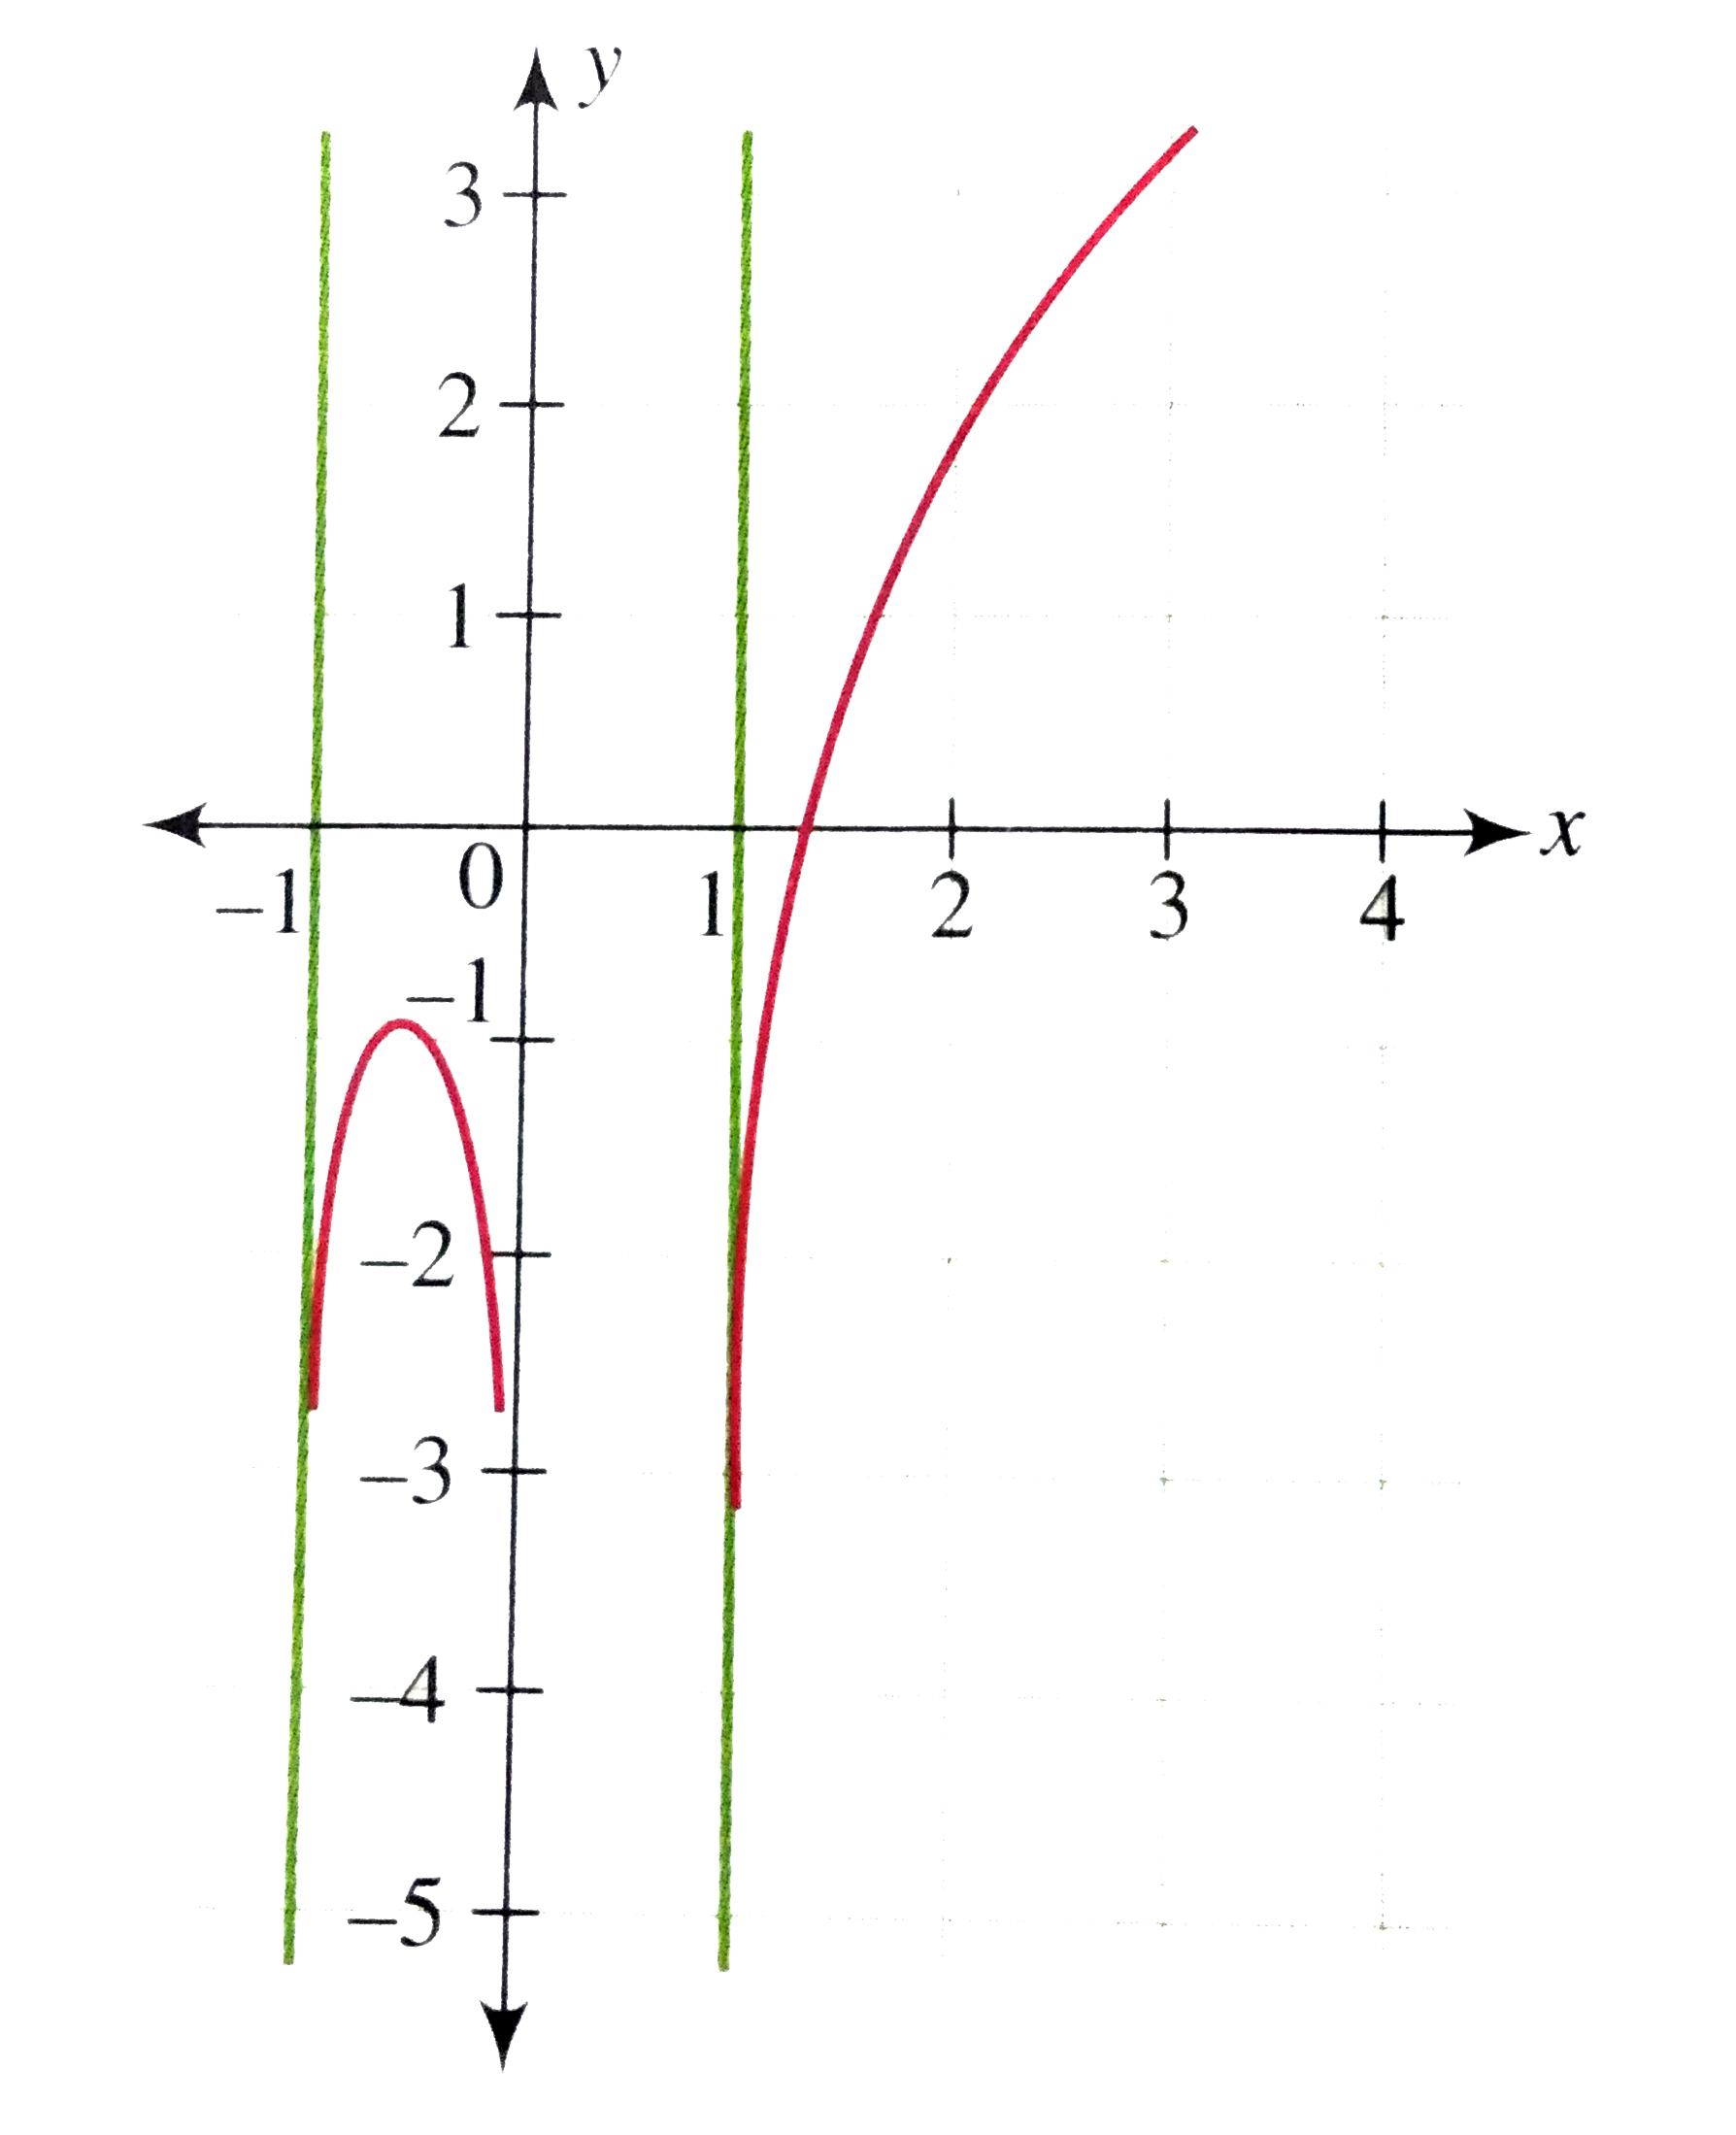
Draw the graph of y=loge(x3−x)
Video Solution
Text Solution
y=f(x)=loge(x3−x)
Here the function is defined if x3−x≥0
or x(x−1)(x+1)≥0
or x∈(−1,0)∪(1,∞)
limx→1+loge(x3−x)=loge0+=−∞
limx→0−logex(x2−1)=loge0+=−∞
logx→−1+ex(x2−1)=loge0+=−∞
For x>1,x3−x increases, so loge(x3−x) increases till infinity.
Also for f′(x)=3x2−1x3−1=0,x=−1√3 [as domain is (−1,0)∪(1,∞)]
Clearly, x=−1√3 is the point of maxima.
The graph of the function is as shown in the following figure.

|
Topper's Solved these Questions
Similar Questions
Draw the graph of y=loge(x2−1)
View SolutionDraw the graph of y=(logex)2
View SolutionDraw the graph of y=1logex
View SolutionDraw the graph of y=|x|
View SolutionDraw the graph of y=|loge(x+3)|.
View SolutionDraw the graph of y=−x
View SolutionDraw the graph of y=loge(−x),−logex,y=|logex|,y=loge|x| and y=|loge|x|| transforming the graph of y=logex.
View SolutionDraw the graph of y=|loge|x||.
View SolutionDraw the graph of y=loge(x+√x2+1)
View SolutionDraw the graph of y=logx√x
View Solution