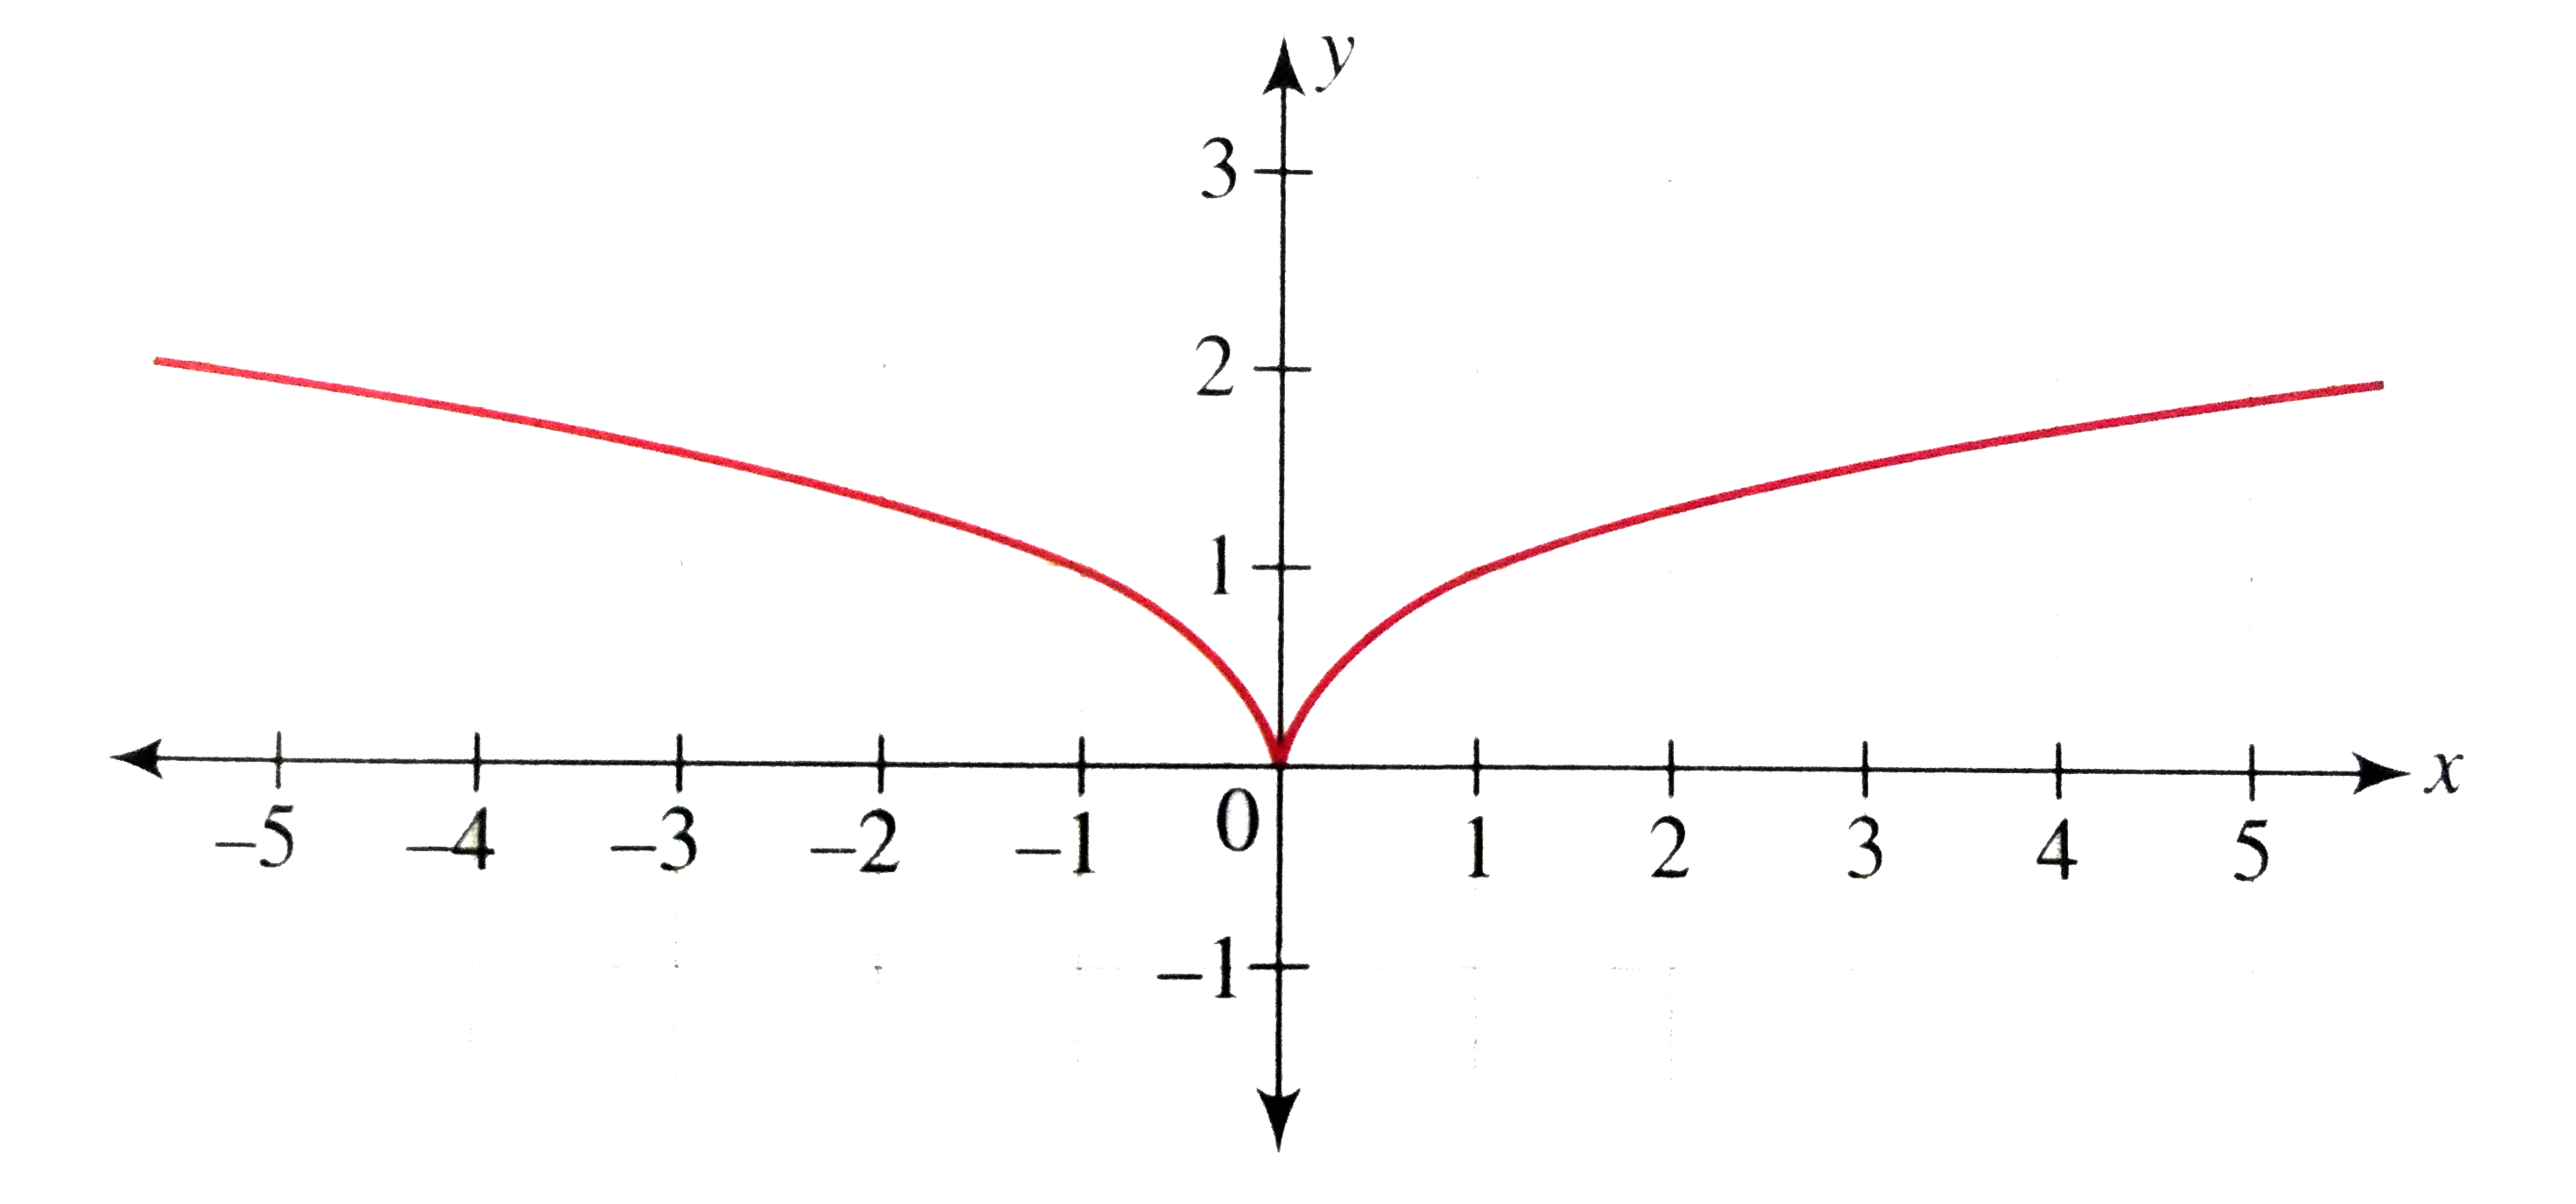
Draw the graph of y=x2/5
Video Solution
Text Solution
Domain of the function is R.
f(0)=0
Also f(x)≥0 for all x∈R.
f′(x)=25x35
f′(x)>0 for x>0, where f(x) increases and f′(x)<0 for x<0, where f(x) decreases.
Also f′(x) does not exist at x=0
At x=0,f(x) is non- differentiable as y=f(x) has a vertical tangent here.
f''(x)=−625x85<0
Thus, the graph is always concave downward.
The graph of the function is as shown in the following figure.

|
Topper's Solved these Questions
Similar Questions
Draw the graph of y=x3/5
View SolutionDraw the graph of y=2x.
View SolutionDraw the graph of y=|x|
View SolutionDraw the graph of y=x2+1
View SolutionDraw the graph of y=|x|+2
View SolutionDraw the graph of y=(x2−x5)(x−2)3.
View SolutionDraw the graph of y=∣∣|x|2−2∣∣x|−3|, if the graph for y=x2−2x−3 is given.
View SolutionDraw the graph of y=1x2.
View SolutionDraw the graph of y=x2+1x2,x≠0.
View SolutionDraw the graph of y=∣∣x2−2x∣∣−x.
View Solution