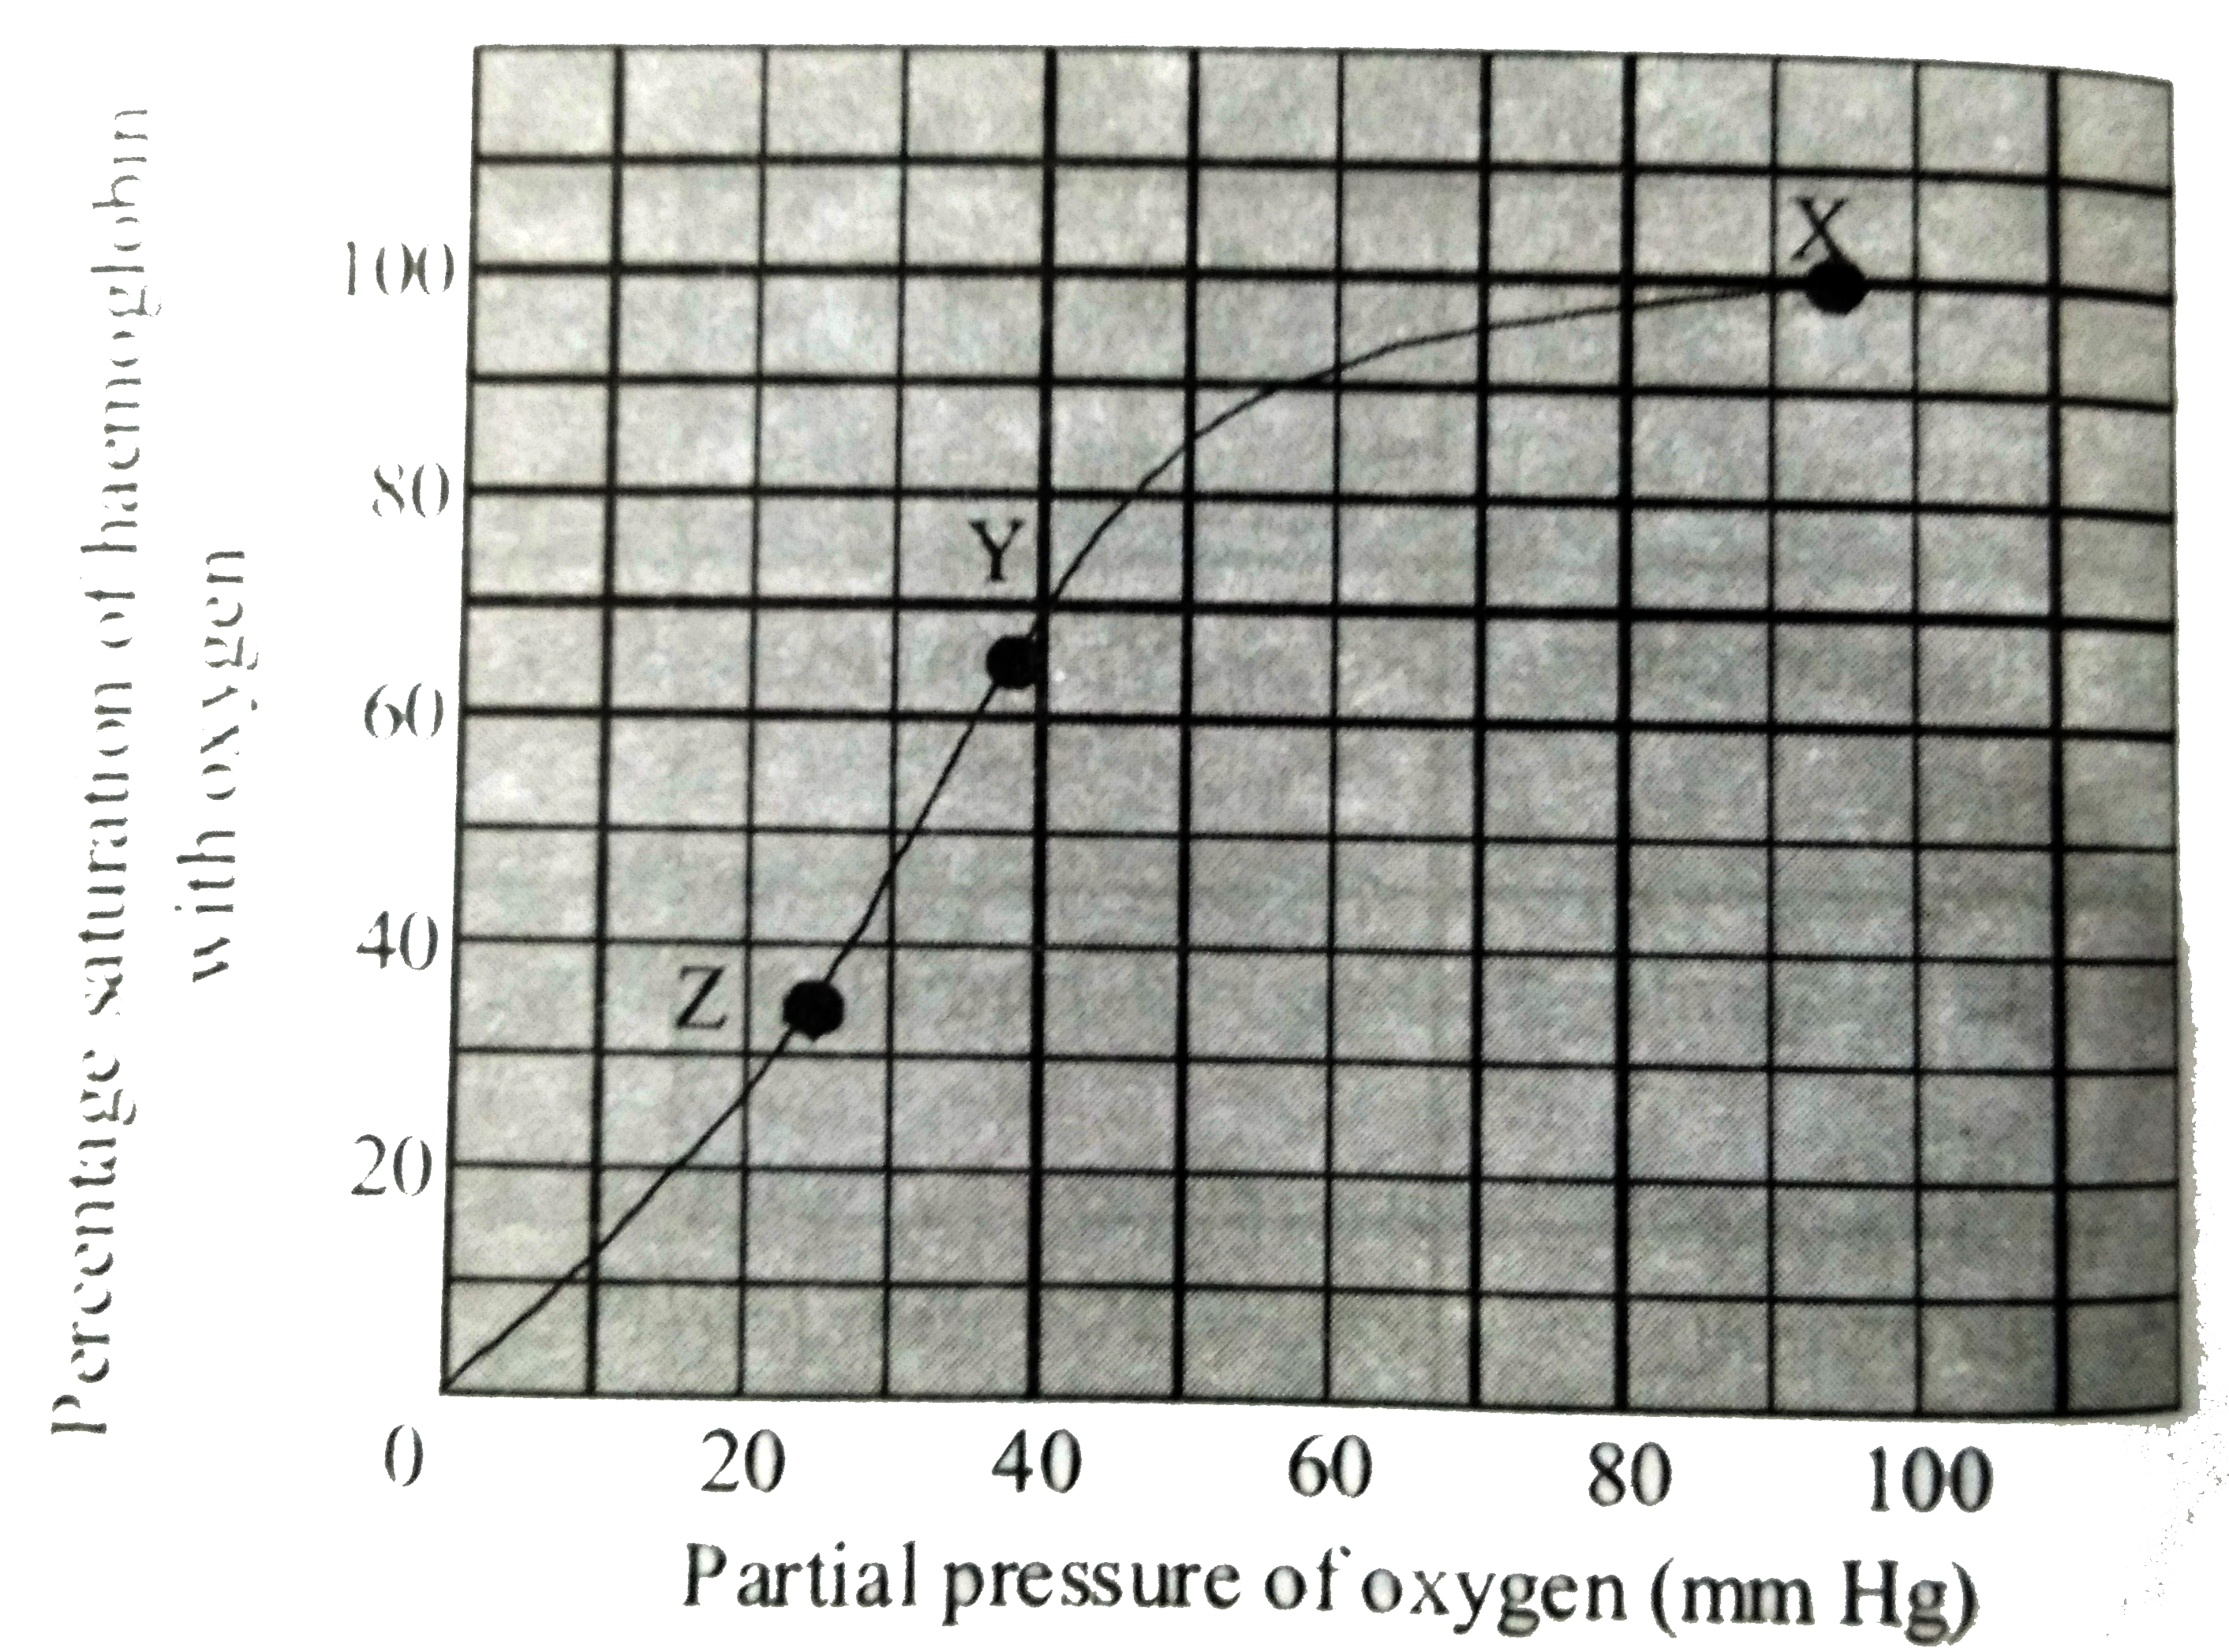
Given below graphs an oxygen dissociation curve :−

Where in the body will haemoglobin be saturation at the percentage shown at points X,Y and Z.
X- Pulmonary artery, Y-Pulmonary vein, Z-Carotide artery
X-Systemic artery, Y-Pulmonary atery, Z-Pulmonary vein
X-Pulmonary vein, Y-Systemic vein, Z-Systemic vein during exercise
X-Lef ventricle , Y-Right ventricle, Z-Systemic artery
The correct Answer is:3
Step by step video, text & image solution for Given below graphs an oxygen dissociation curve :- Where in the body will haemoglobin be saturation at the percentage shown at points X,Y and Z. by Biology experts to help you in doubts & scoring excellent marks in Class 12 exams.
Updated on:21/07/2023Similar Questions
Knowledge Check
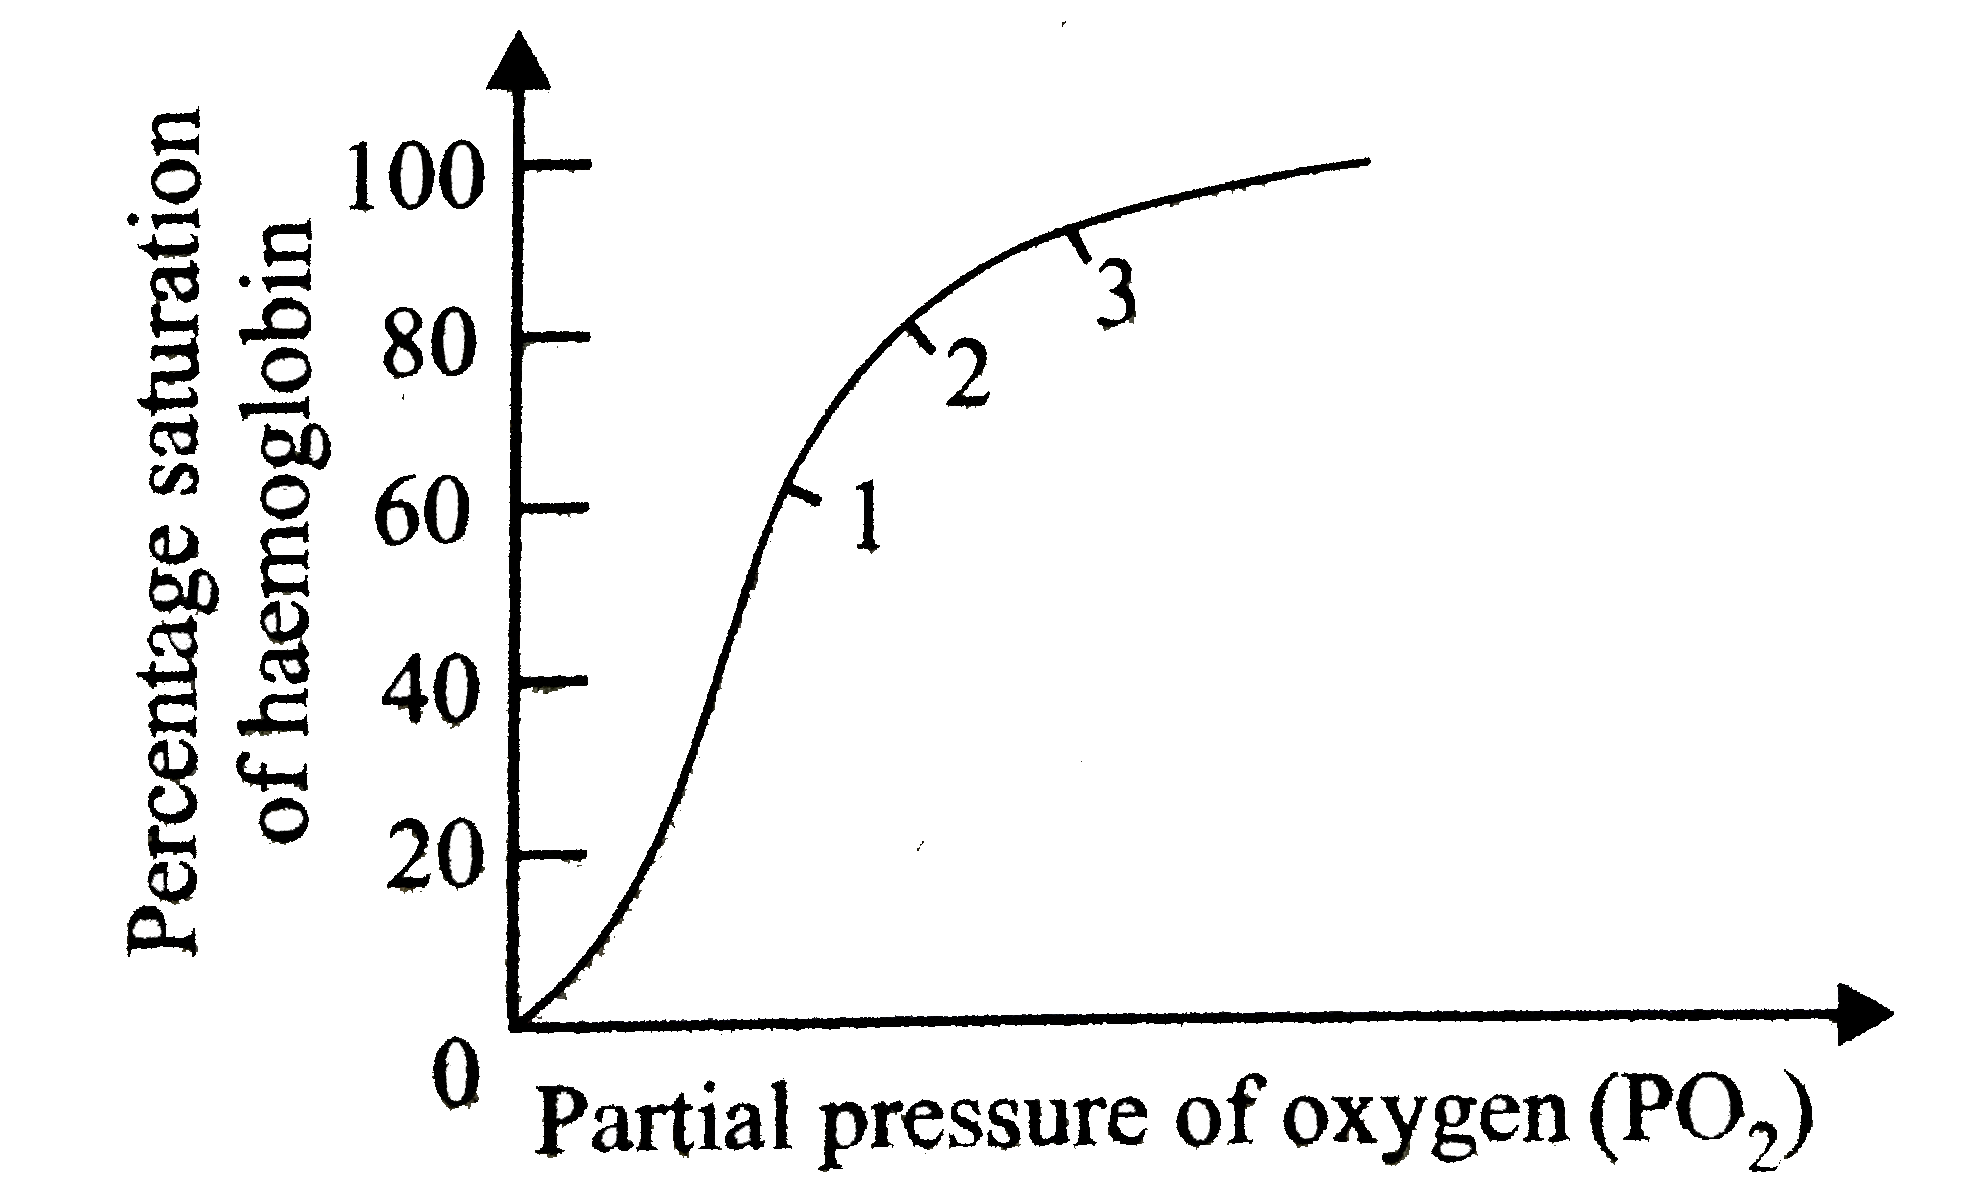
The given graph shows an oxygen dissociation curve for haemoglobin.

Wher is the body will haemoglobin be saturated at the percentage shown at point 1,2 and 3 in graph ?ALeft ventriclePulmonary veinVena cava123BLeft ventriclePulmonary veinVena cava213CLeft ventriclePulmonary veinVena cava231DLeft ventriclePulmonary veinVena cava321Oxygen dissociation curve of haemoglobin is
AsigmoidBhyperbolicChypobolicDhypobloicIn oxygen dissociation curve x-axis and y-axis represent
 Ax-axis - partial pressure of oxygen
y-axis percentage saturation of Hb with oxygenBx-axis - partial pressure of oxygen
y-axis - partial pressure of oxygenCx-axis - partial pressure of CO2
y-axis - percentage saturation of oxyhaemoglobin with oxygenDx-axis partial pressure of CO2
y-axis - partial pressure of oxygen
Oxygen-haemoglobin dissociation curve is
View SolutionAt higher O2 concentration, oxygen dissociation curve of haemoglobin will '
View SolutionIn which conditon oxygen dissociation curve of haemoglobin shift to right of normal curve ?
View SolutionThe oxygen-haemoglobin dissociation curve will show a right shift in case of
View SolutionThe oxygen - haemoglobin dissociation curve will show a right shift in case of
View Solution

