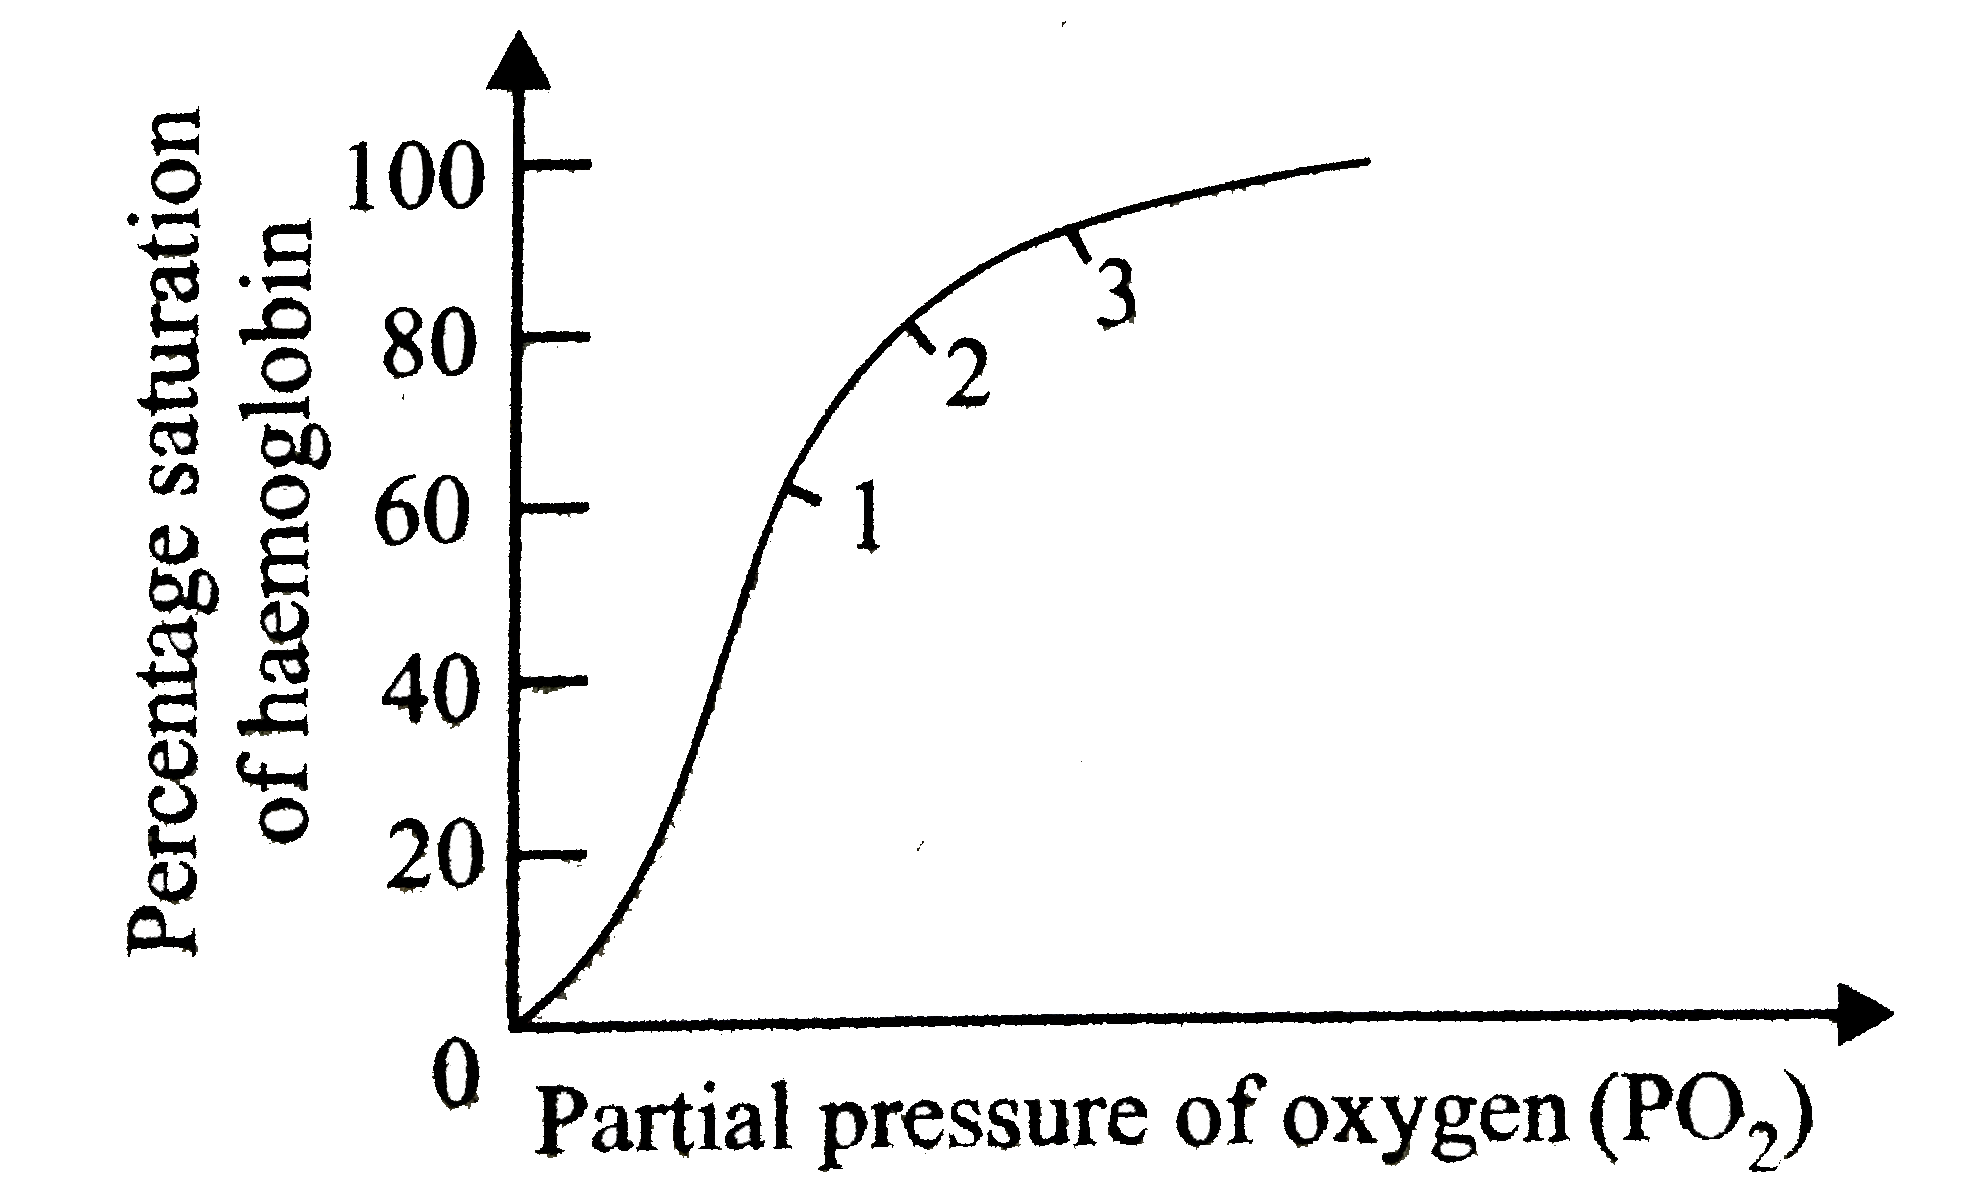
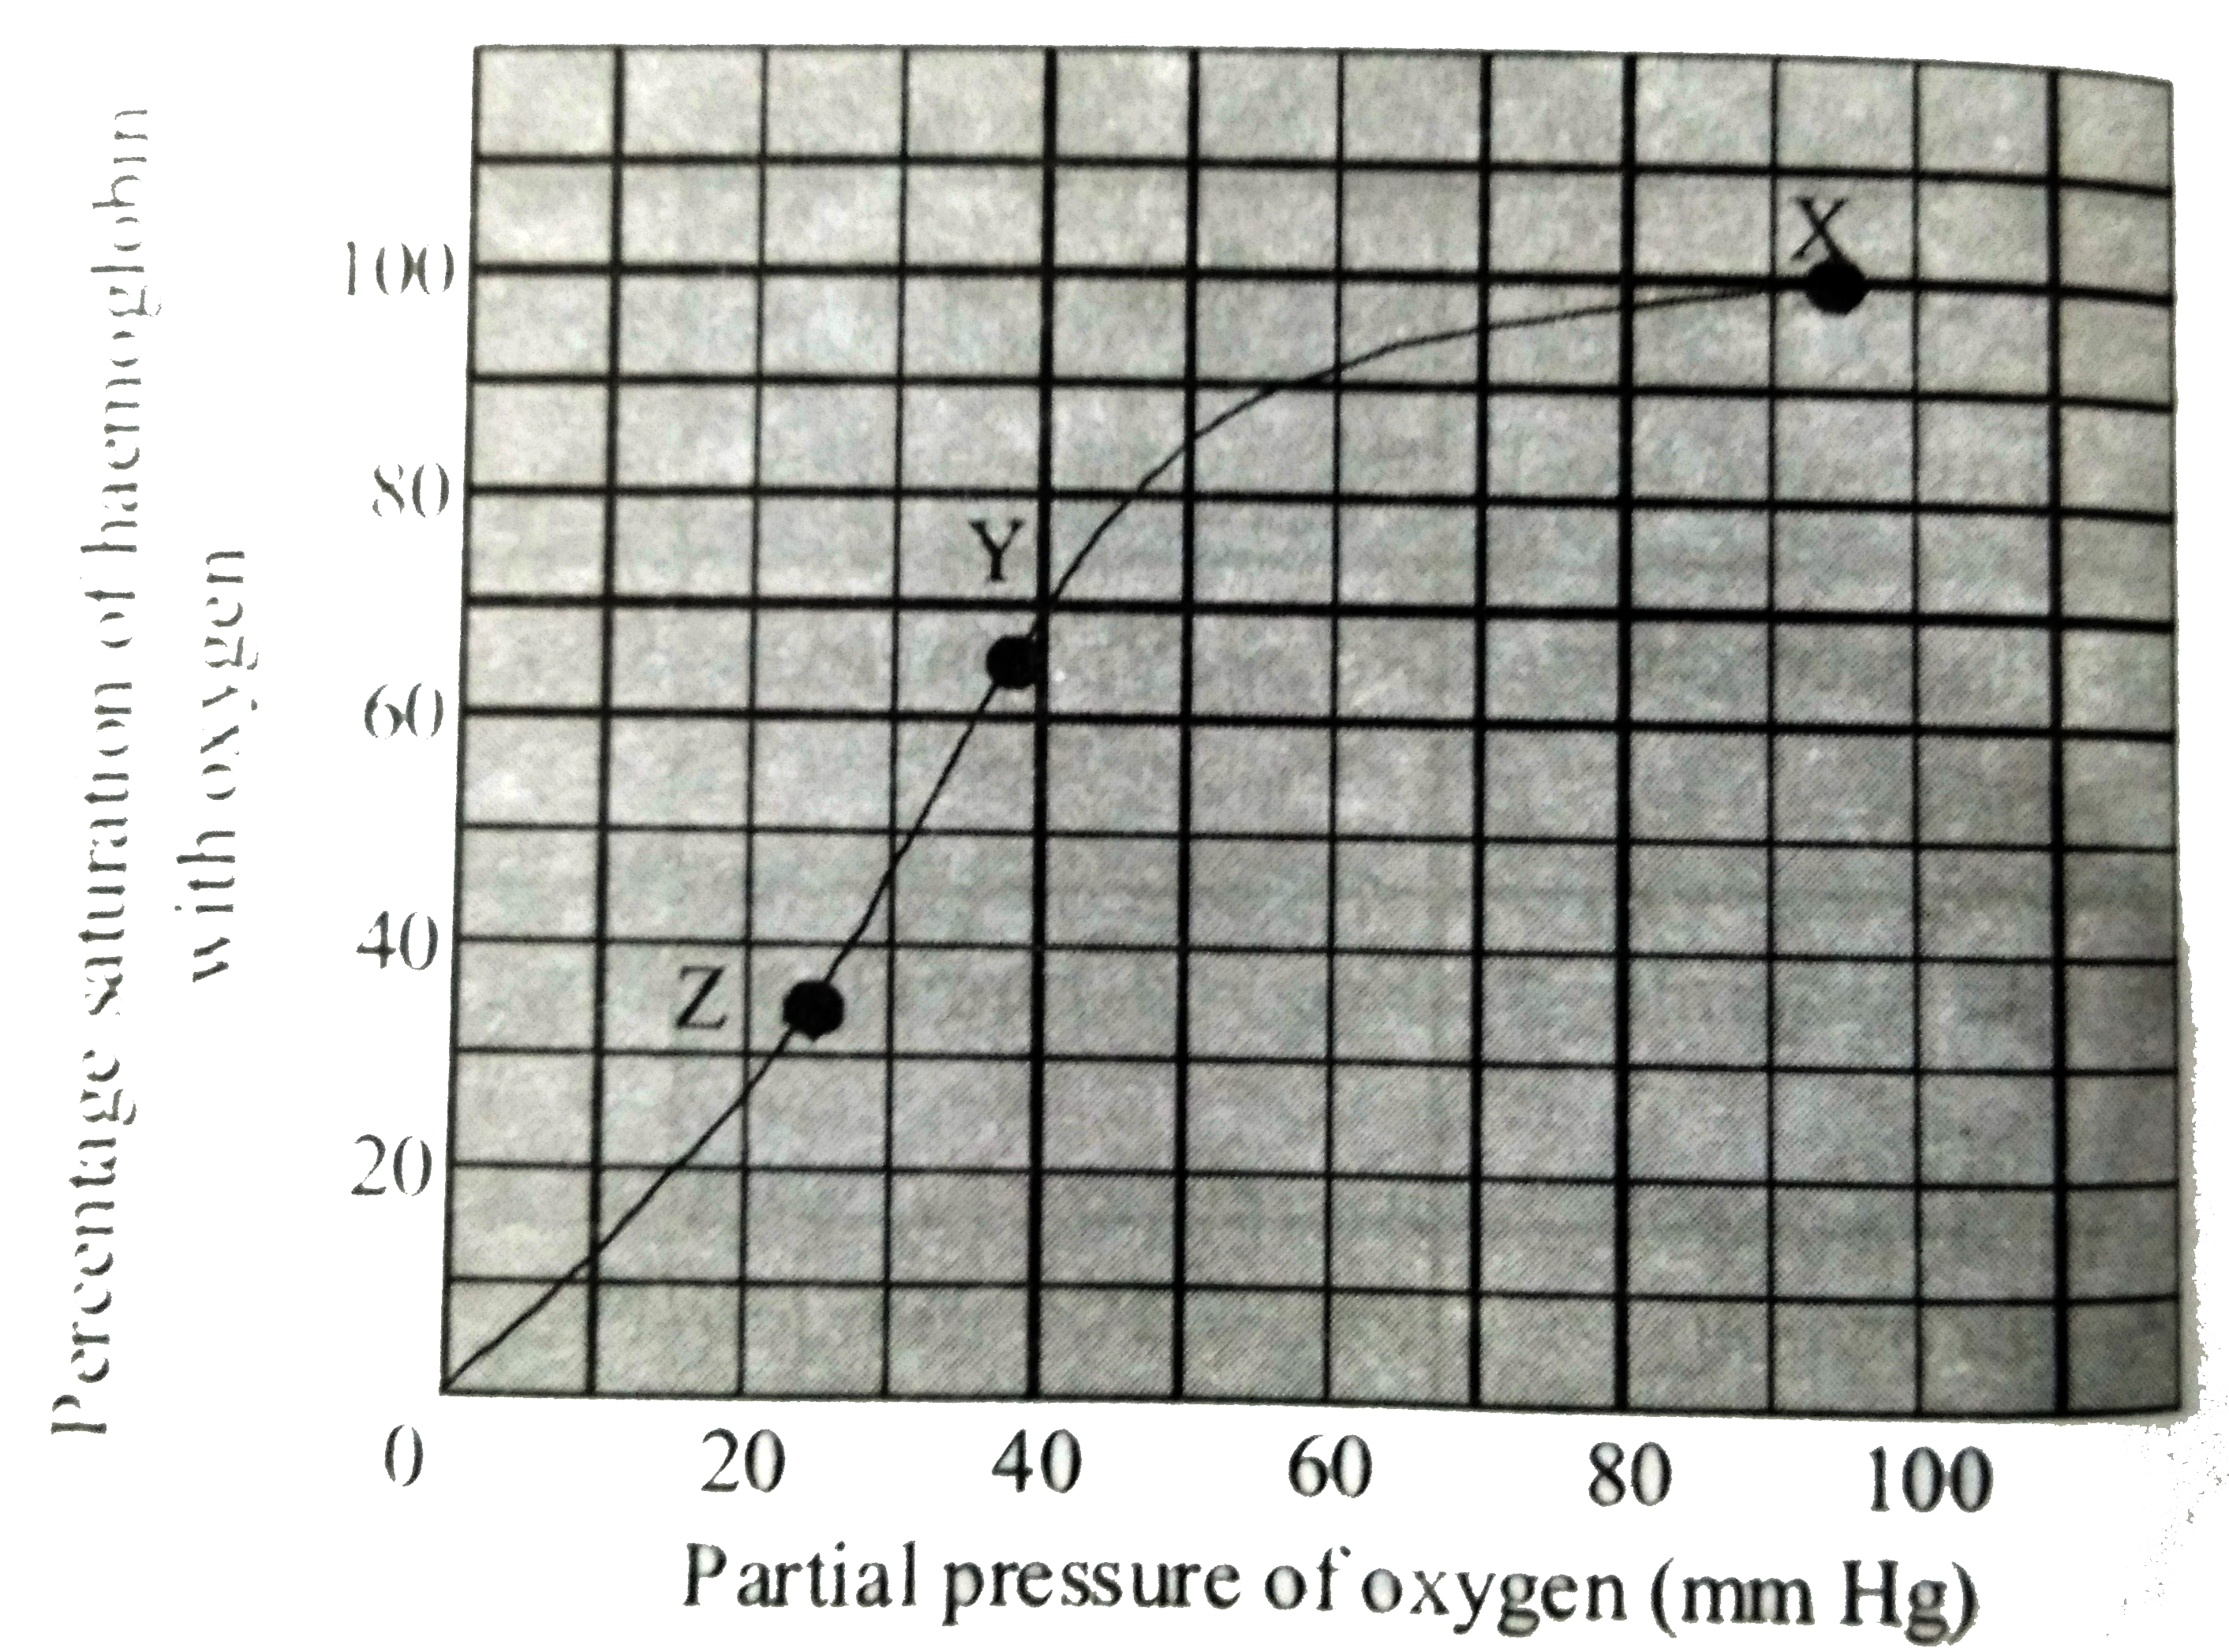
The given graph shows an oxygen dissociation curve for haemoglobin.

Wher is the body will haemoglobin be saturated at the percentage shown at point and in graph ?
The correct Answer is:C
The relationship between the partial pressure of and percentage saturation of the Hb with is graphically illustrated by a curve called oxygen dissociation curve. The haemoglobin is most saturated with oxygen in the pulmonary vein, as this vein is carrying oxygenated blood from the lungs towards the left auricle of the heart. From the left auricle the blood moves to the left ventrcile where saturation of Hb with slightly reduces. Vena cava carries deoxygenated blood from all the organs of the body towards right auricle, thus, Hb is less saturated with .
Topper's Solved these Questions
- BREATHING AND EXCHANGE OF GASESBOOK - NCERT FINGERTPS ENGLISHCHAPTER - BREATHING AND EXCHANGE OF GASESEXERCISE - Higher Order Thinking
12 Videos
- BREATHING AND EXCHANGE OF GASESBOOK - NCERT FINGERTPS ENGLISHCHAPTER - BREATHING AND EXCHANGE OF GASESEXERCISE - Exemplar Problems
13 Videos
- BODY FLUIDS AND CIRCULATIONBOOK - NCERT FINGERTPS ENGLISHCHAPTER - BODY FLUIDS AND CIRCULATIONEXERCISE - Body Fluids And Circulation
151 Videos
- CELL - THE UNIT OF LIFEBOOK - NCERT FINGERTPS ENGLISHCHAPTER - CELL - THE UNIT OF LIFEEXERCISE - Cell - The Unit Of Life
159 Videos
Similar Questions
Knowledge Check
The oxygen - haemoglobin dissociation curve will show a right shift in case of
Ahigh PCO2Bhigh PO2Clow PCO2Dless H+ concentrations
What is the shape of O2 dissociation curve for haemoglobin ?
View SolutionIn which conditon oxygen dissociation curve of haemoglobin shift to right of normal curve ?
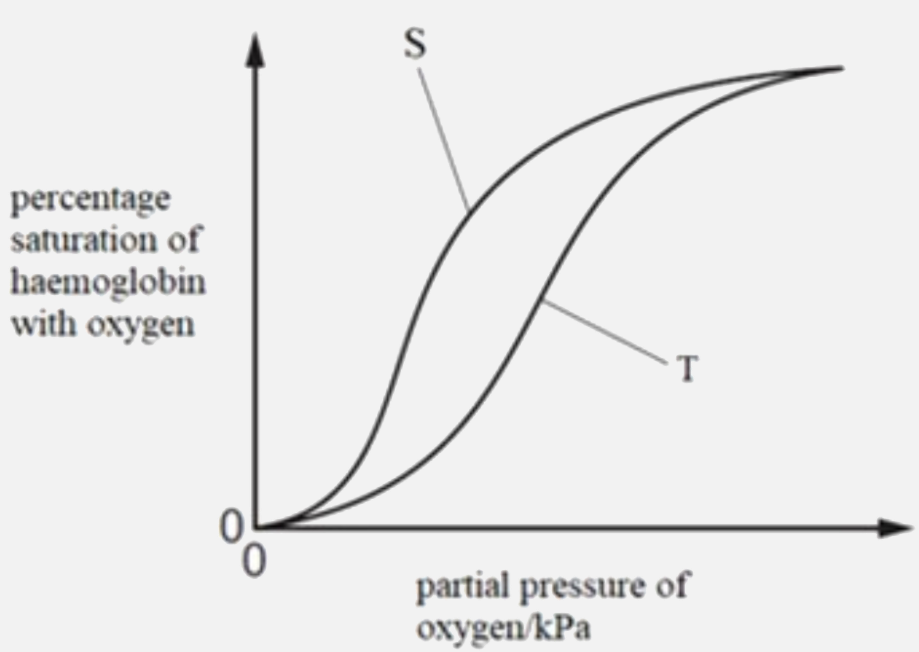
View SolutionThe graph shows the oxygen dissociation curves of haemoglobin from two species of mammals, s and T .

Which statements could explain the difference in the oxygen dissociation curves of species S and species T ?
I. Species T has higher haemoglobin concentration in its red blood cells than species S.
II. The haemoglobin in species T has a lower affinity for oxygen than the haemoglobin in species S.
III. Species T may be living at a higher altitudes than species S.
View SolutionWhen parital pressure of CO2(pCO2) rises the oxygen dissociation curve of haemoglobin will
View SolutionThe percentage of haemoglobin saturated with oxygen will increase if the
View SolutionThe oxygen - haemoglobin dissociation curve will show a right shift in case of
View SolutionThe oxygen - haemoglobin dissociation curve will show a right shift in case of
View Solution

