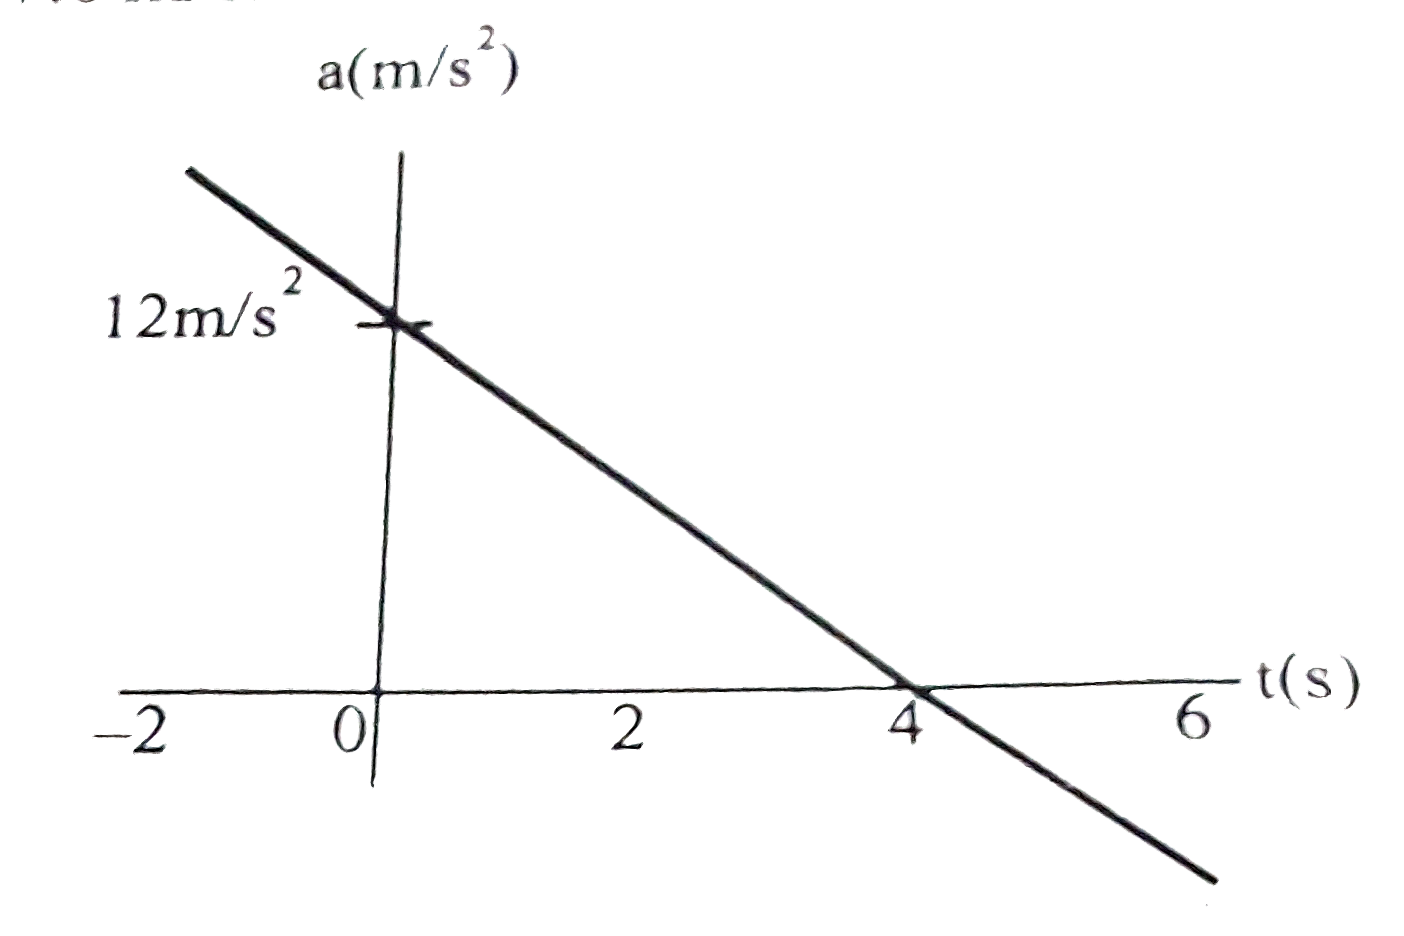
Figure gives the acceleration a versus time t for a particle moving along an x−axis.A=−2.0s, the particle's velocity is 7.0m/s. What is velocity (in m/s) at t=6.0s ?
The correct Answer is:[0055]
ΔV = area under graph 
tanθ=124=3
a6=3⇒a=18
a'2tanθ⇒a'=6
Area =12×18×6−12×6×2
V6−7=54−6=48
V6=55m/s
Topper's Solved these Questions
- TEST PAPERSBOOK - BANSALCHAPTER - TEST PAPERSEXERCISE - CHEMISTRY
133 Videos
- TEST PAPERSBOOK - BANSALCHAPTER - TEST PAPERSEXERCISE - MATHEMATICS
58 Videos
- TEST PAPERSBOOK - BANSALCHAPTER - TEST PAPERSEXERCISE - MATHS SECTION - 2 [MULTIPLE CORRECT CHOICE TYPE]
6 Videos
- PROBABILITYBOOK - BANSALCHAPTER - PROBABILITYEXERCISE - All Questions
1 Videos
- THERMODYNAMICSBOOK - BANSALCHAPTER - THERMODYNAMICSEXERCISE - Match the column
7 Videos
Similar Questions
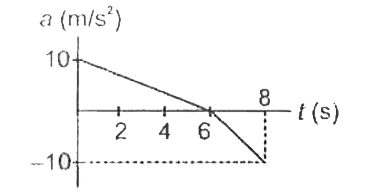
The acceleration - time graph for a particle moving along x - axis is shown in figure, If the initial velocity of particle is −5m/s, the velocity at t = 8 s is
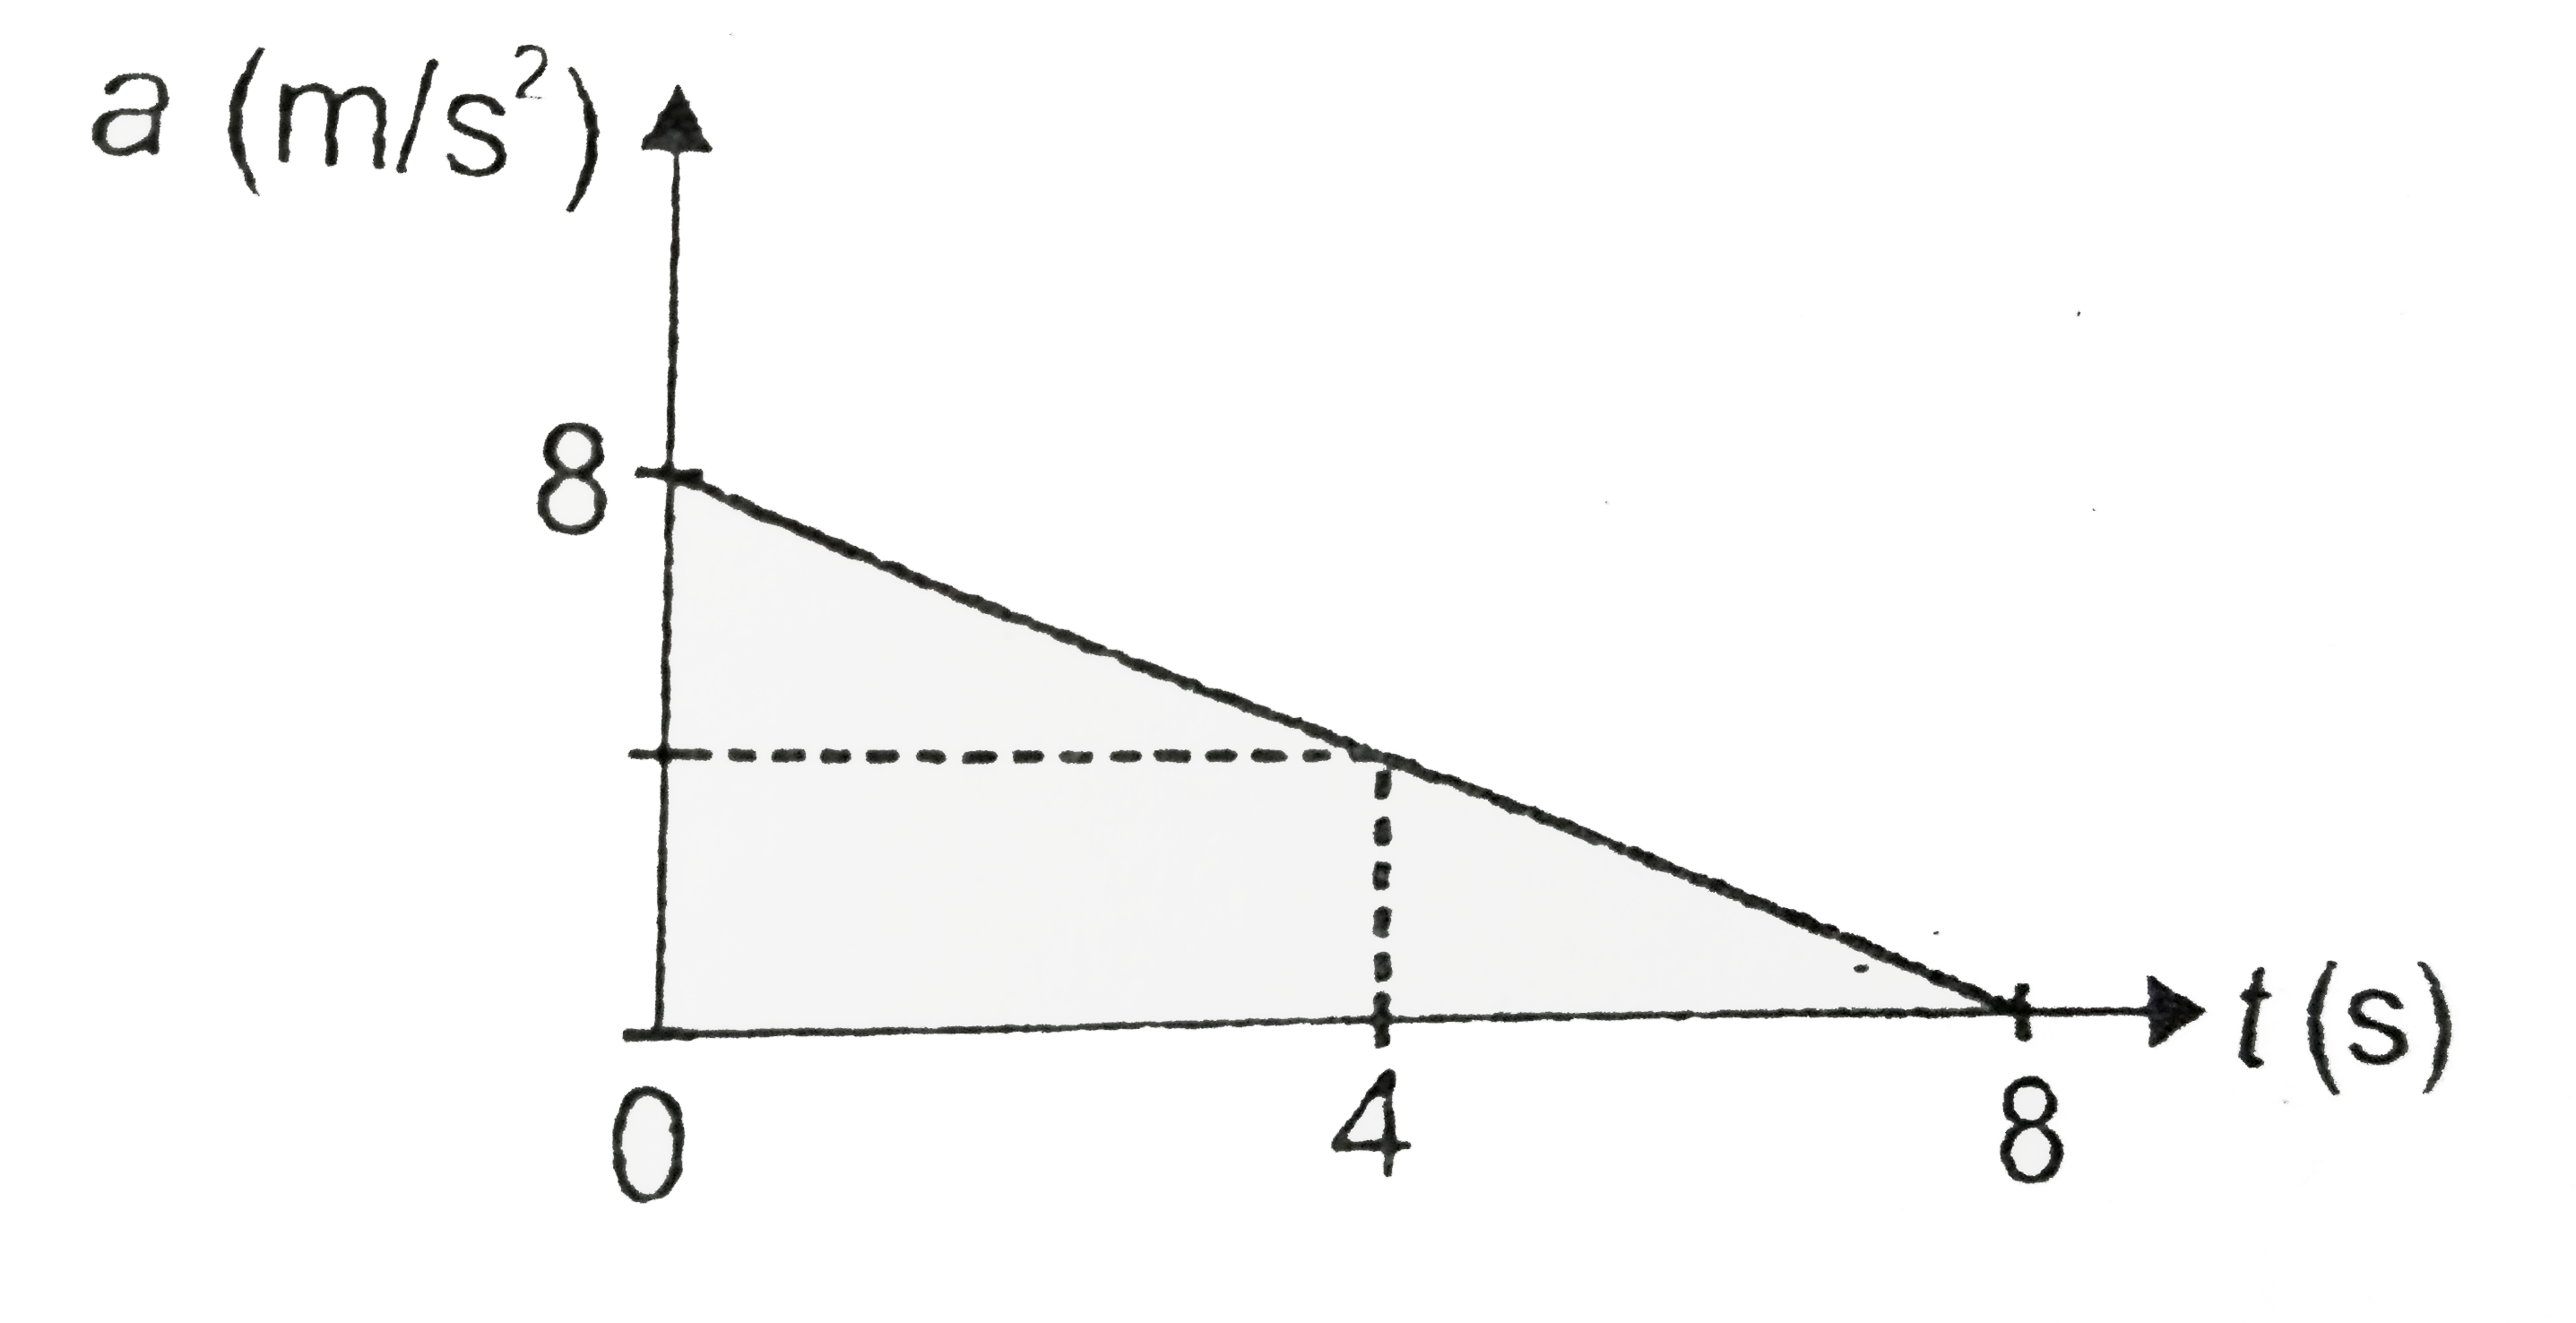
View SolutionThe acceleration-time graph of a particle moving along x-axis is shown in the figure. If the particle starts with velocity 3 m/s at t = 0, find the velocity of particle at t = 4 s.
View Solution
Knowledge Check
The acceleration - time graph for a particle moving along x - axis is shown in figure, If the initial velocity of particle is −5m/s, the velocity at t = 8 s is
 A+15m/sB+20m/sC−15m/sD−20m/s
Figure shows the graph of velocity versus time for a particle going along x axis. Initially at t = 0, particle is at x = 3m. Find position of particle at t = 2s. (in m)
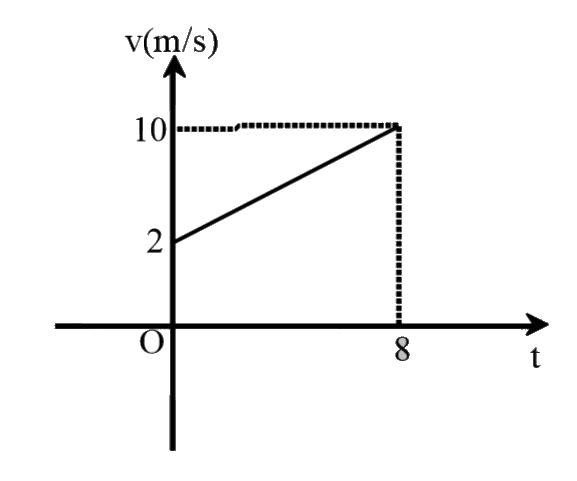 A9mB3mC12mD6m
vx is the velocity of a particle moving along the x-axis as shown in the figure. If x=2.0m at t=1.0s, what is the position of the particle at t=6.0s ?
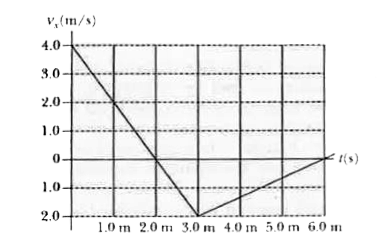 A−2.0 mB+2.0 mC+1.0 mD−1.0 m
The acceleration-time graph of a particle moving along x-axis is shown in the figure. If the particle starts with velocity 3 m/s at t = 0, find the velocity of particle at t = 4 s.

View SolutionConsider the v-t diagram of a particle moving along x axis as shown below.Velocity is in m/s and time is in seconds
View SolutionFigure shows the graph of x - coordinate of a particle moving along x - axis as a function of time. Average velocity during t = 0 to 6 s and instantaneous velocity at t = 3 s respectively, will be
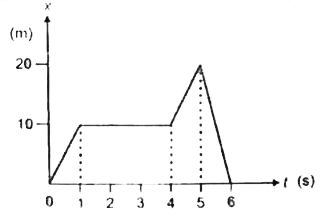
View SolutionFigure shows the graph of x-coordinate of a particle moving along x-axis as a function of time. Average velocity during t = 0 to 4 s and instantaneous velocity at t = 4.113 s respectively will be
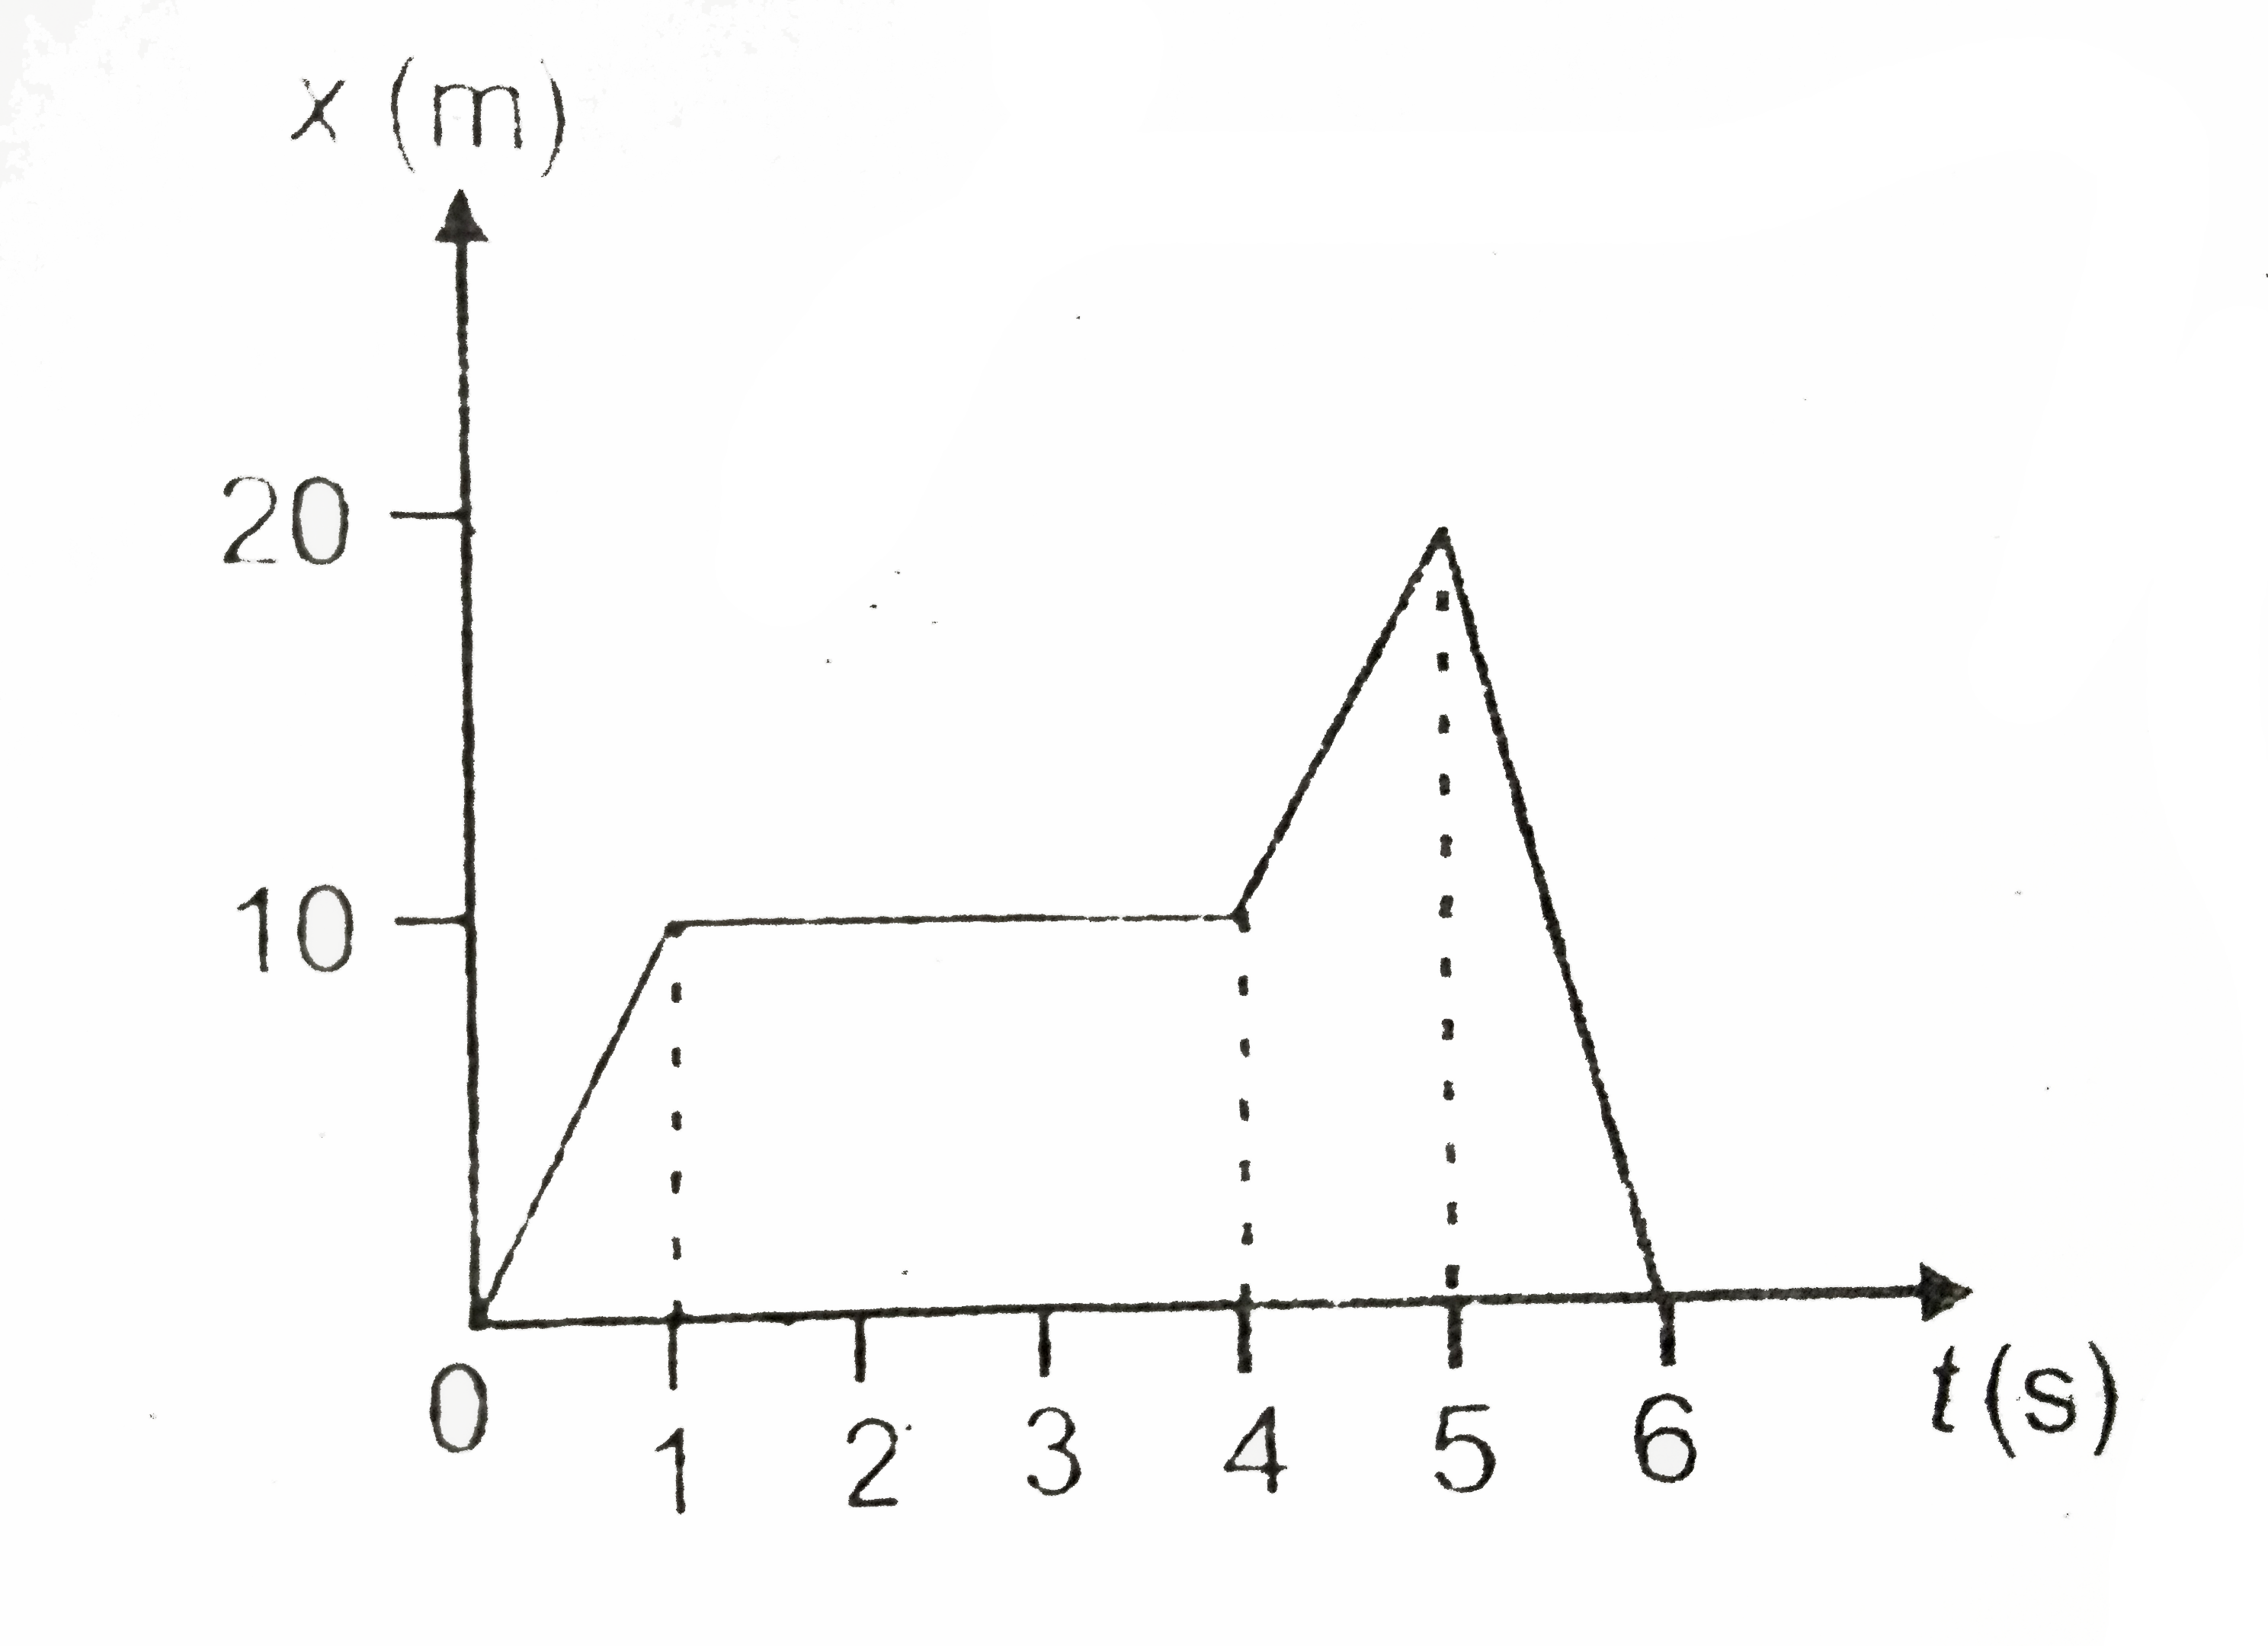
View SolutionFigure shows the graph of x - coordinate of a particle moving along x - axis as a function of time. Average velocity during t = 0 to 6 s and instantaneous velocity at t = 3 s respectively, will be

View Solution
